Laurel, VA (Virginia) Houses and Residents
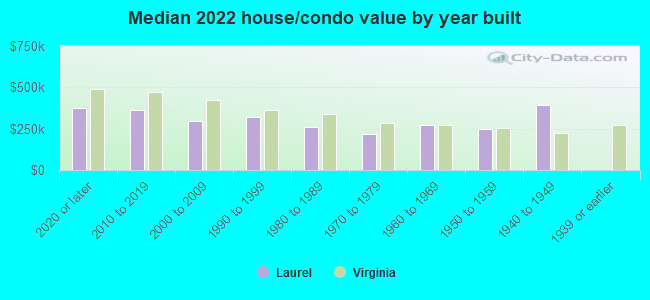
Estimated median house or condo value in 2022: $286,184 (it was $101,200 in 2000 )
Laurel:
$286,184Virginia:
$365,700
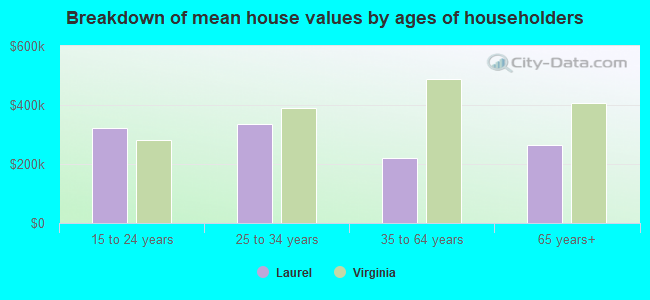
Lower value quartile - upper value quartile: $233,986 - $329,565Mean price in 2022: Detached houses: $277,378 Here:
$277,378State:
$472,865
Townhouses or other attached units: $224,815 Here:
$224,815State:
$457,437
In 5-or-more-unit structures: $135,431 Here:
$135,431State:
$382,551
Total population: 16,713 (Urban population: 14,602, Rural population: 0)
Houses: 7,871 (7,326 occupied: 3,770 owner occupied, 3,561 renter occupied )
% of renters here:
49%State:
33%
Housing density: 1,436 houses/condos per square mile
Median price asked for vacant for-sale houses and condos in 2022: $188,061.
Median contract rent in 2022: $1,283 (lower quartile is $1,064, upper quartile is $1,567)
Median rent asked for vacant for-rent units in 2022: $1,236
Median gross rent in Laurel, VA in 2022: $1,416
Housing units in Laurel with a mortgage: 2,894 (354 second mortgage, 9 home equity loan, 229 both second mortgage and home equity loan )Houses without a mortgage: 204
Median household income for houses/condos with a mortgage: $94,829
Median household income for apartments without a mortgage: $83,345
Median monthly housing costs: $1,348
Data:
Median house or condo value ($)
Median house or condo value ($ change since 2000)
Median house or condo value ($) - White
Median house or condo value ($) - Black or African American
Median house or condo value ($) - Asian
Median house or condo value ($) - Hispanic or Latino
Median house or condo value ($) - American Indian and Alaska Native
Median house or condo value ($) - Multirace
Median house or condo value ($) - Other Race
Median price asked for mobile homes ($)
Household density (households per square mile)
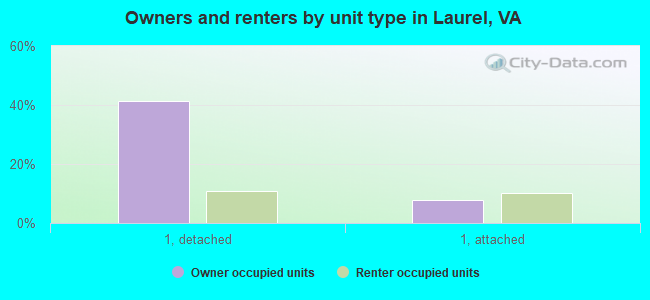
Mean house or condo value by units in structure - 1, detached ($)
Mean house or condo value by units in structure - 1, attached ($)
Mean house or condo value by units in structure - 2 ($)
Mean house or condo value by units in structure by units in structure - 3 or 4 ($)
Mean house or condo value by units in structure - 5 or more ($)
Mean house or condo value by units in structure - Boat, RV, van, etc. ($)
Mean house or condo value by units in structure - Mobile home ($)
Median contract rent ($)
Median contract rent - Lower quartile ($)
Median contract rent - Upper quartile ($)
Median gross rent ($)
Urban houses (%)
Rural houses (%)
Houses occupied (%)
Houses occupied (% change since 2000)
Houses owner occupied (%)
Houses owner occupied (% change since 2000)
Houses renter occupied (%)
Houses renter occupied (% change since 2000)
Vacant housing units - For rent (%)
Vacant housing units - For rent (% change since 2000)
Vacant housing units - For sale only (%)
Vacant housing units - For sale only (% change since 2000)
Vacant housing units - Rented or sold, not occupied (%)
Vacant housing units - Rented or sold, not occupied (% change since 2000)
Vacant housing units - For seasonal, recreational, or occasional use (%)
Vacant housing units - For seasonal, recreational, or occasional use (% change since 2000)
Vacant housing units - For migrant workers (%)
Vacant housing units - For migrant workers (% change since 2000)
Vacant housing units - Other vacant (%)
Vacant housing units - Other vacant (% change since 2000)
Median monthly housing costs ($)
Median household income for houses/condos with a mortgage ($)
Median household income for houses/condos without a mortgage ($)
Median household income ($)
Median household income ($) - White
Median household income ($) - Black or African American
Median household income ($) - Asian
Median household income ($) - Hispanic or Latino
Median household income ($) - American Indian and Alaska Native
Median household income ($) - Multirace
Median household income ($) - Other Race
Mortgage status - with mortgage (%)
Mortgage status - with second mortgage (%)
Mortgage status - with home equity loan (%)
Mortgage status - with both second mortgage and home equity loan (%)
Mortgage status - without a mortgage (%)
Median year house/condo built
Median year apartment built
Household type by relationship - Male householder living alone (%)
Household type by relationship - Male householder not living alone (%)
Household type by relationship - Female householder living alone (%)
Household type by relationship - Female householder not living alone (%)
Household type by relationship - Opposite-Sex spouse (%)
Household type by relationship - Same-Sex spouse (%)
Household type by relationship - Opposite-Sex unmarried partner (%)
Household type by relationship - Same-Sex unmarried partner (%)
Household type by relationship - In group quarters (%)
Size of family households - 2-person household (%)
Size of family households - 3-person household (%)
Size of family households - 4-person household (%)
Size of family households - 5-person household (%)
Size of family households - 6-person household (%)
Size of family households - 7-or-more-person household (%)
Size of nonfamily households - 1-person household (%)
Size of nonfamily households - 2-person household (%)
Size of nonfamily households - 3-person household (%)
Size of nonfamily households - 4-person household (%)
Size of nonfamily households - 5-person household (%)
Size of nonfamily households - 6-person household (%)
Size of nonfamily households - 7-or-moreperson household (%)
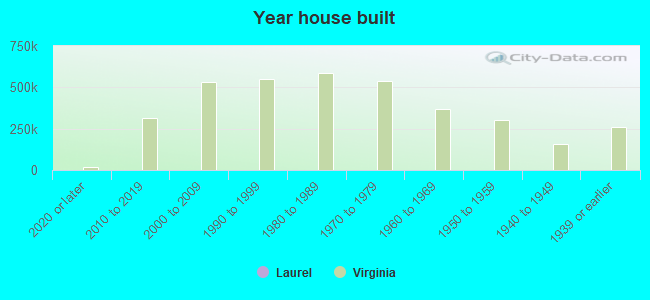
Year house built - Built 2010 or later (%)
Year house built - Built 2000 to 2009 (%)
Year house built - Built 1990 to 1999 (%)
Year house built - Built 1980 to 1989 (%)
Year house built - Built 1970 to 1979 (%)
Year house built - Built 1960 to 1969 (%)
Year house built - Built 1950 to 1959 (%)
Year house built - Built 1940 to 1949 (%)
Year house built - Built 1939 or earlier (%)
Median number of rooms in houses and condos
Median number of rooms in apartments
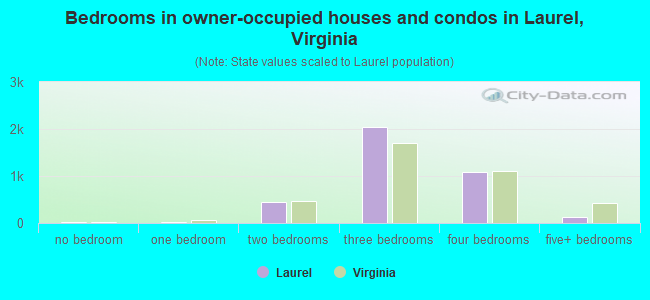
Median number of bedrooms in owner occupied houses
Mean number of bedrooms in owner occupied houses
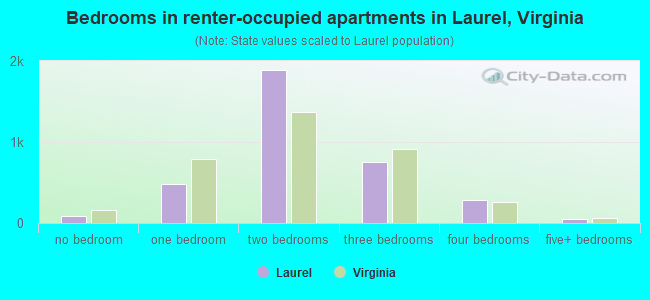
Median number of bedrooms in renter occupied houses
Mean number of bedrooms in renter occupied houses
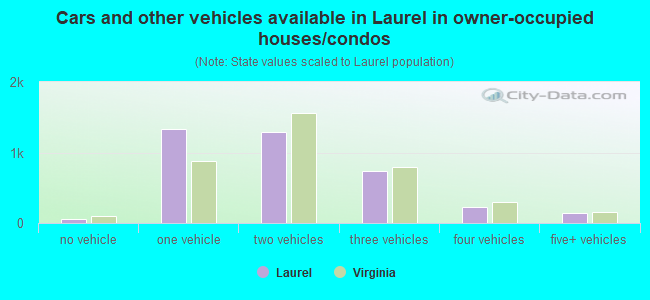
Median number of vehichles in owner occupied houses
Mean number of vehichles in owner occupied houses
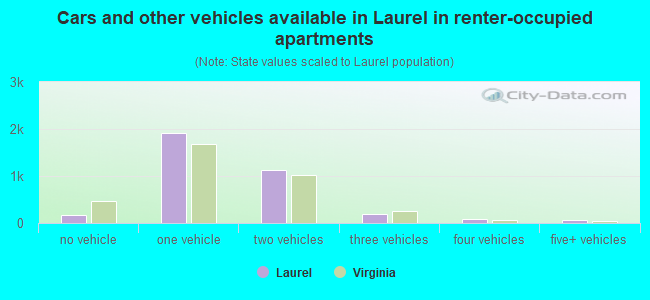
Median number of vehichles in renter occupied houses
Mean number of vehichles in renter occupied houses
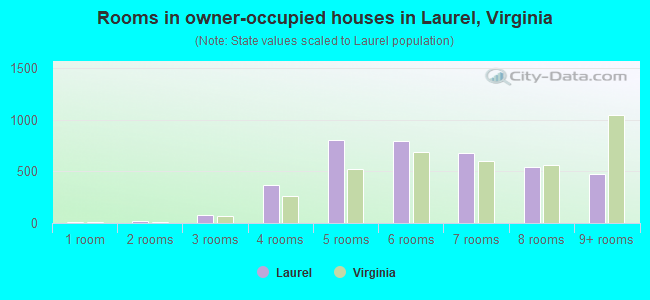
Rooms in owner-occupied houses - 1 room (%)
Rooms in owner-occupied houses - 2 rooms (%)
Rooms in owner-occupied houses - 3 rooms (%)
Rooms in owner-occupied houses - 4 rooms (%)
Rooms in owner-occupied houses - 5 rooms (%)
Rooms in owner-occupied houses - 6 rooms (%)
Rooms in owner-occupied houses - 7 rooms (%)
Rooms in owner-occupied houses - 8 rooms (%)
Rooms in owner-occupied houses - 9+ rooms (%)
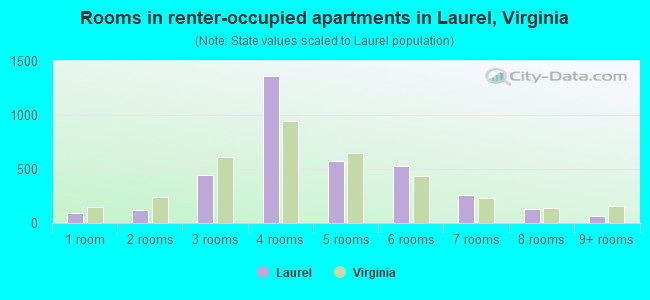
Rooms in renter-occupied houses - 1 room (%)
Rooms in renter-occupied houses - 2 rooms (%)
Rooms in renter-occupied houses - 3 rooms (%)
Rooms in renter-occupied houses - 4 rooms (%)
Rooms in renter-occupied houses - 5 rooms (%)
Rooms in renter-occupied houses - 6 rooms (%)
Rooms in renter-occupied houses - 7 rooms (%)
Rooms in renter-occupied houses - 8 rooms (%)
Rooms in renter-occupied houses - 9+ rooms (%)
Bedrooms in owner-occupied houses - no bedrooms (%)
Bedrooms in owner-occupied houses - 1 bedroom (%)
Bedrooms in owner-occupied houses - 2 bedrooms (%)
Bedrooms in owner-occupied houses - 3 bedrooms (%)
Bedrooms in owner-occupied houses - 4 bedrooms (%)
Bedrooms in owner-occupied houses - 5+ bedrooms (%)
Bedrooms in renter-occupied houses - no bedrooms (%)
Bedrooms in renter-occupied houses - 1 bedroom (%)
Bedrooms in renter-occupied houses - 2 bedrooms (%)
Bedrooms in renter-occupied houses - 3 bedrooms (%)
Bedrooms in renter-occupied houses - 4 bedrooms (%)
Bedrooms in renter-occupied houses - 5+ bedrooms (%)
Vehicles available in owner-occupied houses - no vehicle available (%)
Vehicles available in owner-occupied houses - 1 vehicle available(%)
Vehicles available in owner-occupied houses - 2 Vehicles available (%)
Vehicles available in owner-occupied houses - 3 Vehicles available (%)
Vehicles available in owner-occupied houses - 4 Vehicles available (%)
Vehicles available in owner-occupied houses - 5+ Vehicles available (%)
Vehicles available in renter-occupied houses - no vehicle available (%)
Vehicles available in renter-occupied houses - 1 vehicle available (%)
Vehicles available in renter-occupied houses - 2 Vehicles available (%)
Vehicles available in renter-occupied houses - 3 Vehicles available (%)
Vehicles available in renter-occupied houses - 4 Vehicles available (%)
Vehicles available in renter-occupied houses - 5+ Vehicles available (%)
Housing units in structures - 1, detached (%)
Housing units in structures - 1, attached (%)
Housing units in structures - 2 (%)
Housing units in structures - 3 or 4 (%)
Housing units in structures - 5 to 9 (%)
Housing units in structures - 10 to 19 (%)
Housing units in structures - 20 to 49 (%)
Housing units in structures - 50 or more (%)
Housing units in structures - Mobile home (%)
Housing units in structures - Boat, RV, van, etc. (%)
Housing units in structures - Owners - 1, detached (%)
Housing units in structures - Owners - 1, attached (%)
Housing units in structures - Owners - 2 (%)
Housing units in structures - Owners - 3 or 4 (%)
Housing units in structures - Owners - 5 to 9 (%)
Housing units in structures - Owners - 10 to 19 (%)
Housing units in structures - Owners - 20 to 49 (%)
Housing units in structures - Owners - 50 or more (%)
Housing units in structures - Owners - Mobile home (%)
Housing units in structures - Owners - Boat, RV, van, etc. (%)
Housing units in structures - Renters - 1, detached (%)
Housing units in structures - Renters - 1, attached (%)
Housing units in structures - Renters - 2 (%)
Housing units in structures - Renters - 3 or 4 (%)
Housing units in structures - Renters - 5 to 9 (%)
Housing units in structures - Renters - 10 to 19 (%)
Housing units in structures - Renters - 20 to 49 (%)
Housing units in structures - Renters - 50 or more (%)
Housing units in structures - Renters - Mobile home (%)
Housing units in structures - Renters - Boat, RV, van, etc. (%)
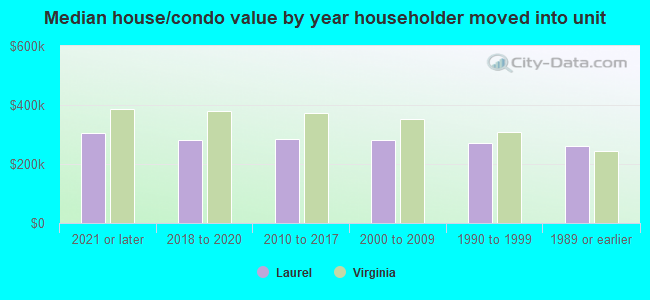
House/condo owner moved in on average (years ago)
Renter moved in on average (years ago)
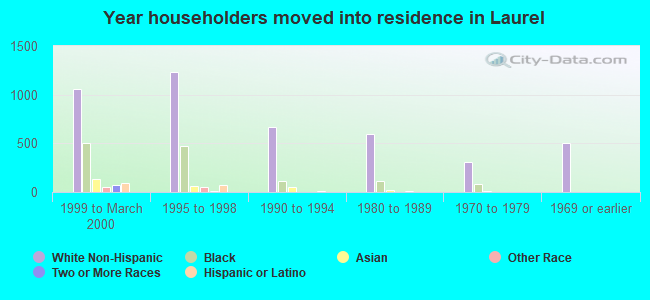
Year householder moved into unit - Moved in 1999 to March 2000 (%)
Year householder moved into unit - Moved in 1999 to March 2000 (%) - White
Year householder moved into unit - Moved in 1999 to March 2000 (%) - Black or African American
Year householder moved into unit - Moved in 1999 to March 2000 (%) - Asian
Year householder moved into unit - Moved in 1999 to March 2000 (%) - Hispanic or Latino
Year householder moved into unit - Moved in 1999 to March 2000 (%) - American Indian and Alaska Native
Year householder moved into unit - Moved in 1999 to March 2000 (%) - Multirace
Year householder moved into unit - Moved in 1999 to March 2000 (%) - Other Race
Year householder moved into unit - Moved in 1995 to 1998 (%)
Year householder moved into unit - Moved in 1995 to 1998 (%) - White
Year householder moved into unit - Moved in 1995 to 1998 (%) - Black or African American
Year householder moved into unit - Moved in 1995 to 1998 (%) - Asian
Year householder moved into unit - Moved in 1995 to 1998 (%) - Hispanic or Latino
Year householder moved into unit - Moved in 1995 to 1998 (%) - American Indian and Alaska Native
Year householder moved into unit - Moved in 1995 to 1998 (%) - Multirace
Year householder moved into unit - Moved in 1995 to 1998 (%) - Other Race
Year householder moved into unit - Moved in 1990 to 1994 (%)
Year householder moved into unit - Moved in 1990 to 1994 (%) - White
Year householder moved into unit - Moved in 1990 to 1994 (%) - Black or African American
Year householder moved into unit - Moved in 1990 to 1994 (%) - Asian
Year householder moved into unit - Moved in 1990 to 1994 (%) - Hispanic or Latino
Year householder moved into unit - Moved in 1990 to 1994 (%) - American Indian and Alaska Native
Year householder moved into unit - Moved in 1990 to 1994 (%) - Multirace
Year householder moved into unit - Moved in 1990 to 1994 (%) - Other Race
Year householder moved into unit - Moved in 1980 to 1989 (%)
Year householder moved into unit - Moved in 1980 to 1989 (%) - White
Year householder moved into unit - Moved in 1980 to 1989 (%) - Black or African American
Year householder moved into unit - Moved in 1980 to 1989 (%) - Asian
Year householder moved into unit - Moved in 1980 to 1989 (%) - Hispanic or Latino
Year householder moved into unit - Moved in 1980 to 1989 (%) - American Indian and Alaska Native
Year householder moved into unit - Moved in 1980 to 1989 (%) - Multirace
Year householder moved into unit - Moved in 1980 to 1989 (%) - Other Race
Year householder moved into unit - Moved in 1970 to 1979 (%)
Year householder moved into unit - Moved in 1970 to 1979 (%) - White
Year householder moved into unit - Moved in 1970 to 1979 (%) - Black or African American
Year householder moved into unit - Moved in 1970 to 1979 (%) - Asian
Year householder moved into unit - Moved in 1970 to 1979 (%) - Hispanic or Latino
Year householder moved into unit - Moved in 1970 to 1979 (%) - American Indian and Alaska Native
Year householder moved into unit - Moved in 1970 to 1979 (%) - Multirace
Year householder moved into unit - Moved in 1970 to 1979 (%) - Other Race
Year householder moved into unit - Moved in 1969 or earlier (%)
Year householder moved into unit - Moved in 1969 or earlier (%) - White
Year householder moved into unit - Moved in 1969 or earlier (%) - Black or African American
Year householder moved into unit - Moved in 1969 or earlier (%) - Asian
Year householder moved into unit - Moved in 1969 or earlier (%) - Hispanic or Latino
Year householder moved into unit - Moved in 1969 or earlier (%) - American Indian and Alaska Native
Year householder moved into unit - Moved in 1969 or earlier (%) - Multirace
Year householder moved into unit - Moved in 1969 or earlier (%) - Other Race
Housing units lacking complete plumbing facilities (%)
Housing units lacking complete kitchen facilities (%)
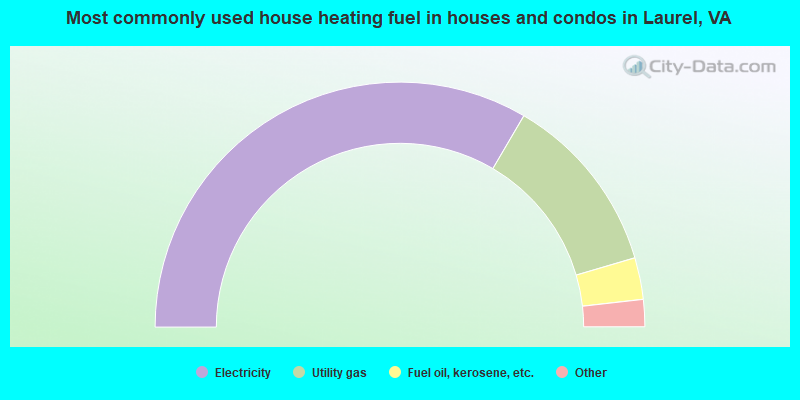
House heating fuel used in houses and condos - Utility gas (%)
House heating fuel used in houses and condos - Bottled, tank, or LP gas (%)
House heating fuel used in houses and condos - Electricity (%)
House heating fuel used in houses and condos - Fuel oil, kerosene, etc. (%)
House heating fuel used in houses and condos - Coal or coke (%)
House heating fuel used in houses and condos - Wood (%)
House heating fuel used in houses and condos - Solar energy (%)
House heating fuel used in houses and condos - Other fuel (%)
House heating fuel used in houses and condos - No fuel used (%)
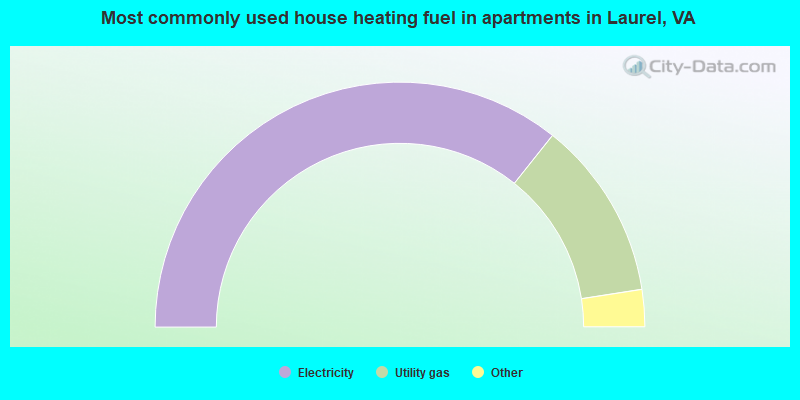
House heating fuel used in apartments - Utility gas (%)
House heating fuel used in apartments - Bottled, tank, or LP gas (%)
House heating fuel used in apartments - Electricity (%)
House heating fuel used in apartments - Fuel oil, kerosene, etc. (%)
House heating fuel used in apartments - Coal or coke (%)
House heating fuel used in apartments - Wood (%)
House heating fuel used in apartments - Solar energy (%)
House heating fuel used in apartments - Other fuel (%)
House heating fuel used in apartments - No fuel used (%)
Latest news about housing in Laurel, VA collected exclusively by city-data.com from local newspapers, TV, and radio stations
Median year house/condo built: 1981Median year apartment built: 1983Household type by relationship:
Households: 18,526
Male householders: 3,343 (1,040 living alone ), Female householders: 3,832 (1,467 living alone )2,541 spouses (2,473 opposite-sex spouses ), 364 unmarried partners , (356 opposite-sex unmarried partners ), 4,693 children (4,551 natural , 76 adopted , 66 stepchildren ), 329 grandchildren , 358 brothers or sisters , 406 parents , 0 foster children , 617 other relatives , 1,112 non-relatives In group quarters: 925
Size of family households: 1,838 2-persons , 1,064 3-persons , 650 4-persons , 289 5-persons , 172 6-persons , 74 7-or-more-persons .
Size of nonfamily households: 2,587 1-person , 487 2-persons , 73 3-persons , 103 4-persons .
2,039 married couples with children. single-parent households (124 men , 694 women ).
78.0% of residents of Laurel speak English at home. of residents speak Spanish at home (54% speak English very well , 17% speak English well , 20% speak English not well , 9% don't speak English at all ).of residents speak other Indo-European language at home (54% speak English very well , 26% speak English well , 17% speak English not well , 3% don't speak English at all ).of residents speak Asian or Pacific Island language at home (51% speak English very well , 21% speak English well , 26% speak English not well , 2% don't speak English at all ).of residents speak other language at home (48% speak English very well , 24% speak English well , 18% speak English not well , 10% don't speak English at all ).
Foreign born population: 3,365 (18.2%)of them are naturalized citizens )
Median number of rooms in houses and condos:
Median number of rooms in apartments
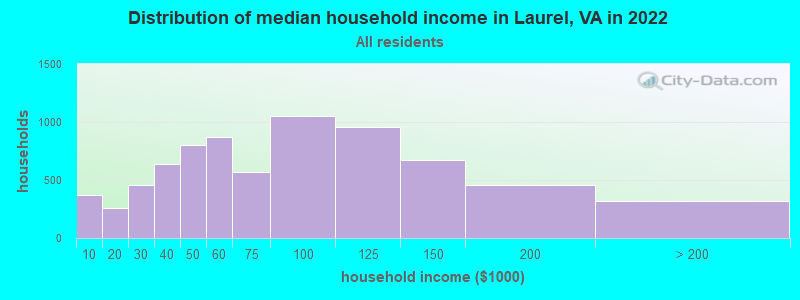
Laurel, VA household income distribution 372 Less than $10,000258 $10,000 to $19,999456 $20,000 to $29,999635 $30,000 to $39,999799 $40,000 to $49,999874 $50,000 to $59,999570 $60,000 to $74,9991,054 $75,000 to $99,999959 $100,000 to $124,999675 $125,000 to $149,999456 $150,000 to $199,999320 $200,000 or more
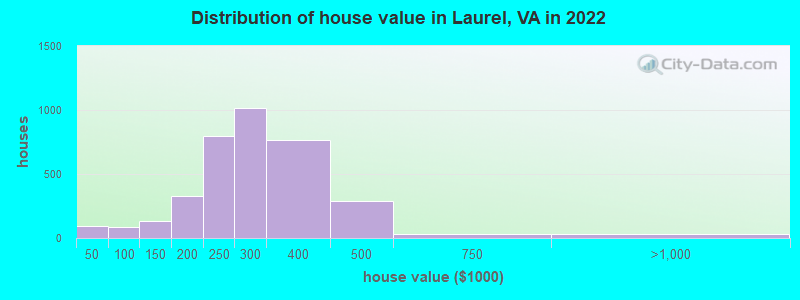
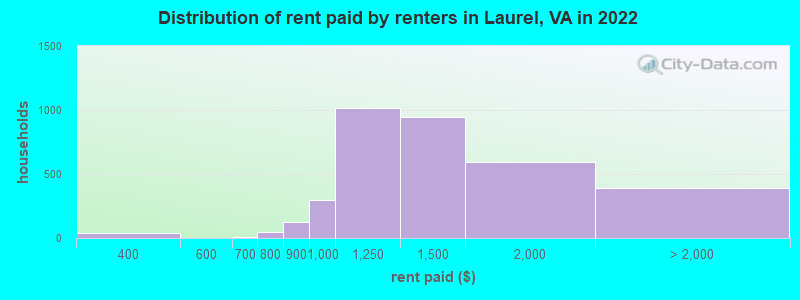
Home value of owner - occupied houses in 2022 in Laurel, VA 18 Less than $10,0008 $25,000 to $29,9996 $30,000 to $34,99956 $40,000 to $49,99915 $80,000 to $89,99910 $90,000 to $99,9998 $100,000 to $124,999123 $125,000 to $149,999216 $150,000 to $174,999108 $175,000 to $199,999793 $200,000 to $249,9991,015 $250,000 to $299,999762 $300,000 to $399,999285 $400,000 to $499,99935 $500,000 to $749,99920 $750,000 to $999,99911 $1,000,000 to $1,499,999Rent paid by renters in 2022 in Laurel, VA 16 $300 to $34920 $350 to $39911 $650 to $69922 $700 to $74923 $750 to $799123 $800 to $899293 $900 to $9991,012 $1,000 to $1,249948 $1,250 to $1,499594 $1,500 to $1,999166 $2,000 to $2,49916 $3,500 or more203 No cash rent
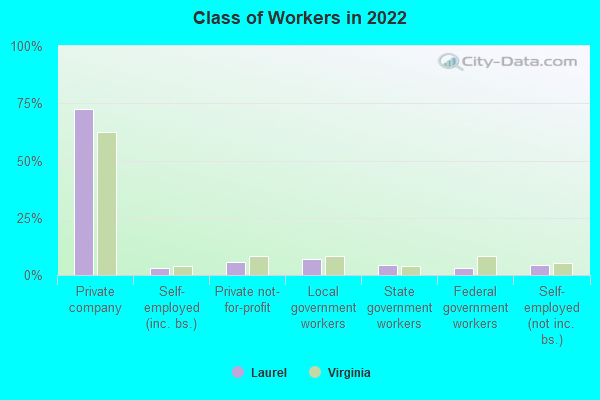
Percentage of workers working in this county: 62.9%Number of people working at home: 1,253 (11.7% of all workers )
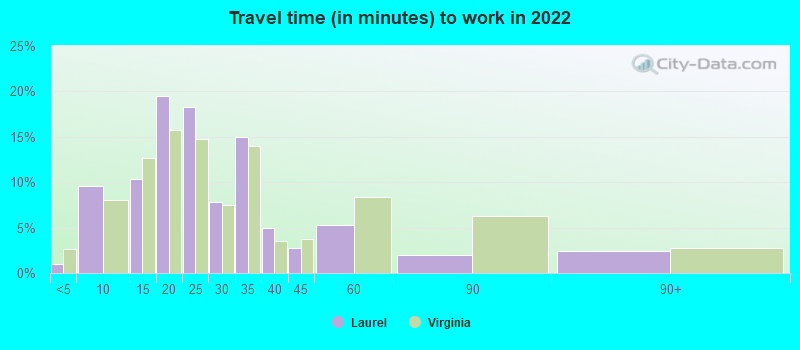
Travel time to work (commute)
Less than 5 minutes: 2615 to 9 minutes: 75910 to 14 minutes: 1,13115 to 19 minutes: 2,32720 to 24 minutes: 2,09425 to 29 minutes: 71130 to 34 minutes: 1,07235 to 39 minutes: 33240 to 44 minutes: 4645 to 59 minutes: 13160 to 89 minutes: 24590 or more minutes: 69
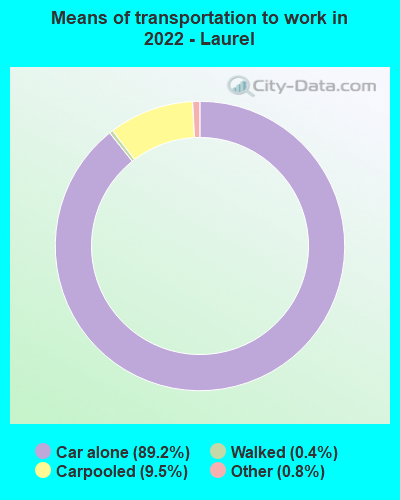
Means of transportation to work:
Drove a car alone: 8,054 (75.7%)Carpooled: 933 (8.8%)Taxi: 136 (1.3%)Bicycle: 7 (0.1%)Walked: 51 (0.5%)Worked at home: 1,253 (11.8%)
Unemployment by race in 2022
Unemployment rate for White non-Hispanic residents 4.5% Males2.5% FemalesUnemployment rate for Black residents 4.7% MalesUnemployment rate for Asian residents 10.9% MalesUnemployment rate for other race residents 16.2% FemalesUnemployment rate for two or more race residents 2.1% Males8.0% FemalesUnemployment rate for Hispanic or Latino residents 0.1% Males7.8% Females
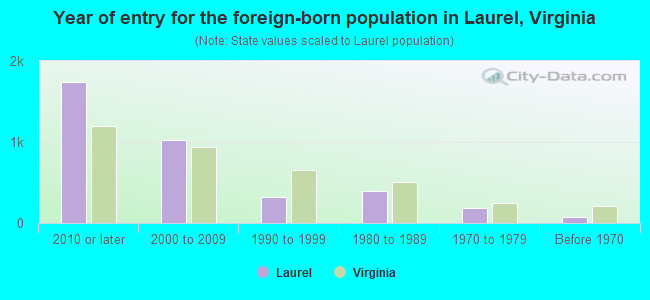
Year of entry for the foreign-born population in Laurel, Virginia
1,745 2010 or later 1,025 2000 to 2009 325 1990 to 1999 392 1980 to 1989 181 1970 to 1979 78 Before 1970
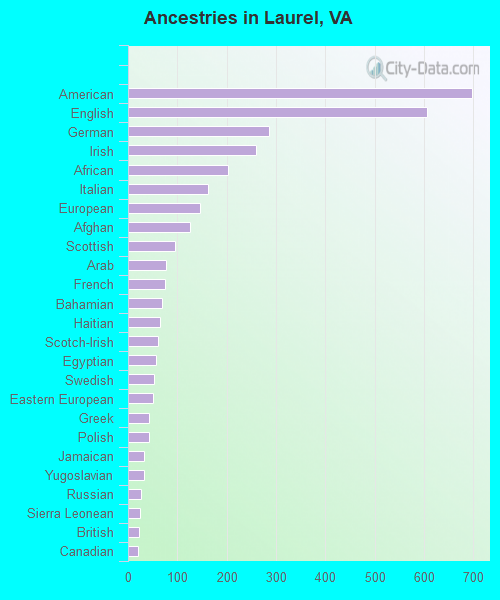
First ancestries reported:
American: 697 (7.1%)
English: 606 (6.2%)
German: 285 (2.9%)
Irish: 259 (2.6%)
African: 202 (2.1%)
Italian: 162 (1.6%)
European: 146 (1.5%)
Afghan: 125 (1.3%)
Scottish: 96 (1.0%)
Arab: 77 (0.8%)
French: 74 (0.8%)
Bahamian: 68 (0.7%)
Haitian: 65 (0.7%)
Scotch-Irish: 60 (0.6%)
Egyptian: 57 (0.6%)
Swedish: 53 (0.5%)
Eastern European: 50 (0.5%)
Greek: 42 (0.4%)
Polish: 42 (0.4%)
Jamaican: 33 (0.3%)
Yugoslavian: 33 (0.3%)
Russian: 26 (0.3%)
Sierra Leonean: 24 (0.2%)
British: 23 (0.2%)
Canadian: 21 (0.2%)
Ethiopian: 20 (0.2%)
French Canadian: 18 (0.2%)
Bulgarian: 18 (0.2%)
Nigerian: 17 (0.2%)
Iraqi: 14 (0.1%)
Danish: 14 (0.1%)
Kenyan: 14 (0.1%)
Lebanese: 11 (0.1%)
Dutch: 9 (0.09%)
Palestinian: 8 (0.08%)
Brazilian: 6 (0.06%)
Northern European: 2 (0.02%)
Swiss: 2 (0.02%) Most common places of birth for foreign-born residents (%): India Laurel:
11.3% (395)Virginia:
9.0% (97,830)
Nepal Laurel:
9.1% (319)Virginia:
0.9% (9,695)
Mexico Laurel:
8.3% (291)Virginia:
5.3% (57,498)
Vietnam Laurel:
8.2% (285)Virginia:
4.2% (45,750)
Venezuela Laurel:
8.0% (278)Virginia:
0.8% (8,186)
Sudan Laurel:
6.9% (242)Virginia:
0.4% (4,442)
Afghanistan Laurel:
5.5% (194)Virginia:
1.8% (19,426)
Cuba Laurel:
4.5% (158)Virginia:
0.5% (5,899)
Bhutan Laurel:
4.5% (156)Virginia:
0.1% (775)
Guatemala Laurel:
4.1% (142)Virginia:
3.3% (35,938)
England Laurel:
3.7% (129)Virginia:
0.9% (9,842)
Iraq Laurel:
3.6% (125)Virginia:
0.9% (9,351)
El Salvador Laurel:
3.3% (114)Virginia:
9.9% (107,534)
Egypt Laurel:
2.7% (94)Virginia:
0.9% (9,672)
Dominican Republic Laurel:
2.3% (81)Virginia:
0.6% (6,698)
Ghana Laurel:
1.6% (57)Virginia:
1.6% (17,346)
Cambodia Laurel:
1.5% (53)Virginia:
0.4% (4,747)
Place of birth for U.S.-born residents:
This state: 10,052Other state: 4,779Northeast: 1,766Midwest: 610South: 2,013West: 374 80.6% of Laurel residents lived in the same house 1 years ago.
Out of people who lived in different houses, 30.8% lived in this county.
Out of people who lived in different counties, 65.4% lived in Virginia.
Laurel:
80.6%State average:
86.6%
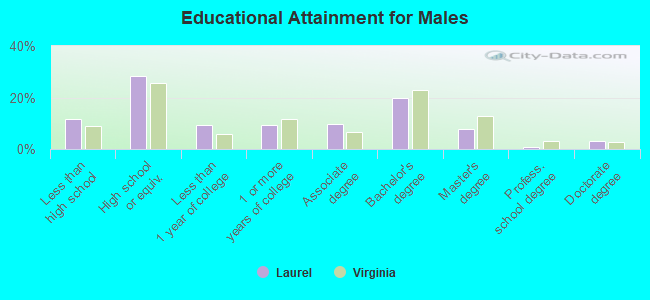
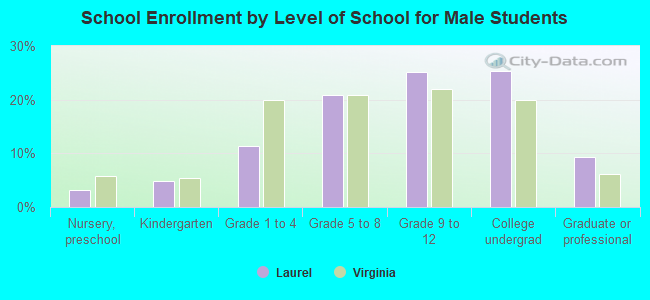
Education attainment for males 25 years and older:
No schooling: 255Nursery to 4th grade: 295th and 6th grade: 647th and 8th grade: 39th grade: 2910th grade: 4811th grade: 4812th grade, no diploma: 301High school graduate (or equivalency): 1,875Less than 1 year of college: 600Some college more than 1 year, no degree: 603Associate degree: 640Bachelor's degree: 1,298Master's degree: 522Professional school degree: 48Doctorate degree: 211
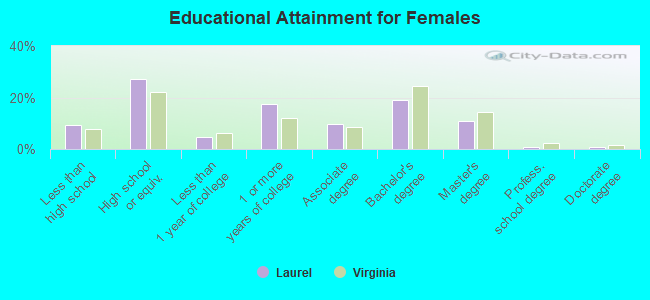
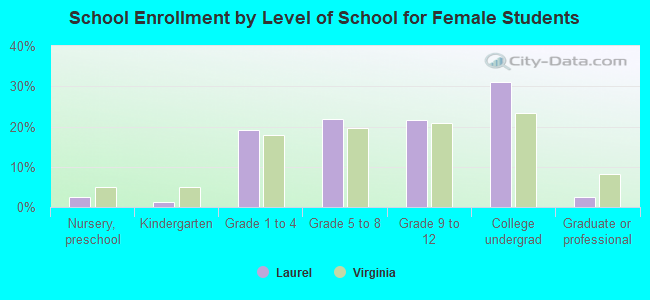
Education attainment for females 25 years and older:
No schooling: 140Nursery to 4th grade: 65th and 6th grade: 67th and 8th grade: 569th grade: 8510th grade: 11711th grade: 5512th grade, no diploma: 144High school graduate (or equivalency): 1,818Less than 1 year of college: 315Some college more than 1 year, no degree: 1,154Associate degree: 659Bachelor's degree: 1,277Master's degree: 730Professional school degree: 44Doctorate degree: 65
Housing units in structures:
One, detached: 4,201One, attached: 1,053Two: 133 or 4: 7175 to 9: 60510 to 19: 91420 to 49: 6850 or more: 223Mobile homes: 74Housing units lacking complete plumbing facilities in 2022: 0.1%Housing units lacking complete kitchen facilities in 2022: 2.1%House/condo owner moved in on average 10 years ago
Renter moved in on average 1 years ago
Private vs. public school enrollment:
Students in private schools in grades 1 to 8 (elementary and middle school): 194 Students in private schools in grades 9 to 12 (high school): 84 Students in private undergraduate colleges: 128