Housing density: 628 houses/condos per square mile
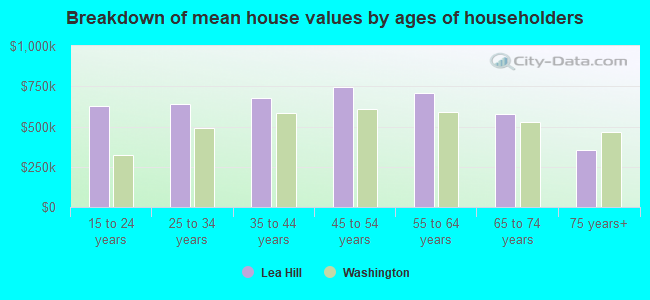
Median price asked for vacant for-sale houses and condos in 2022 in this county: $843,880.
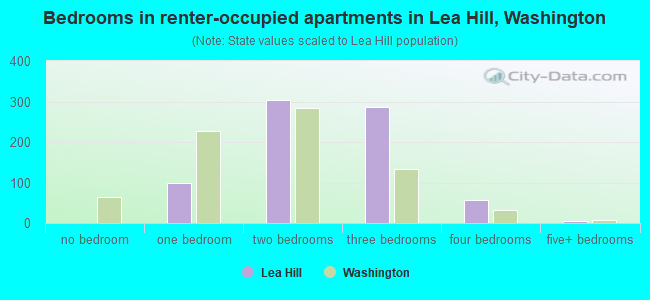
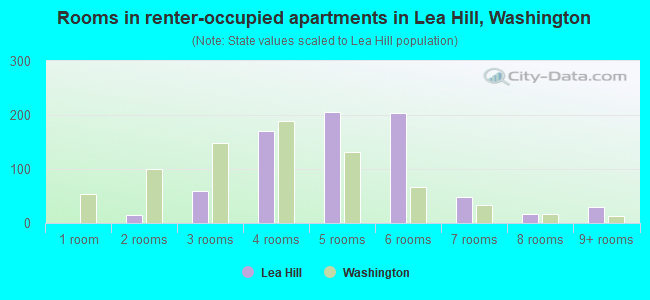
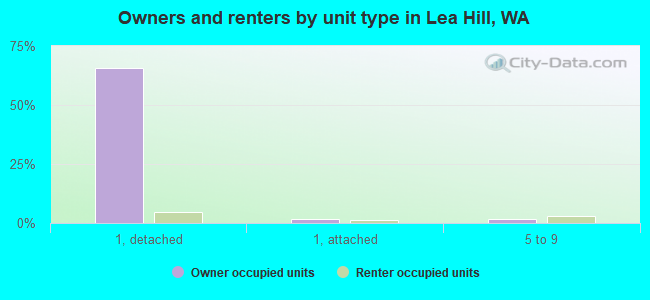
Median contract rent in 2022: $1,898 (lower quartile is $1,470, upper quartile is over $2,000)
Median rent asked for vacant for-rent units in 2022: $1,659
Median gross rent in Lea Hill, WA in 2022: over $2,000
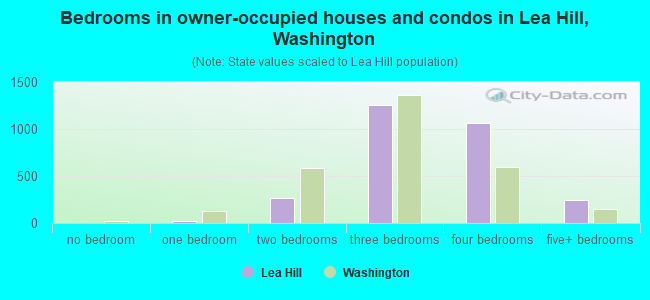
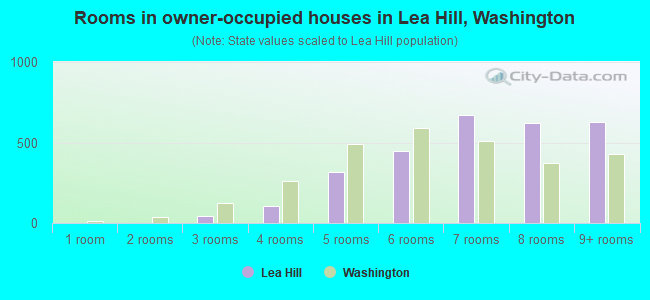
Housing units in Lea Hill with a mortgage: 2,091 (166 second mortgage, 293 home equity loan, 0 both second mortgage and home equity loan) Houses without a mortgage: 226
In family households: 1,455,162 (324,509 male householders, 137,001 female householders)
357,491 spouses, 491,900 children (462,739 natural, 12,743 adopted, 16,418 stepchildren), 22,208 grandchildren, 21,116 brothers or sisters, 17,956 parents, foster children, 25,527 other relatives, 45,636 non-relatives
In nonfamily households: 438,956 (162,683 male householders (115,616 living alone)), 165,039 female householders (129,083 living alone)), 111,234 nonrelatives
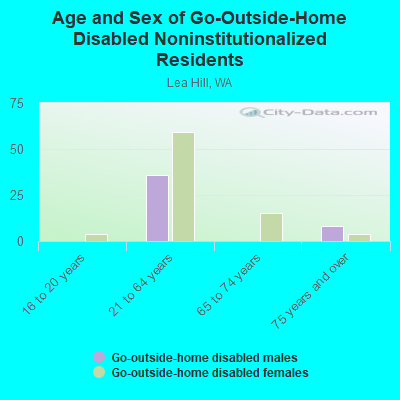
In group quarters: 37,131 (10,490 institutionalized population)
277,933 married couples with children.
81,653 single-parent households (19,170 men, 62,483 women).
90.2% of residents of Lea Hill speak English at home.
2.8% of residents speak Spanish at home (83% speak English very well, 5% speak English well, 6% speak English not well, 6% don't speak English at all).
2.9% of residents speak other Indo-European language at home (64% speak English very well, 31% speak English well, 4% speak English not well).
3.6% of residents speak Asian or Pacific Island language at home (47% speak English very well, 37% speak English well, 17% speak English not well).
0.4% of residents speak other language at home (100% speak English very well).
Foreign born population: 2,186 (15.7%)
(44.0% of them are naturalized citizens)
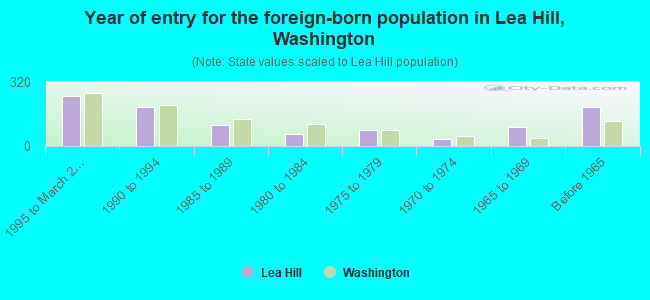
Year of entry for the foreign-born population in Lea Hill, Washington
2511995 to March 2000
1971990 to 1994
1031985 to 1989
581980 to 1984
791975 to 1979
341970 to 1974
941965 to 1969
195Before 1965
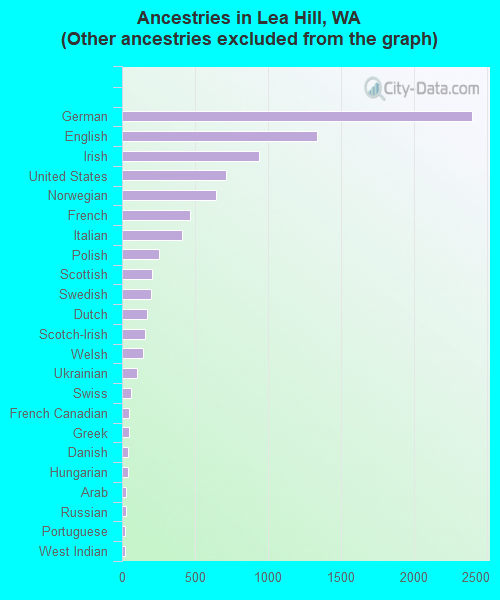
First ancestries reported:
Other: 2,637 (23.6%)
German: 2,396 (21.5%)
English: 1,340 (12.0%)
Irish: 937 (8.4%)
United States: 711 (6.4%)
Norwegian: 646 (5.8%)
French: 466 (4.2%)
Italian: 408 (3.7%)
Polish: 255 (2.3%)
Scottish: 209 (1.9%)
Swedish: 198 (1.8%)
Dutch: 170 (1.5%)
Scotch-Irish: 161 (1.4%)
Welsh: 141 (1.3%)
Ukrainian: 100 (0.9%)
Swiss: 61 (0.5%)
French Canadian: 46 (0.4%)
Greek: 45 (0.4%)
Danish: 41 (0.4%)
Hungarian: 38 (0.3%)
Arab: 30 (0.3%)
Russian: 26 (0.2%)
Portuguese: 22 (0.2%)
West Indian: 22 (0.2%)
Slovak: 15 (0.1%)
Lithuanian: 12 (0.1%)
Subsaharan African: 11 (0.10%)
Czech: 8 (0.07%)
Most common places of birth for foreign-born residents (%):
Canada
Lea Hill:
12.1% (122)
Washington:
7.7% (47,568)
Mexico
Lea Hill:
10.8% (109)
Washington:
24.1% (148,115)
Philippines
Lea Hill:
10.1% (102)
Washington:
7.6% (46,733)
Taiwan
Lea Hill:
7.2% (73)
Washington:
1.4% (8,353)
Korea
Lea Hill:
7.2% (73)
Washington:
6.2% (38,172)
Ukraine
Lea Hill:
6.7% (68)
Washington:
3.0% (18,572)
United Kingdom
Lea Hill:
6.3% (64)
Washington:
3.3% (20,321)
Cambodia
Lea Hill:
6.0% (61)
Washington:
1.7% (10,656)
Germany
Lea Hill:
4.5% (46)
Washington:
3.4% (21,167)
Hong Kong
Lea Hill:
3.9% (39)
Washington:
1.0% (6,263)
Italy
Lea Hill:
2.9% (29)
Washington:
0.4% (2,307)
Poland
Lea Hill:
2.6% (26)
Washington:
0.7% (4,092)
Romania
Lea Hill:
2.5% (25)
Washington:
0.7% (4,345)
Other Eastern Europe
Lea Hill:
2.4% (24)
Washington:
1.2% (7,645)
Japan
Lea Hill:
2.3% (23)
Washington:
2.8% (16,936)
Thailand
Lea Hill:
2.0% (20)
Washington:
1.0% (6,294)
Cuba
Lea Hill:
2.0% (20)
Washington:
0.2% (1,259)
India
Lea Hill:
1.9% (19)
Washington:
2.4% (14,714)
Vietnam
Lea Hill:
1.8% (18)
Washington:
6.7% (40,879)
Iraq
Lea Hill:
1.6% (16)
Washington:
0.2% (1,014)
Place of birth for U.S.-born residents:
This state: 5,621
Other state: 4,010
Northeast: 266
Midwest: 1,078
South: 644
West: 2,022
50% of Lea Hill residents lived in the same house 5 years ago. Out of people who lived in different houses, 71% lived in this county. Out of people who lived in different counties, 42% lived in Washington.
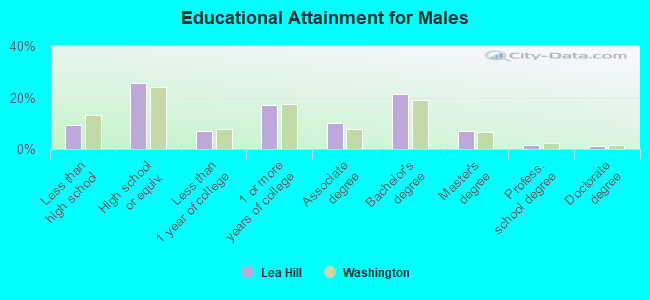
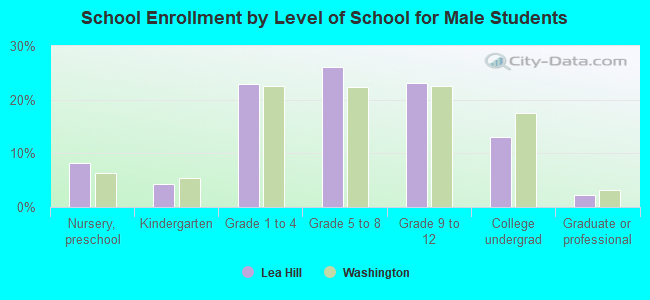
Education attainment for males 25 years and older:
No schooling: 8
Nursery to 4th grade: 10
5th and 6th grade: 20
7th and 8th grade: 9
9th grade: 0
10th grade: 93
11th grade: 37
12th grade, no diploma: 114
High school graduate (or equivalency): 798
Less than 1 year of college: 215
Some college more than 1 year, no degree: 531
Associate degree: 320
Bachelor's degree: 666
Master's degree: 214
Professional school degree: 54
Doctorate degree: 37
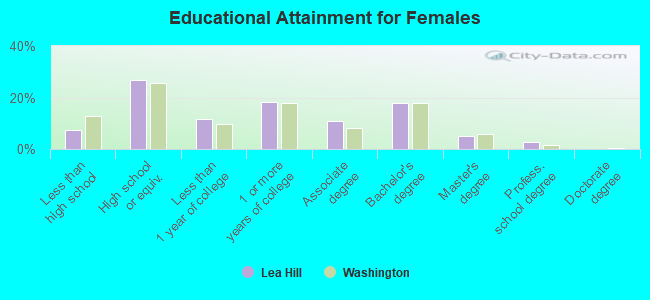
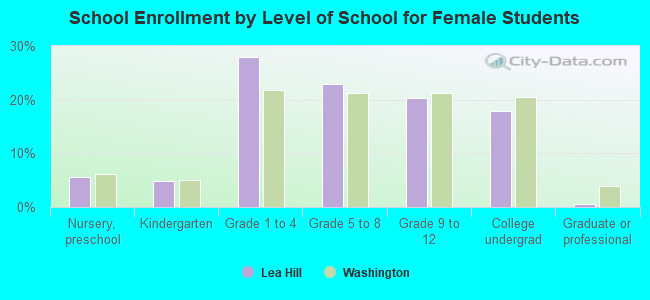
Education attainment for females 25 years and older: