Housing density: 408 houses/condos per square mile
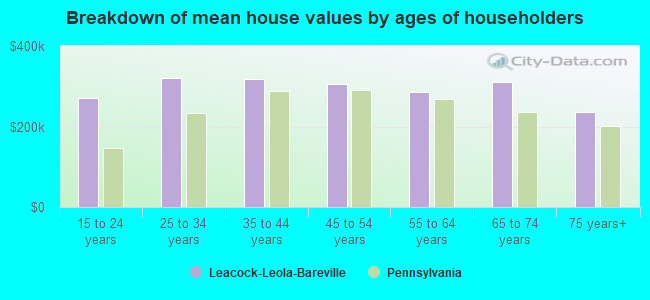
Median price asked for vacant for-sale houses and condos in 2022 in this county: $323,895.
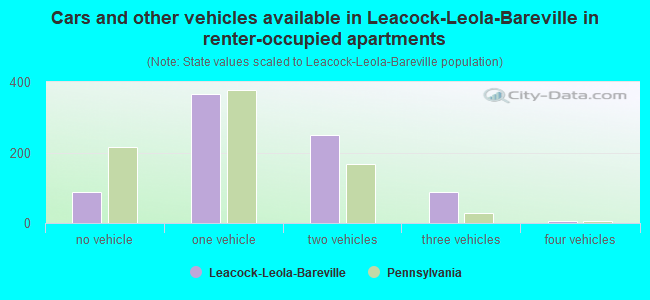
Median contract rent in 2022: $1,087 (lower quartile is $836, upper quartile is $1,347)
Median rent asked for vacant for-rent units in 2022: $896
Median gross rent in Leacock-Leola-Bareville, PA in 2022: $1,292
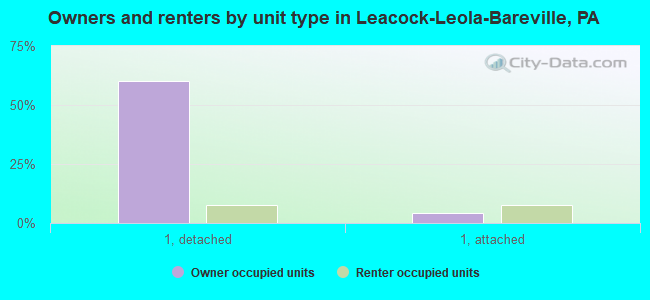
Housing units in Leacock-Leola-Bareville with a mortgage: 951 (124 second mortgage, 121 home equity loan, 0 both second mortgage and home equity loan) Houses without a mortgage: 465
Compare current foreclosures near Leacock-Leola-Bareville, PA:
In family households: 433,818 (104,765 male householders, 30,636 female householders)
109,118 spouses, 157,823 children (147,471 natural, 3,956 adopted, 6,396 stepchildren), 7,891 grandchildren, 3,278 brothers or sisters, 3,673 parents, foster children, 3,750 other relatives, 10,275 non-relatives
In nonfamily households: 72,989 (26,241 male householders (19,726 living alone)), 31,960 female householders (27,067 living alone)), 14,788 nonrelatives
In group quarters: 12,638 (5,497 institutionalized population)
95,885 married couples with children.
21,246 single-parent households (5,312 men, 15,934 women).
80.0% of residents of Leacock-Leola-Bareville speak English at home.
4.2% of residents speak Spanish at home (62% speak English very well, 18% speak English well, 17% speak English not well, 4% don't speak English at all).
10.2% of residents speak other Indo-European language at home (52% speak English very well, 43% speak English well, 5% speak English not well).
5.7% of residents speak Asian or Pacific Island language at home (40% speak English very well, 26% speak English well, 26% speak English not well, 7% don't speak English at all).
Foreign born population: 846 (11.1%)
(53.2% of them are naturalized citizens)
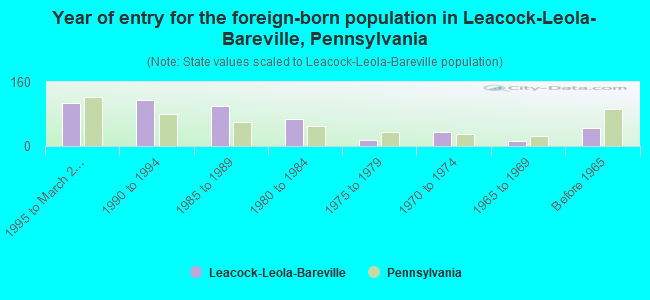
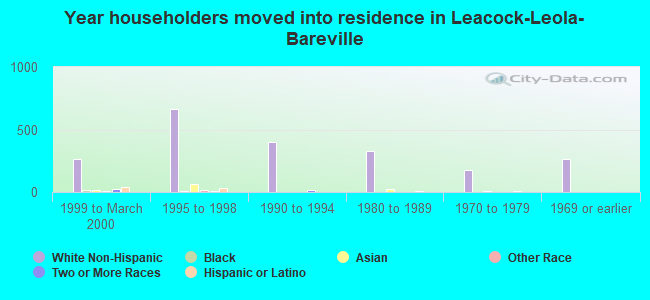
Year of entry for the foreign-born population in Leacock-Leola-Bareville, Pennsylvania
1081995 to March 2000
1151990 to 1994
991985 to 1989
671980 to 1984
141975 to 1979
341970 to 1974
121965 to 1969
45Before 1965
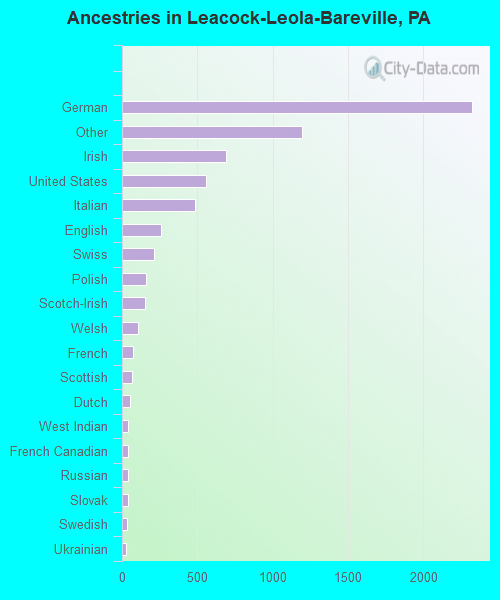
First ancestries reported:
German: 2,320 (34.9%)
Other: 1,192 (18.0%)
Irish: 693 (10.4%)
United States: 557 (8.4%)
Italian: 483 (7.3%)
English: 258 (3.9%)
Swiss: 215 (3.2%)
Polish: 161 (2.4%)
Scotch-Irish: 152 (2.3%)
Welsh: 105 (1.6%)
French: 71 (1.1%)
Scottish: 65 (1.0%)
Dutch: 50 (0.8%)
West Indian: 40 (0.6%)
French Canadian: 39 (0.6%)
Russian: 38 (0.6%)
Slovak: 37 (0.6%)
Swedish: 34 (0.5%)
Ukrainian: 25 (0.4%)
Danish: 19 (0.3%)
Lithuanian: 19 (0.3%)
Norwegian: 19 (0.3%)
Hungarian: 16 (0.2%)
Subsaharan African: 10 (0.2%)
Greek: 9 (0.1%)
Czech: 7 (0.1%)
Arab: 6 (0.09%)
Most common places of birth for foreign-born residents (%):
Vietnam
Leacock-Leola-Bareville:
23.7% (117)
Pennsylvania:
5.2% (26,656)
Colombia
Leacock-Leola-Bareville:
8.7% (43)
Pennsylvania:
1.3% (6,531)
Laos
Leacock-Leola-Bareville:
8.5% (42)
Pennsylvania:
0.5% (2,414)
Mexico
Leacock-Leola-Bareville:
7.1% (35)
Pennsylvania:
4.8% (24,232)
China, excluding Hong Kong and Taiwan
Leacock-Leola-Bareville:
6.9% (34)
Pennsylvania:
4.6% (23,478)
Cambodia
Leacock-Leola-Bareville:
5.9% (29)
Pennsylvania:
1.3% (6,656)
Iran
Leacock-Leola-Bareville:
4.5% (22)
Pennsylvania:
0.6% (3,034)
Canada
Leacock-Leola-Bareville:
3.4% (17)
Pennsylvania:
3.0% (15,200)
Romania
Leacock-Leola-Bareville:
2.8% (14)
Pennsylvania:
0.8% (4,274)
India
Leacock-Leola-Bareville:
2.8% (14)
Pennsylvania:
7.4% (37,541)
Germany
Leacock-Leola-Bareville:
2.4% (12)
Pennsylvania:
5.1% (25,685)
Italy
Leacock-Leola-Bareville:
2.4% (12)
Pennsylvania:
6.0% (30,559)
Thailand
Leacock-Leola-Bareville:
2.2% (11)
Pennsylvania:
0.6% (2,828)
Ethiopia
Leacock-Leola-Bareville:
2.0% (10)
Pennsylvania:
0.2% (1,257)
Other Northern Europe
Leacock-Leola-Bareville:
1.8% (9)
Pennsylvania:
0.4% (1,824)
Haiti
Leacock-Leola-Bareville:
1.8% (9)
Pennsylvania:
1.0% (4,977)
Trinidad and Tobago
Leacock-Leola-Bareville:
1.8% (9)
Pennsylvania:
0.9% (4,480)
Place of birth for U.S.-born residents:
This state: 4,767
Other state: 1,099
Northeast: 548
Midwest: 169
South: 327
West: 55
58% of Leacock-Leola-Bareville residents lived in the same house 5 years ago. Out of people who lived in different houses, 74% lived in this county. Out of people who lived in different counties, 48% lived in Pennsylvania.
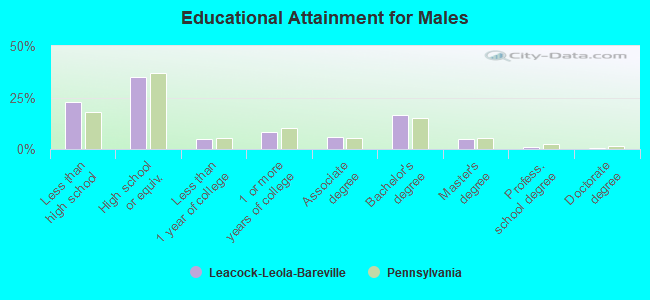
Education attainment for males 25 years and older:
No schooling: 14
Nursery to 4th grade: 4
5th and 6th grade: 14
7th and 8th grade: 169
9th grade: 94
10th grade: 36
11th grade: 70
12th grade, no diploma: 60
High school graduate (or equivalency): 708
Less than 1 year of college: 100
Some college more than 1 year, no degree: 170
Associate degree: 123
Bachelor's degree: 336
Master's degree: 103
Professional school degree: 18
Doctorate degree: 11
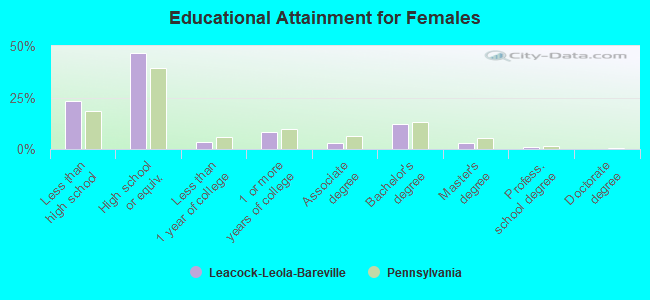
Education attainment for females 25 years and older: