Lombard, IL (Illinois) Houses and Residents
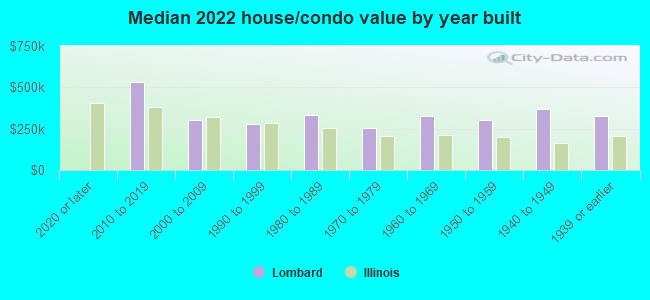
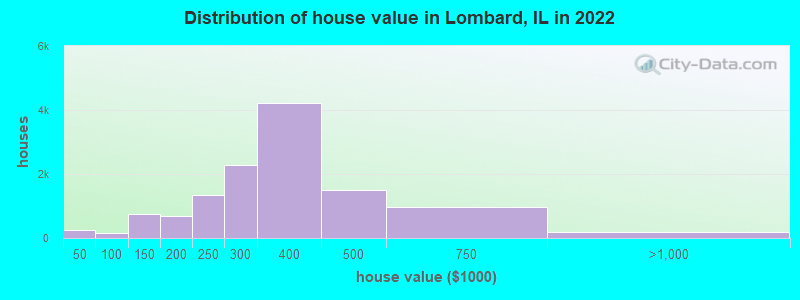
Estimated median house or condo value in 2022: $311,633 (it was $163,000 in 2000 )
Lombard:
$311,633Illinois:
$251,600
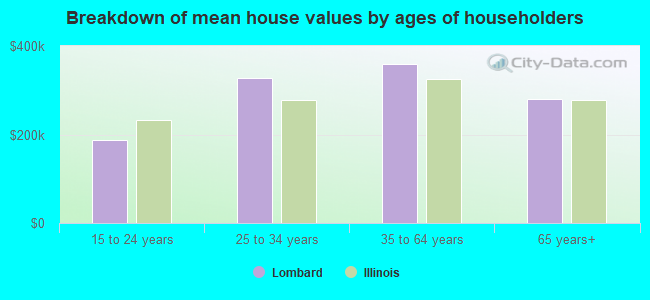
Lower value quartile - upper value quartile: $245,252 - $391,074Mean price in 2022: Detached houses: $360,082 Here:
$360,082State:
$310,164
Townhouses or other attached units: $267,682 Here:
$267,682State:
$286,230
In 2-unit structures: $264,148 Here:
$264,148State:
$299,638
In 3-to-4-unit structures: $354,705 Here:
$354,705State:
$330,907
In 5-or-more-unit structures: $218,257 Here:
$218,257State:
$318,887
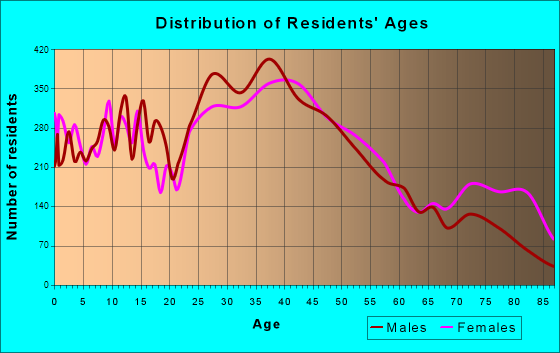
Total population: 43,893 (Urban population: 41,859, Rural population: 0)
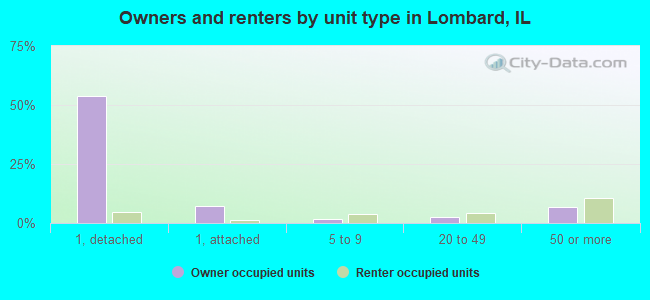
Houses: 18,301 (17,267 occupied: 12,083 owner occupied, 5,202 renter occupied )
% of renters here:
30%State:
33%
Housing density: 1,890 houses/condos per square mile
Median price asked for vacant for-sale houses and condos in 2022: $412,519.
Median contract rent in 2022: $1,600 (lower quartile is $1,212, upper quartile is $1,951)
Median rent asked for vacant for-rent units in 2022: $2,032
Median gross rent in Lombard, IL in 2022: $1,671
Housing units in Lombard with a mortgage: 7,839 (762 second mortgage, 9 home equity loan, 675 both second mortgage and home equity loan )Houses without a mortgage: 203
Median household income for houses/condos with a mortgage: $120,686
Median household income for apartments without a mortgage: $78,527
Median monthly housing costs: $1,651
Data:
Median house or condo value ($)
Median house or condo value ($ change since 2000)
Median house or condo value ($) - White
Median house or condo value ($) - Black or African American
Median house or condo value ($) - Asian
Median house or condo value ($) - Hispanic or Latino
Median house or condo value ($) - American Indian and Alaska Native
Median house or condo value ($) - Multirace
Median house or condo value ($) - Other Race
Median price asked for mobile homes ($)
Household density (households per square mile)
Mean house or condo value by units in structure - 1, detached ($)
Mean house or condo value by units in structure - 1, attached ($)
Mean house or condo value by units in structure - 2 ($)
Mean house or condo value by units in structure by units in structure - 3 or 4 ($)
Mean house or condo value by units in structure - 5 or more ($)
Mean house or condo value by units in structure - Boat, RV, van, etc. ($)
Mean house or condo value by units in structure - Mobile home ($)
Median contract rent ($)
Median contract rent - Lower quartile ($)
Median contract rent - Upper quartile ($)
Median gross rent ($)
Urban houses (%)
Rural houses (%)
Houses occupied (%)
Houses occupied (% change since 2000)
Houses owner occupied (%)
Houses owner occupied (% change since 2000)
Houses renter occupied (%)
Houses renter occupied (% change since 2000)
Vacant housing units - For rent (%)
Vacant housing units - For rent (% change since 2000)
Vacant housing units - For sale only (%)
Vacant housing units - For sale only (% change since 2000)
Vacant housing units - Rented or sold, not occupied (%)
Vacant housing units - Rented or sold, not occupied (% change since 2000)
Vacant housing units - For seasonal, recreational, or occasional use (%)
Vacant housing units - For seasonal, recreational, or occasional use (% change since 2000)
Vacant housing units - For migrant workers (%)
Vacant housing units - For migrant workers (% change since 2000)
Vacant housing units - Other vacant (%)
Vacant housing units - Other vacant (% change since 2000)
Median monthly housing costs ($)
Median household income for houses/condos with a mortgage ($)
Median household income for houses/condos without a mortgage ($)
Median household income ($)
Median household income ($) - White
Median household income ($) - Black or African American
Median household income ($) - Asian
Median household income ($) - Hispanic or Latino
Median household income ($) - American Indian and Alaska Native
Median household income ($) - Multirace
Median household income ($) - Other Race
Mortgage status - with mortgage (%)
Mortgage status - with second mortgage (%)
Mortgage status - with home equity loan (%)
Mortgage status - with both second mortgage and home equity loan (%)
Mortgage status - without a mortgage (%)
Median year house/condo built
Median year apartment built
Household type by relationship - Male householder living alone (%)
Household type by relationship - Male householder not living alone (%)
Household type by relationship - Female householder living alone (%)
Household type by relationship - Female householder not living alone (%)
Household type by relationship - Opposite-Sex spouse (%)
Household type by relationship - Same-Sex spouse (%)
Household type by relationship - Opposite-Sex unmarried partner (%)
Household type by relationship - Same-Sex unmarried partner (%)
Household type by relationship - In group quarters (%)
Size of family households - 2-person household (%)
Size of family households - 3-person household (%)
Size of family households - 4-person household (%)
Size of family households - 5-person household (%)
Size of family households - 6-person household (%)
Size of family households - 7-or-more-person household (%)
Size of nonfamily households - 1-person household (%)
Size of nonfamily households - 2-person household (%)
Size of nonfamily households - 3-person household (%)
Size of nonfamily households - 4-person household (%)
Size of nonfamily households - 5-person household (%)
Size of nonfamily households - 6-person household (%)
Size of nonfamily households - 7-or-moreperson household (%)
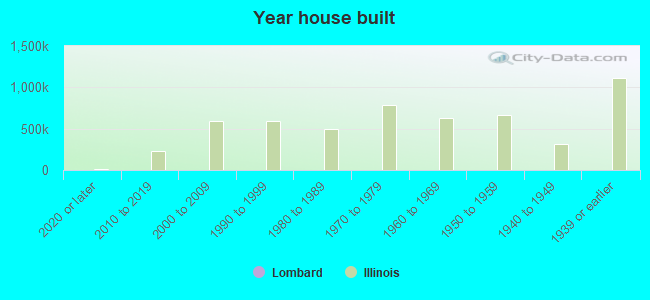
Year house built - Built 2010 or later (%)
Year house built - Built 2000 to 2009 (%)
Year house built - Built 1990 to 1999 (%)
Year house built - Built 1980 to 1989 (%)
Year house built - Built 1970 to 1979 (%)
Year house built - Built 1960 to 1969 (%)
Year house built - Built 1950 to 1959 (%)
Year house built - Built 1940 to 1949 (%)
Year house built - Built 1939 or earlier (%)
Median number of rooms in houses and condos
Median number of rooms in apartments
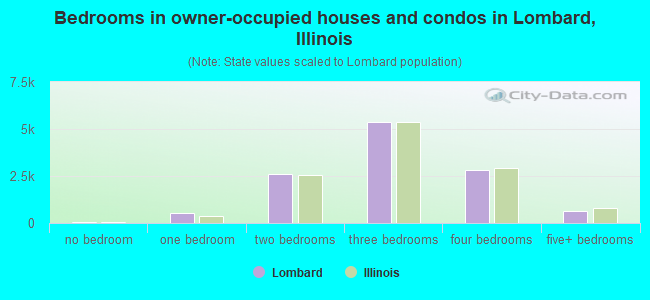
Median number of bedrooms in owner occupied houses
Mean number of bedrooms in owner occupied houses
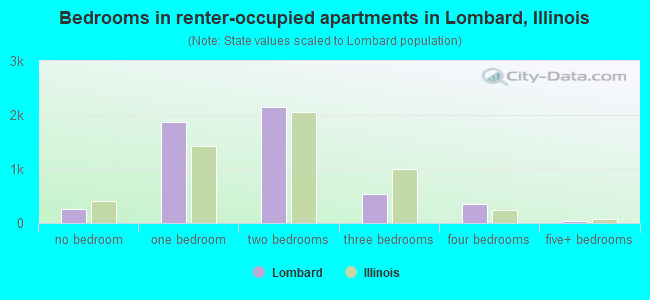
Median number of bedrooms in renter occupied houses
Mean number of bedrooms in renter occupied houses
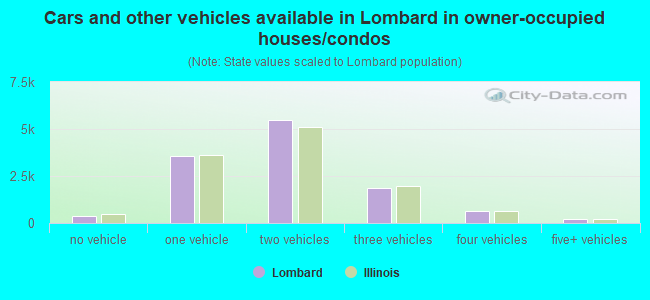
Median number of vehichles in owner occupied houses
Mean number of vehichles in owner occupied houses
Median number of vehichles in renter occupied houses
Mean number of vehichles in renter occupied houses
Rooms in owner-occupied houses - 1 room (%)
Rooms in owner-occupied houses - 2 rooms (%)
Rooms in owner-occupied houses - 3 rooms (%)
Rooms in owner-occupied houses - 4 rooms (%)
Rooms in owner-occupied houses - 5 rooms (%)
Rooms in owner-occupied houses - 6 rooms (%)
Rooms in owner-occupied houses - 7 rooms (%)
Rooms in owner-occupied houses - 8 rooms (%)
Rooms in owner-occupied houses - 9+ rooms (%)
Rooms in renter-occupied houses - 1 room (%)
Rooms in renter-occupied houses - 2 rooms (%)
Rooms in renter-occupied houses - 3 rooms (%)
Rooms in renter-occupied houses - 4 rooms (%)
Rooms in renter-occupied houses - 5 rooms (%)
Rooms in renter-occupied houses - 6 rooms (%)
Rooms in renter-occupied houses - 7 rooms (%)
Rooms in renter-occupied houses - 8 rooms (%)
Rooms in renter-occupied houses - 9+ rooms (%)
Bedrooms in owner-occupied houses - no bedrooms (%)
Bedrooms in owner-occupied houses - 1 bedroom (%)
Bedrooms in owner-occupied houses - 2 bedrooms (%)
Bedrooms in owner-occupied houses - 3 bedrooms (%)
Bedrooms in owner-occupied houses - 4 bedrooms (%)
Bedrooms in owner-occupied houses - 5+ bedrooms (%)
Bedrooms in renter-occupied houses - no bedrooms (%)
Bedrooms in renter-occupied houses - 1 bedroom (%)
Bedrooms in renter-occupied houses - 2 bedrooms (%)
Bedrooms in renter-occupied houses - 3 bedrooms (%)
Bedrooms in renter-occupied houses - 4 bedrooms (%)
Bedrooms in renter-occupied houses - 5+ bedrooms (%)
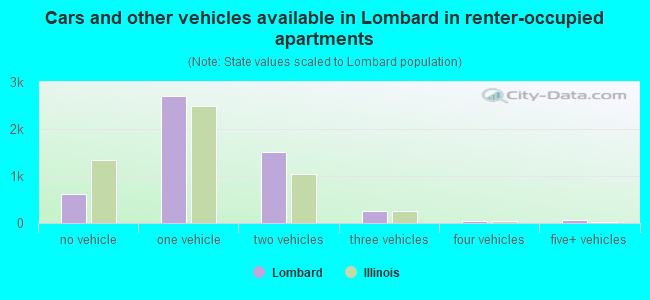
Vehicles available in owner-occupied houses - no vehicle available (%)
Vehicles available in owner-occupied houses - 1 vehicle available(%)
Vehicles available in owner-occupied houses - 2 Vehicles available (%)
Vehicles available in owner-occupied houses - 3 Vehicles available (%)
Vehicles available in owner-occupied houses - 4 Vehicles available (%)
Vehicles available in owner-occupied houses - 5+ Vehicles available (%)
Vehicles available in renter-occupied houses - no vehicle available (%)
Vehicles available in renter-occupied houses - 1 vehicle available (%)
Vehicles available in renter-occupied houses - 2 Vehicles available (%)
Vehicles available in renter-occupied houses - 3 Vehicles available (%)
Vehicles available in renter-occupied houses - 4 Vehicles available (%)
Vehicles available in renter-occupied houses - 5+ Vehicles available (%)
Housing units in structures - 1, detached (%)
Housing units in structures - 1, attached (%)
Housing units in structures - 2 (%)
Housing units in structures - 3 or 4 (%)
Housing units in structures - 5 to 9 (%)
Housing units in structures - 10 to 19 (%)
Housing units in structures - 20 to 49 (%)
Housing units in structures - 50 or more (%)
Housing units in structures - Mobile home (%)
Housing units in structures - Boat, RV, van, etc. (%)
Housing units in structures - Owners - 1, detached (%)
Housing units in structures - Owners - 1, attached (%)
Housing units in structures - Owners - 2 (%)
Housing units in structures - Owners - 3 or 4 (%)
Housing units in structures - Owners - 5 to 9 (%)
Housing units in structures - Owners - 10 to 19 (%)
Housing units in structures - Owners - 20 to 49 (%)
Housing units in structures - Owners - 50 or more (%)
Housing units in structures - Owners - Mobile home (%)
Housing units in structures - Owners - Boat, RV, van, etc. (%)
Housing units in structures - Renters - 1, detached (%)
Housing units in structures - Renters - 1, attached (%)
Housing units in structures - Renters - 2 (%)
Housing units in structures - Renters - 3 or 4 (%)
Housing units in structures - Renters - 5 to 9 (%)
Housing units in structures - Renters - 10 to 19 (%)
Housing units in structures - Renters - 20 to 49 (%)
Housing units in structures - Renters - 50 or more (%)
Housing units in structures - Renters - Mobile home (%)
Housing units in structures - Renters - Boat, RV, van, etc. (%)
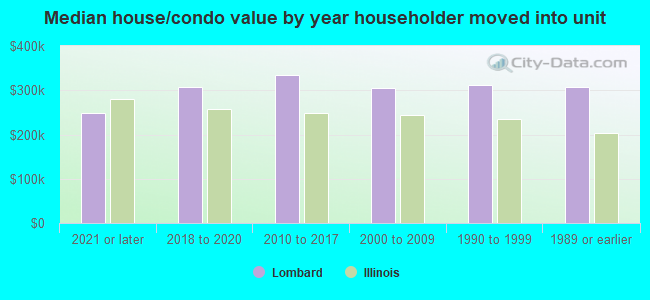
House/condo owner moved in on average (years ago)
Renter moved in on average (years ago)
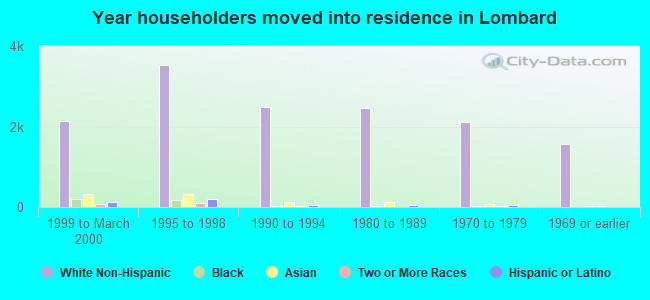
Year householder moved into unit - Moved in 1999 to March 2000 (%)
Year householder moved into unit - Moved in 1999 to March 2000 (%) - White
Year householder moved into unit - Moved in 1999 to March 2000 (%) - Black or African American
Year householder moved into unit - Moved in 1999 to March 2000 (%) - Asian
Year householder moved into unit - Moved in 1999 to March 2000 (%) - Hispanic or Latino
Year householder moved into unit - Moved in 1999 to March 2000 (%) - American Indian and Alaska Native
Year householder moved into unit - Moved in 1999 to March 2000 (%) - Multirace
Year householder moved into unit - Moved in 1999 to March 2000 (%) - Other Race
Year householder moved into unit - Moved in 1995 to 1998 (%)
Year householder moved into unit - Moved in 1995 to 1998 (%) - White
Year householder moved into unit - Moved in 1995 to 1998 (%) - Black or African American
Year householder moved into unit - Moved in 1995 to 1998 (%) - Asian
Year householder moved into unit - Moved in 1995 to 1998 (%) - Hispanic or Latino
Year householder moved into unit - Moved in 1995 to 1998 (%) - American Indian and Alaska Native
Year householder moved into unit - Moved in 1995 to 1998 (%) - Multirace
Year householder moved into unit - Moved in 1995 to 1998 (%) - Other Race
Year householder moved into unit - Moved in 1990 to 1994 (%)
Year householder moved into unit - Moved in 1990 to 1994 (%) - White
Year householder moved into unit - Moved in 1990 to 1994 (%) - Black or African American
Year householder moved into unit - Moved in 1990 to 1994 (%) - Asian
Year householder moved into unit - Moved in 1990 to 1994 (%) - Hispanic or Latino
Year householder moved into unit - Moved in 1990 to 1994 (%) - American Indian and Alaska Native
Year householder moved into unit - Moved in 1990 to 1994 (%) - Multirace
Year householder moved into unit - Moved in 1990 to 1994 (%) - Other Race
Year householder moved into unit - Moved in 1980 to 1989 (%)
Year householder moved into unit - Moved in 1980 to 1989 (%) - White
Year householder moved into unit - Moved in 1980 to 1989 (%) - Black or African American
Year householder moved into unit - Moved in 1980 to 1989 (%) - Asian
Year householder moved into unit - Moved in 1980 to 1989 (%) - Hispanic or Latino
Year householder moved into unit - Moved in 1980 to 1989 (%) - American Indian and Alaska Native
Year householder moved into unit - Moved in 1980 to 1989 (%) - Multirace
Year householder moved into unit - Moved in 1980 to 1989 (%) - Other Race
Year householder moved into unit - Moved in 1970 to 1979 (%)
Year householder moved into unit - Moved in 1970 to 1979 (%) - White
Year householder moved into unit - Moved in 1970 to 1979 (%) - Black or African American
Year householder moved into unit - Moved in 1970 to 1979 (%) - Asian
Year householder moved into unit - Moved in 1970 to 1979 (%) - Hispanic or Latino
Year householder moved into unit - Moved in 1970 to 1979 (%) - American Indian and Alaska Native
Year householder moved into unit - Moved in 1970 to 1979 (%) - Multirace
Year householder moved into unit - Moved in 1970 to 1979 (%) - Other Race
Year householder moved into unit - Moved in 1969 or earlier (%)
Year householder moved into unit - Moved in 1969 or earlier (%) - White
Year householder moved into unit - Moved in 1969 or earlier (%) - Black or African American
Year householder moved into unit - Moved in 1969 or earlier (%) - Asian
Year householder moved into unit - Moved in 1969 or earlier (%) - Hispanic or Latino
Year householder moved into unit - Moved in 1969 or earlier (%) - American Indian and Alaska Native
Year householder moved into unit - Moved in 1969 or earlier (%) - Multirace
Year householder moved into unit - Moved in 1969 or earlier (%) - Other Race
Housing units lacking complete plumbing facilities (%)
Housing units lacking complete kitchen facilities (%)
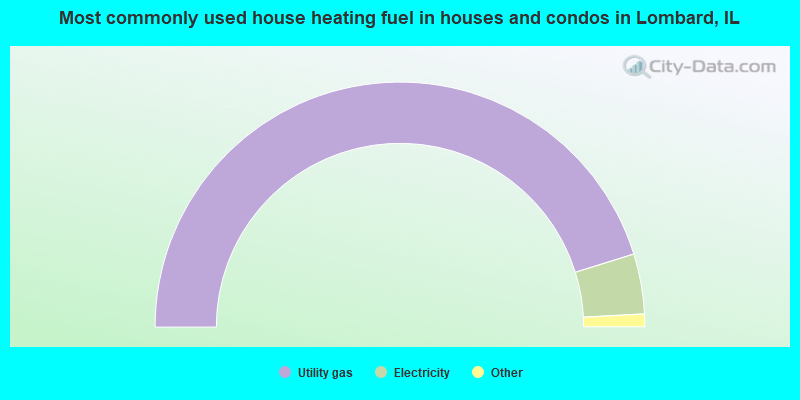
House heating fuel used in houses and condos - Utility gas (%)
House heating fuel used in houses and condos - Bottled, tank, or LP gas (%)
House heating fuel used in houses and condos - Electricity (%)
House heating fuel used in houses and condos - Fuel oil, kerosene, etc. (%)
House heating fuel used in houses and condos - Coal or coke (%)
House heating fuel used in houses and condos - Wood (%)
House heating fuel used in houses and condos - Solar energy (%)
House heating fuel used in houses and condos - Other fuel (%)
House heating fuel used in houses and condos - No fuel used (%)
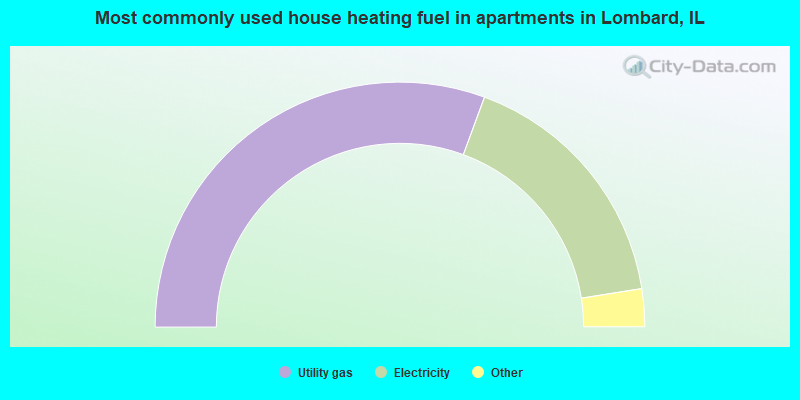
House heating fuel used in apartments - Utility gas (%)
House heating fuel used in apartments - Bottled, tank, or LP gas (%)
House heating fuel used in apartments - Electricity (%)
House heating fuel used in apartments - Fuel oil, kerosene, etc. (%)
House heating fuel used in apartments - Coal or coke (%)
House heating fuel used in apartments - Wood (%)
House heating fuel used in apartments - Solar energy (%)
House heating fuel used in apartments - Other fuel (%)
House heating fuel used in apartments - No fuel used (%)
Latest news about housing in Lombard, IL collected exclusively by city-data.com from local newspapers, TV, and radio stations
Median year house/condo built: 1967Median year apartment built: 1977Household type by relationship:
Households: 43,597
Male householders: 8,557 (2,147 living alone ), Female householders: 8,444 (2,697 living alone )9,052 spouses (8,992 opposite-sex spouses ), 1,049 unmarried partners , (972 opposite-sex unmarried partners ), 12,578 children (11,905 natural , 184 adopted , 488 stepchildren ), 644 grandchildren , 609 brothers or sisters , 810 parents , 0 foster children , 577 other relatives , 592 non-relatives In group quarters: 680
Size of family households: 5,016 2-persons , 2,732 3-persons , 1,871 4-persons , 1,086 5-persons , 256 6-persons , 274 7-or-more-persons .
Size of nonfamily households: 5,021 1-person , 1,058 2-persons , 13 3-persons , 18 5-persons .
6,663 married couples with children. single-parent households (264 men , 1,056 women ).
76.6% of residents of Lombard speak English at home. of residents speak Spanish at home (72% speak English very well , 13% speak English well , 12% speak English not well , 3% don't speak English at all ).of residents speak other Indo-European language at home (71% speak English very well , 23% speak English well , 4% speak English not well , 2% don't speak English at all ).of residents speak Asian or Pacific Island language at home (69% speak English very well , 24% speak English well , 6% speak English not well , 1% don't speak English at all ).of residents speak other language at home (100% speak English very well ).
Foreign born population: 7,139 (16.4%)of them are naturalized citizens )
Median number of rooms in houses and condos:
Median number of rooms in apartments
Owner-occupied Renter-occupied
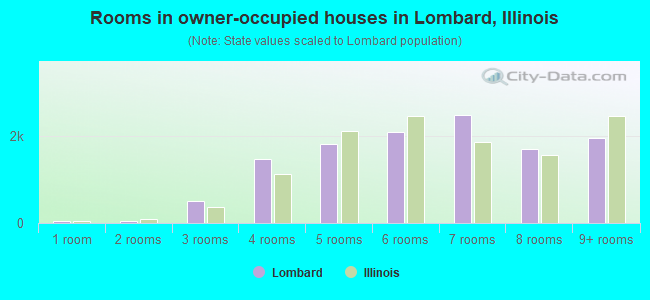
Rooms in owner-occupied houses in Lombard, Illinois
36 1 room 46 2 rooms 506 3 rooms 1,462 4 rooms 1,805 5 rooms 2,088 6 rooms 2,481 7 rooms 1,696 8 rooms 1,962 9+ rooms
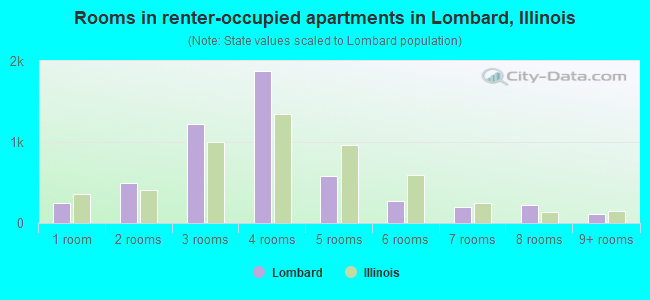
Rooms in renter-occupied apartments in Lombard, Illinois
251 1 room 489 2 rooms 1,221 3 rooms 1,872 4 rooms 576 5 rooms 270 6 rooms 196 7 rooms 220 8 rooms 108 9+ rooms
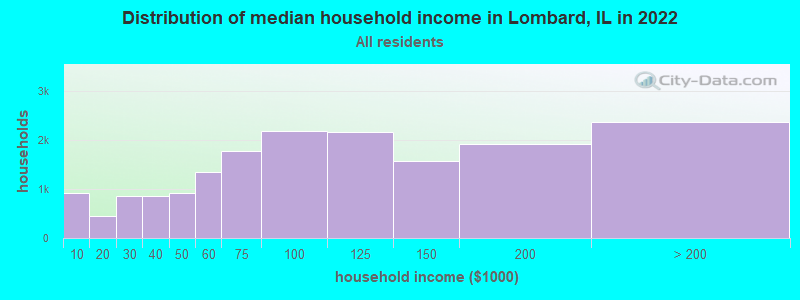
Lombard, IL household income distribution 922 Less than $10,000457 $10,000 to $19,999853 $20,000 to $29,999862 $30,000 to $39,999922 $40,000 to $49,9991,351 $50,000 to $59,9991,763 $60,000 to $74,9992,188 $75,000 to $99,9992,165 $100,000 to $124,9991,558 $125,000 to $149,9991,922 $150,000 to $199,9992,362 $200,000 or more
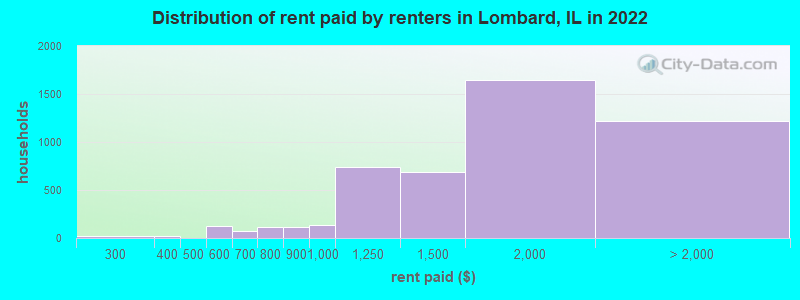
Home value of owner - occupied houses in 2022 in Lombard, IL 42 Less than $10,00033 $10,000 to $14,9997 $15,000 to $19,99914 $20,000 to $24,99933 $25,000 to $29,999104 $30,000 to $34,9996 $35,000 to $39,9999 $40,000 to $49,9996 $50,000 to $59,99911 $60,000 to $69,99924 $70,000 to $79,99913 $80,000 to $89,999104 $90,000 to $99,999351 $100,000 to $124,999400 $125,000 to $149,999362 $150,000 to $174,999321 $175,000 to $199,9991,358 $200,000 to $249,9992,281 $250,000 to $299,9994,224 $300,000 to $399,9991,511 $400,000 to $499,999968 $500,000 to $749,999151 $750,000 to $999,99919 $1,000,000 to $1,499,9998 $1,500,000 to $1,999,99917 $2,000,000 or moreRent paid by renters in 2022 in Lombard, IL 22 $250 to $29918 $300 to $349112 $500 to $5496 $550 to $59943 $600 to $64928 $650 to $69955 $700 to $74958 $750 to $799111 $800 to $899135 $900 to $999741 $1,000 to $1,249687 $1,250 to $1,4991,643 $1,500 to $1,999595 $2,000 to $2,499101 $2,500 to $2,999258 $3,000 to $3,499146 $3,500 or more115 No cash rent
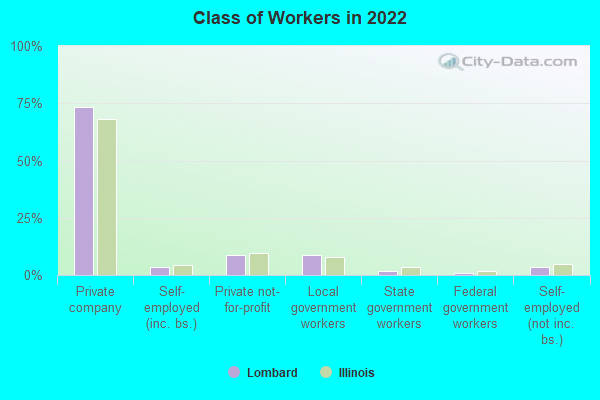
Percentage of workers working in this county: 71.8%Number of people working at home: 4,821 (20.3% of all workers )
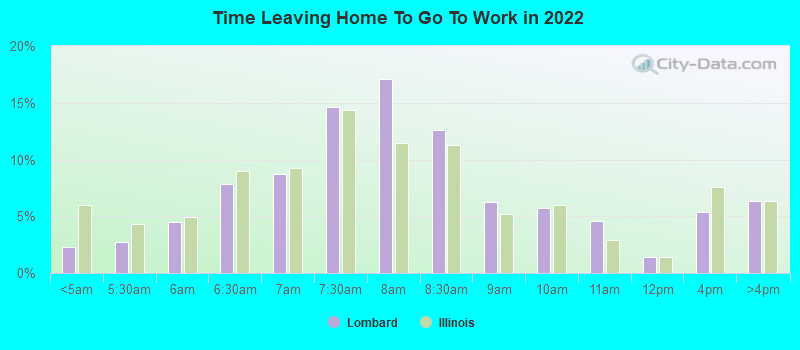
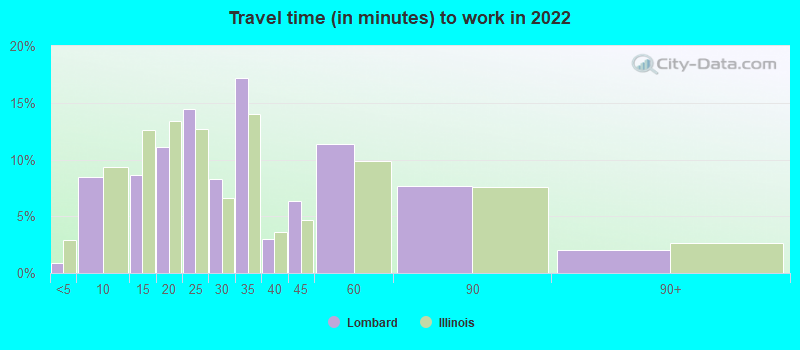
Travel time to work (commute)
Less than 5 minutes: 2085 to 9 minutes: 1,98610 to 14 minutes: 2,28415 to 19 minutes: 2,41320 to 24 minutes: 3,49525 to 29 minutes: 1,69830 to 34 minutes: 2,22935 to 39 minutes: 55240 to 44 minutes: 94945 to 59 minutes: 2,13560 to 89 minutes: 92490 or more minutes: 164
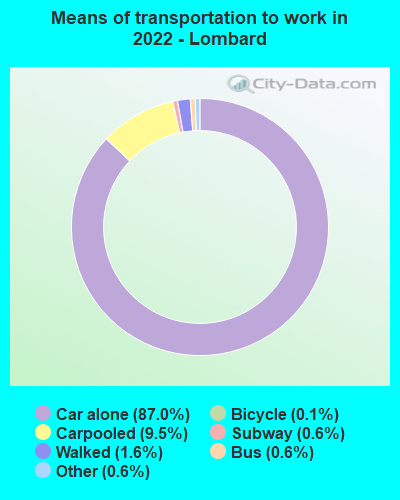
Means of transportation to work:
Drove a car alone: 21,206 (71.2%)Carpooled: 2,857 (9.6%)Bus : 220 (0.7%)Subway or elevated rail : 19 (0.1%)Long-distance train or commuter rail : 126 (0.4%)Taxi: 176 (0.6%)Bicycle: 21 (0.1%)Walked: 356 (1.2%)Worked at home: 4,821 (16.2%)
Unemployment by race in 2022
Unemployment rate for White non-Hispanic residents 2.5% Males2.5% FemalesUnemployment rate for Black residents 3.8% Males8.1% FemalesUnemployment rate for Asian residents 2.3% Males1.6% FemalesUnemployment rate for other race residents 17.8% MalesUnemployment rate for two or more race residents 12.7% Males3.5% FemalesUnemployment rate for Hispanic or Latino residents 12.9% Males12.4% Females
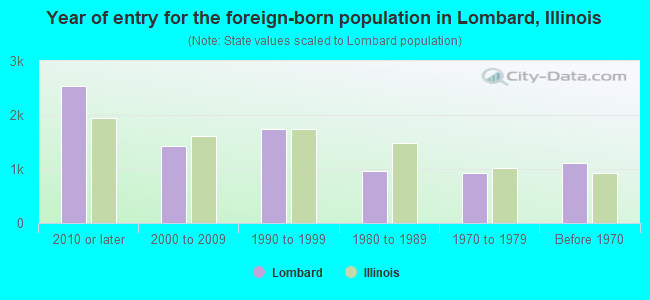
Year of entry for the foreign-born population in Lombard, Illinois
2,537 2010 or later 1,432 2000 to 2009 1,739 1990 to 1999 969 1980 to 1989 935 1970 to 1979 1,108 Before 1970
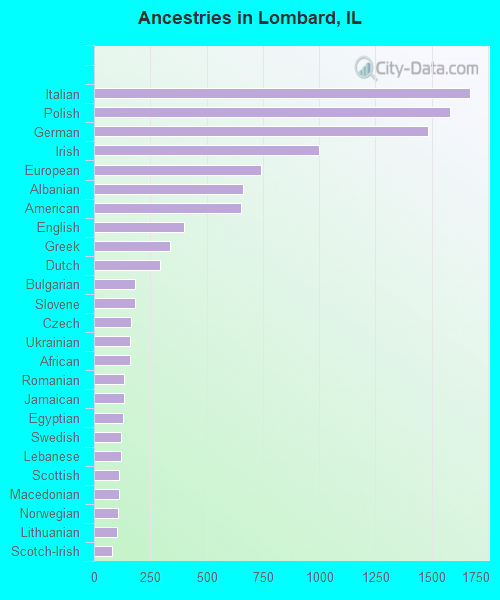
First ancestries reported:
Italian: 1,671 (8.5%)
Polish: 1,581 (8.0%)
German: 1,484 (7.6%)
Irish: 1,001 (5.1%)
European: 740 (3.8%)
Albanian: 660 (3.4%)
American: 654 (3.3%)
English: 399 (2.0%)
Greek: 336 (1.7%)
Dutch: 292 (1.5%)
Bulgarian: 183 (0.9%)
Slovene: 183 (0.9%)
Czech: 163 (0.8%)
Ukrainian: 161 (0.8%)
African: 160 (0.8%)
Romanian: 135 (0.7%)
Jamaican: 133 (0.7%)
Egyptian: 130 (0.7%)
Swedish: 119 (0.6%)
Lebanese: 118 (0.6%)
Scottish: 113 (0.6%)
Macedonian: 112 (0.6%)
Norwegian: 106 (0.5%)
Lithuanian: 100 (0.5%)
Scotch-Irish: 79 (0.4%)
Iranian: 71 (0.4%)
Russian: 68 (0.3%)
Serbian: 60 (0.3%)
Yugoslavian: 49 (0.2%)
Eastern European: 48 (0.2%)
Somali: 48 (0.2%)
Croatian: 46 (0.2%)
Swiss: 40 (0.2%)
Slovak: 39 (0.2%)
Assyrian: 39 (0.2%)
Danish: 38 (0.2%)
Haitian: 38 (0.2%)
Czechoslovakian: 37 (0.2%)
French: 33 (0.2%)
Northern European: 33 (0.2%)
Trinidadian and Tobagonian: 33 (0.2%)
Australian: 31 (0.2%)
Austrian: 30 (0.2%)
British: 28 (0.1%)
Hungarian: 20 (0.1%)
Welsh: 20 (0.1%)
Moroccan: 19 (0.10%)
Brazilian: 19 (0.10%)
Belgian: 17 (0.09%)
Scandinavian: 15 (0.08%)
Finnish: 12 (0.06%)
Ethiopian: 12 (0.06%)
Canadian: 11 (0.06%)
Nigerian: 11 (0.06%)
French Canadian: 8 (0.04%)
Turkish: 6 (0.03%)
Armenian: 6 (0.03%)
Jordanian: 6 (0.03%)
Celtic: 2 (0.01%)
Palestinian: 1 (0.01%)
Most common places of birth for foreign-born residents (%): India Lombard:
24.0% (1,723)Illinois:
9.2% (166,409)
Mexico Lombard:
10.7% (769)Illinois:
34.7% (626,958)
Pakistan Lombard:
9.0% (649)Illinois:
1.6% (29,519)
Albania Lombard:
8.0% (577)Illinois:
0.4% (6,488)
Philippines Lombard:
6.4% (460)Illinois:
5.2% (93,003)
Poland Lombard:
6.1% (440)Illinois:
6.9% (124,474)
China, excluding Hong Kong and Taiwan Lombard:
3.7% (264)Illinois:
4.1% (74,364)
Venezuela Lombard:
2.6% (190)Illinois:
0.5% (9,688)
Korea Lombard:
2.6% (188)Illinois:
2.2% (40,393)
Bangladesh Lombard:
2.0% (143)Illinois:
0.2% (2,731)
Jamaica Lombard:
1.7% (122)Illinois:
0.5% (8,168)
Ukraine Lombard:
1.6% (115)Illinois:
1.6% (29,316)
Honduras Lombard:
1.5% (110)Illinois:
0.6% (10,762)
Bulgaria Lombard:
1.5% (110)Illinois:
0.8% (14,165)
Place of birth for U.S.-born residents:
This state: 29,628Other state: 6,298Northeast: 1,015Midwest: 3,486South: 1,026West: 800 88.5% of Lombard residents lived in the same house 1 years ago.
Out of people who lived in different houses, 31.1% lived in this county.
Out of people who lived in different counties, 70.0% lived in Illinois.
Lombard:
88.5%State average:
88.3%
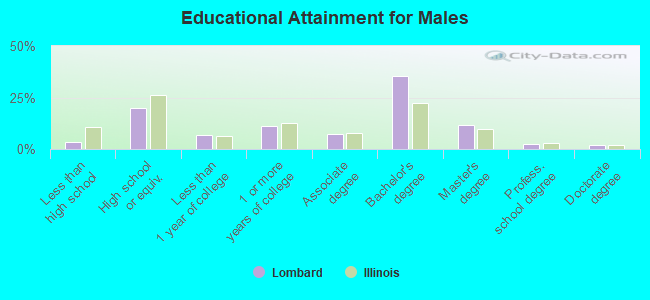
Education attainment for males 25 years and older:
No schooling: 100Nursery to 4th grade: 265th and 6th grade: 297th and 8th grade: 899th grade: 2110th grade: 3611th grade: 1712th grade, no diploma: 177High school graduate (or equivalency): 2,985Less than 1 year of college: 995Some college more than 1 year, no degree: 1,642Associate degree: 1,127Bachelor's degree: 5,339Master's degree: 1,736Professional school degree: 398Doctorate degree: 304
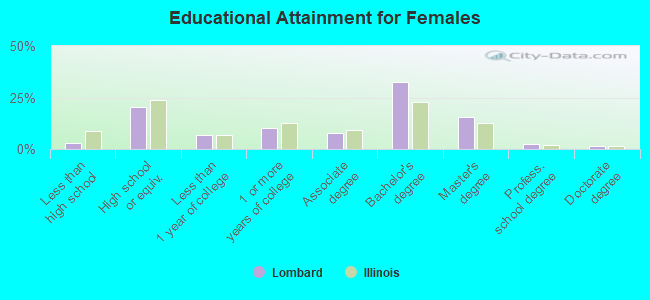
Education attainment for females 25 years and older:
No schooling: 127Nursery to 4th grade: 235th and 6th grade: 507th and 8th grade: 489th grade: 110th grade: 11311th grade: 2312th grade, no diploma: 119High school graduate (or equivalency): 3,260Less than 1 year of college: 1,084Some college more than 1 year, no degree: 1,654Associate degree: 1,203Bachelor's degree: 5,162Master's degree: 2,465Professional school degree: 375Doctorate degree: 269
Housing units in structures:
One, detached: 10,042One, attached: 1,285Two: 2473 or 4: 2525 to 9: 81910 to 19: 67520 to 49: 1,13550 or more: 3,837Mobile homes: 6Housing units lacking complete plumbing facilities in 2022: 0.0%Housing units lacking complete kitchen facilities in 2022: 1.2%House/condo owner moved in on average 13 years ago
Renter moved in on average 1 years ago
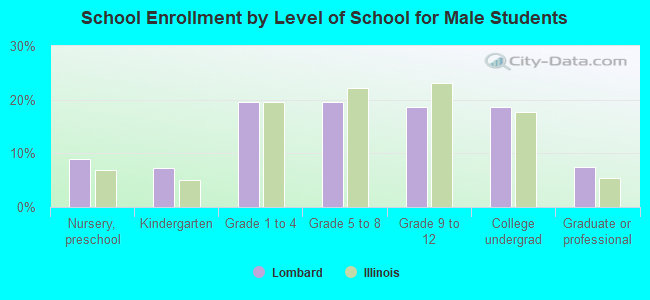
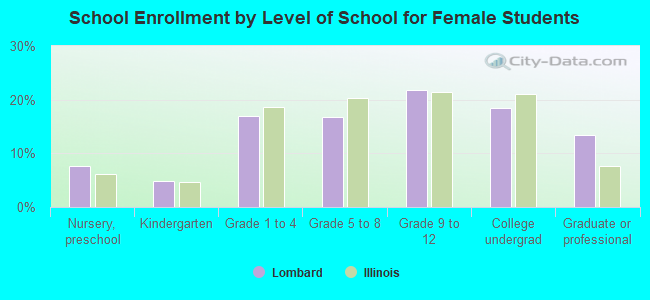
Private vs. public school enrollment:
Students in private schools in grades 1 to 8 (elementary and middle school): 660 Students in private schools in grades 9 to 12 (high school): 97 Students in private undergraduate colleges: 738