Long Branch, NJ (New Jersey) Houses and Residents
| Long Branch: | $496,272 |
| New Jersey: | $428,900 |
Mean price in 2022:
Detached houses: $660,811
Here: $660,811 State: $537,591 Townhouses or other attached units: $504,958
Here: $504,958 State: $381,113 In 2-unit structures: $440,959
Here: $440,959 State: $444,476 In 3-to-4-unit structures: $697,498
Here: $697,498 State: $457,463 In 5-or-more-unit structures: $562,752
Here: $562,752 State: $368,745
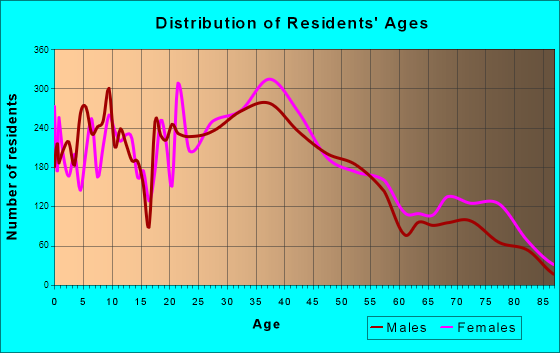
Total population: 30,522 (All urban)
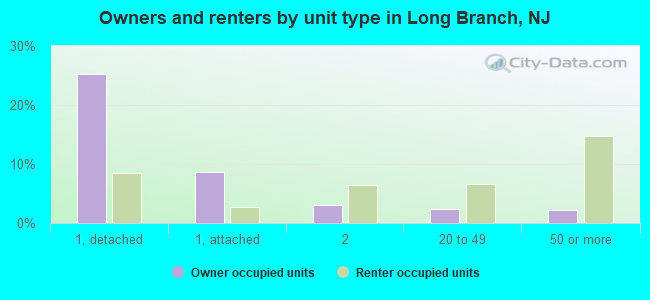
Houses: 15,109 (12,881 occupied: 5,581 owner occupied, 7,523 renter occupied)
| % of renters here: | 57% |
| State: | 35% |
Housing density: 2,897 houses/condos per square mile
Median price asked for vacant for-sale houses and condos in 2022: $349,104.
Median contract rent in 2022: $1,450 (lower quartile is $1,049, upper quartile is $1,920)
Median rent asked for vacant for-rent units in 2022: $3,014
Median gross rent in Long Branch, NJ in 2022: $1,623
Housing units in Long Branch with a mortgage: 3,344 (182 second mortgage, 8 home equity loan, 167 both second mortgage and home equity loan)
Houses without a mortgage: 96
Median household income for houses/condos with a mortgage: $103,085
Median household income for apartments without a mortgage: $80,808
Median monthly housing costs: $1,691
Compare current foreclosures in Long Branch, NJ:
| Photo | Address | Area | Beds / Baths | Price | Details |
|---|---|---|---|---|---|

|
#1
Dudley St
Long Branch, NJ 07740
|
1,668 sq. feet
|
1 baths 3 beds |
show details | |

|
#2
Patten Ave Apt 30
Long Branch, NJ 07740
|
- sq. feet
|
- baths - beds |
show details | |

|
#3
Hobart Mnr
Long Branch, NJ 07740
|
- sq. feet
|
- baths - beds |
show details | |

|
#4
Greens Ave Apt 27a
Long Branch, NJ 07740
|
- sq. feet
|
- baths - beds |
show details | |

|
#5
Hoey Ave
Long Branch, NJ 07740
|
2,286 sq. feet
|
- baths - beds |
show details | |

|
#6
Church St
Long Branch, NJ 07740
|
1,294 sq. feet
|
- baths - beds |
show details | |

|
#7
Norwood Ave
Long Branch, NJ 07740
|
1,521 sq. feet
|
- baths - beds |
show details | |

|
#8
Ocean Ave # 8
Long Branch, NJ 07740
|
1,504 sq. feet
|
- baths - beds |
show details | |

|
#9
Lincoln Ave
Long Branch, NJ 07740
|
2,857 sq. feet
|
- baths - beds |
show details | |

|
#10
Poole Ave
Long Branch, NJ 07740
|
2,120 sq. feet
|
- baths - beds |
show details |
| Photo | Address | Area | Beds / Baths | Price | Details |
|---|---|---|---|---|---|

|
#11
Melrose Ter Apt 107
Long Branch, NJ 07740
|
- sq. feet
|
- baths - beds |
show details | |

|
#12
Ocean Blvd N Apt 5h
Long Branch, NJ 07740
|
1,417 sq. feet
|
- baths - beds |
show details | |

|
#13
W End Ave
Long Branch, NJ 07740
|
1,778 sq. feet
|
- baths - beds |
show details | |

|
#14
Joline Ave
Long Branch, NJ 07740
|
1,286 sq. feet
|
- baths - beds |
show details | |

|
#15
Highland Ave
Long Branch, NJ 07740
|
2,608 sq. feet
|
- baths - beds |
show details | |

|
#16
Jeffrey St
Long Branch, NJ 07740
|
1,656 sq. feet
|
- baths - beds |
show details | |

|
#17
S 5th Ave
Long Branch, NJ 07740
|
2,635 sq. feet
|
- baths - beds |
show details | |

|
#18
6th Ave # 2
Long Branch, NJ 07740
|
1,201 sq. feet
|
- baths - beds |
show details | |

|
#19
Oakley Ave
Long Branch, NJ 07740
|
- sq. feet
|
- baths - beds |
show details | |

|
#20
Woodgate Ave
Long Branch, NJ 07740
|
6,366 sq. feet
|
- baths - beds |
show details |
| Photo | Address | Area | Beds / Baths | Price | Details |
|---|---|---|---|---|---|

|
#21
Ellis Ave # 5
Long Branch, NJ 07740
|
- sq. feet
|
- baths - beds |
show details | |

|
#22
Norwood Ave
Long Branch, NJ 07740
|
1,192 sq. feet
|
- baths - beds |
show details | |

|
#23
Atlantic Ave
Long Branch, NJ 07740
|
1,452 sq. feet
|
- baths - beds |
show details | |

|
#24
Long Branch Ave
Long Branch, NJ 07740
|
1,174 sq. feet
|
- baths - beds |
show details | |

|
#25
Westwood Ave
Long Branch, NJ 07740
|
2,792 sq. feet
|
- baths - beds |
show details | |

|
#26
Russell Ave
Long Branch, NJ 07740
|
1,324 sq. feet
|
- baths - beds |
show details | |

|
#27
Mcclellan St
Long Branch, NJ 07740
|
1,632 sq. feet
|
- baths - beds |
show details | |

|
#28
Atlantic Ave Apt 86
Long Branch, NJ 07740
|
- sq. feet
|
- baths - beds |
show details | |

|
#29
Patten Ave Apt 2a
Long Branch, NJ 07740
|
- sq. feet
|
- baths - beds |
show details | |

|
#30
High St
Long Branch, NJ 07740
|
1,666 sq. feet
|
- baths - beds |
show details |
| Photo | Address | Area | Beds / Baths | Price | Details |
|---|---|---|---|---|---|

|
#31
Bath Ave Apt 43
Long Branch, NJ 07740
|
1,056 sq. feet
|
- baths - beds |
show details | |

|
#32
Buttonwood Ave
Long Branch, NJ 07740
|
1,208 sq. feet
|
- baths - beds |
show details | |

|
#33
N 5th Ave # 3
Long Branch, NJ 07740
|
1,201 sq. feet
|
- baths - beds |
show details | |

|
#34
Hollywood Ave
Long Branch, NJ 07740
|
2,454 sq. feet
|
- baths - beds |
show details | |

|
#35
S Lincoln Ave Apt 29
Long Branch, NJ 07740
|
- sq. feet
|
- baths - beds |
show details | |

|
#36
Gerard Ave
Long Branch, NJ 07740
|
2,046 sq. feet
|
- baths - beds |
show details | |

|
#37
Rockwell Ave
Long Branch, NJ 07740
|
1,547 sq. feet
|
- baths - beds |
show details | |

|
#38
Liberty St
Long Branch, NJ 07740
|
1,364 sq. feet
|
- baths - beds |
show details | |

|
#39
Overlook Ave
Long Branch, NJ 07740
|
4,448 sq. feet
|
- baths - beds |
show details | |

|
#40
Overton Pl
Long Branch, NJ 07740
|
1,360 sq. feet
|
- baths - beds |
show details |
| Photo | Address | Area | Beds / Baths | Price | Details |
|---|---|---|---|---|---|

|
#41
Branchport Ave
Long Branch, NJ 07740
|
2,150 sq. feet
|
- baths - beds |
show details | |

|
#42
W Hillsdale Ave
Long Branch, NJ 07740
|
1,056 sq. feet
|
- baths - beds |
show details | |

|
#43
Tabor St
Long Branch, NJ 07740
|
- sq. feet
|
- baths - beds |
show details | |

|
#44
N 5th Ave
Long Branch, NJ 07740
|
1,422 sq. feet
|
- baths - beds |
show details | |

|
#45
Wall St
Long Branch, NJ 07740
|
2,146 sq. feet
|
- baths - beds |
show details | |

|
#46
Delmonte Ln
Long Branch, NJ 07740
|
2,236 sq. feet
|
- baths - beds |
show details | |

|
#47
Morris Ave
Long Branch, NJ 07740
|
2,274 sq. feet
|
- baths - beds |
show details | |

|
#48
Sherman Ct
Long Branch, NJ 07740
|
1,230 sq. feet
|
- baths - beds |
show details | |

|
#49
Garfield Ter
Long Branch, NJ 07740
|
2,627 sq. feet
|
- baths - beds |
show details | |

|
Check over 1 million property listings on Foreclosure.com!
|
browse all offers | |||


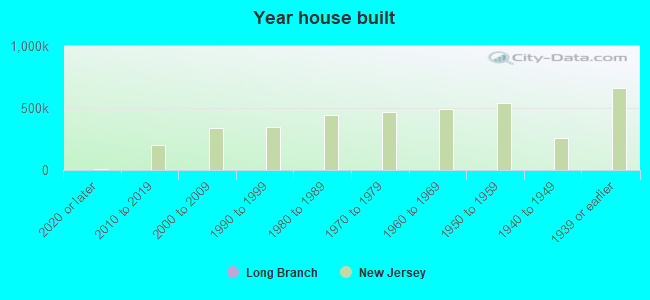
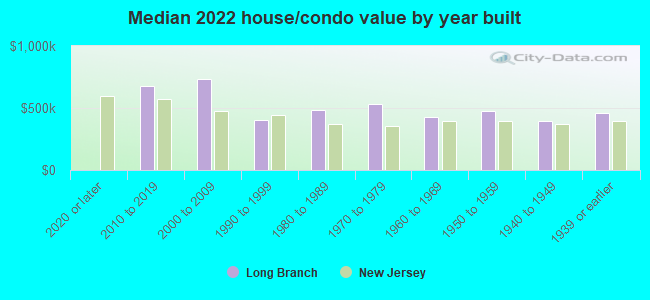
Median year apartment built: 1975
Household type by relationship:
Households: 31,983- Male householders: 5,792 (1,449 living alone), Female householders: 7,041 (2,275 living alone)
4,867 spouses (4,835 opposite-sex spouses), 927 unmarried partners, (843 opposite-sex unmarried partners), 8,594 children (8,185 natural, 158 adopted, 251 stepchildren), 975 grandchildren, 437 brothers or sisters, 490 parents, 0 foster children, 941 other relatives, 1,693 non-relatives
- In group quarters: 220
Size of family households: 3,580 2-persons, 2,058 3-persons, 1,621 4-persons, 734 5-persons, 119 6-persons, 220 7-or-more-persons.
Size of nonfamily households: 3,714 1-person, 736 2-persons, 118 3-persons, 99 4-persons, 98 5-persons, 26 6-persons.
2,918 married couples with children.
2,891 single-parent households (552 men, 2,339 women).
64.7% of residents of Long Branch speak English at home.
13.8% of residents speak Spanish at home (50% speak English very well, 24% speak English well, 23% speak English not well, 4% don't speak English at all).
22.2% of residents speak other Indo-European language at home (40% speak English very well, 22% speak English well, 34% speak English not well, 4% don't speak English at all).
0.7% of residents speak Asian or Pacific Island language at home (79% speak English very well, 13% speak English well, 7% speak English not well, 1% don't speak English at all).
1.7% of residents speak other language at home (97% speak English very well, 3% speak English not well).
Foreign born population: 8,315 (26.0%)
(39.7% of them are naturalized citizens)
| Here: | 5.9 |
| State: | 6.8 |
| Here: | 4.0 |
| State: | 3.9 |
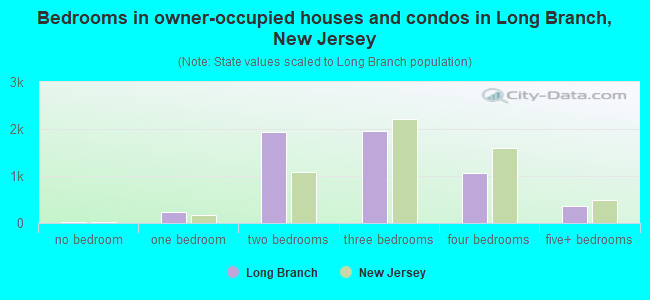
- Bedrooms in owner-occupied houses and condos in Long Branch, New Jersey
- 26no bedroom
- 2411 bedroom
- 1,9302 bedrooms
- 1,9563 bedrooms
- 1,0684 bedrooms
- 3615+ bedrooms
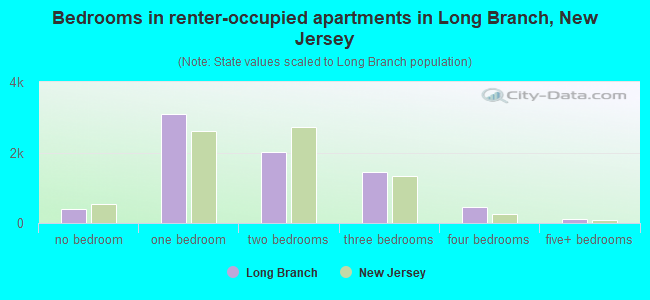
- Bedrooms in renter-occupied apartments in Long Branch, New Jersey
- 408no bedroom
- 3,0811 bedroom
- 2,0172 bedrooms
- 1,4373 bedrooms
- 4584 bedrooms
- 1235+ bedrooms
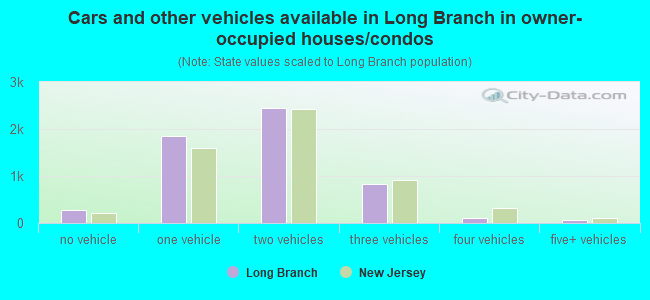
- Cars and other vehicles available in Long Branch in owner-occupied houses/condos
- 284no vehicle
- 1,8411 vehicle
- 2,4472 vehicles
- 8343 vehicles
- 1084 vehicles
- 665+ vehicles
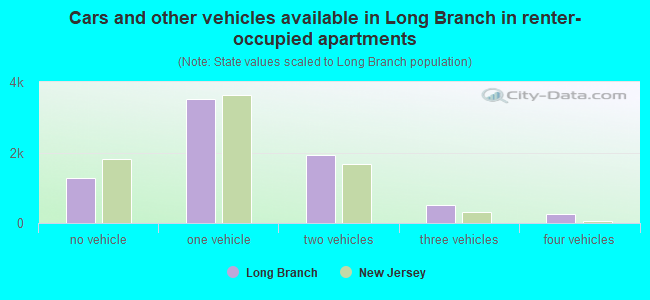
- Cars and other vehicles available in Long Branch in renter-occupied apartments
- 1,286no vehicle
- 3,5171 vehicle
- 1,9272 vehicles
- 5013 vehicles
- 2664 vehicles
- 275+ vehicles
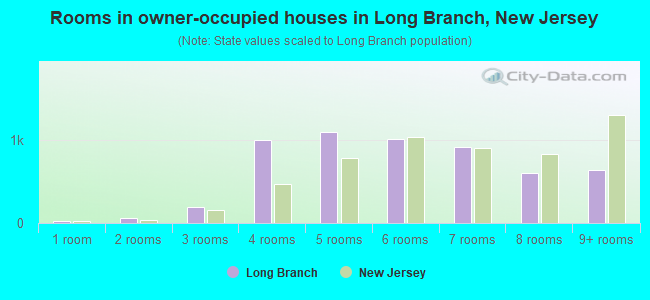
- Rooms in owner-occupied houses in Long Branch, New Jersey
- 261 room
- 622 rooms
- 1963 rooms
- 1,0054 rooms
- 1,1085 rooms
- 1,0156 rooms
- 9187 rooms
- 6128 rooms
- 6399+ rooms
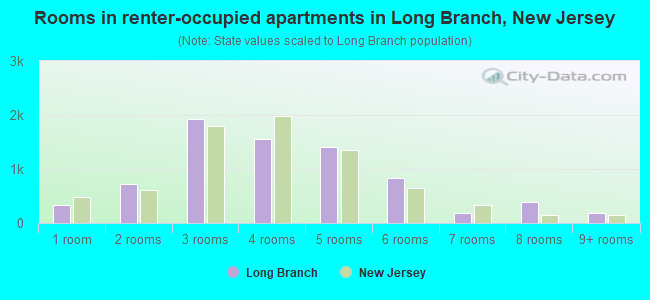
- Rooms in renter-occupied apartments in Long Branch, New Jersey
- 3411 room
- 7142 rooms
- 1,9203 rooms
- 1,5604 rooms
- 1,4025 rooms
- 8266 rooms
- 1827 rooms
- 3938 rooms
- 1869+ rooms
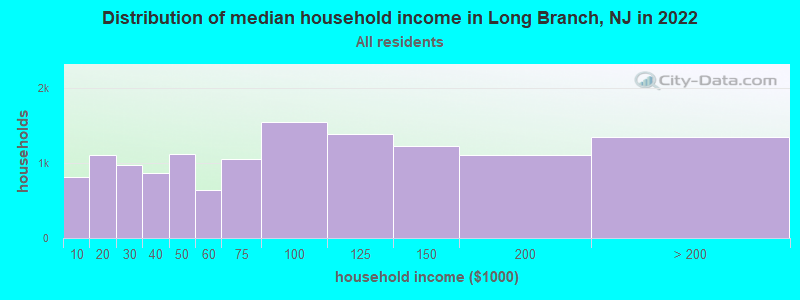
Long Branch, NJ household income distribution

- 810Less than $10,000
- 1,112$10,000 to $19,999
- 967$20,000 to $29,999
- 870$30,000 to $39,999
- 1,116$40,000 to $49,999
- 634$50,000 to $59,999
- 1,047$60,000 to $74,999
- 1,545$75,000 to $99,999
- 1,385$100,000 to $124,999
- 1,225$125,000 to $149,999
- 1,112$150,000 to $199,999
- 1,340$200,000 or more
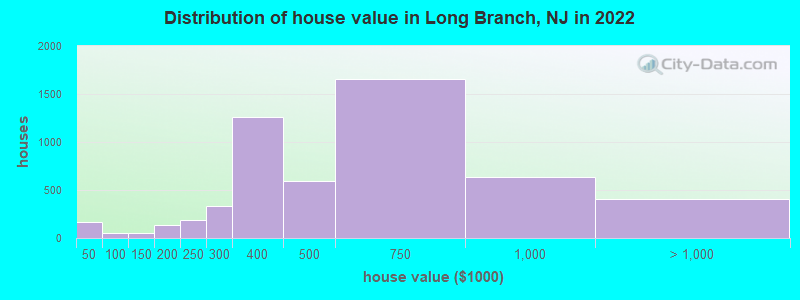
Home value of owner - occupied houses in 2022 in Long Branch, NJ
-
- 84Less than $10,000
- 8$25,000 to $29,999
- 52$30,000 to $34,999
- 15$40,000 to $49,999
- 24$50,000 to $59,999
- 11$80,000 to $89,999
- 44$100,000 to $124,999
- 10$125,000 to $149,999
- 20$150,000 to $174,999
- 111$175,000 to $199,999
- 190$200,000 to $249,999
- 329$250,000 to $299,999
- 1,262$300,000 to $399,999
- 589$400,000 to $499,999
- 1,660$500,000 to $749,999
- 633$750,000 to $999,999
- 273$1,000,000 to $1,499,999
- 34$1,500,000 to $1,999,999
- 98$2,000,000 or more
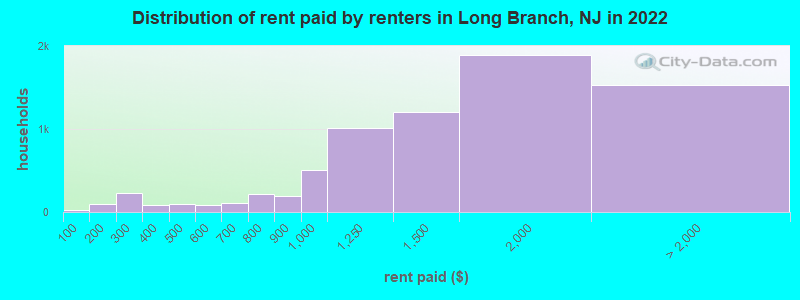
Rent paid by renters in 2022 in Long Branch, NJ
-
- 21Less than $100
- 68$100 to $149
- 29$150 to $199
- 213$200 to $249
- 21$250 to $299
- 76$300 to $349
- 3$350 to $399
- 63$400 to $449
- 36$450 to $499
- 31$500 to $549
- 49$550 to $599
- 60$600 to $649
- 44$650 to $699
- 215$700 to $749
- 190$800 to $899
- 500$900 to $999
- 1,011$1,000 to $1,249
- 1,209$1,250 to $1,499
- 1,885$1,500 to $1,999
- 765$2,000 to $2,499
- 367$2,500 to $2,999
- 130$3,000 to $3,499
- 171$3,500 or more
- 99No cash rent
Percentage of workers working in this county: 78.2%
Number of people working at home: 1,627 (10.4% of all workers)
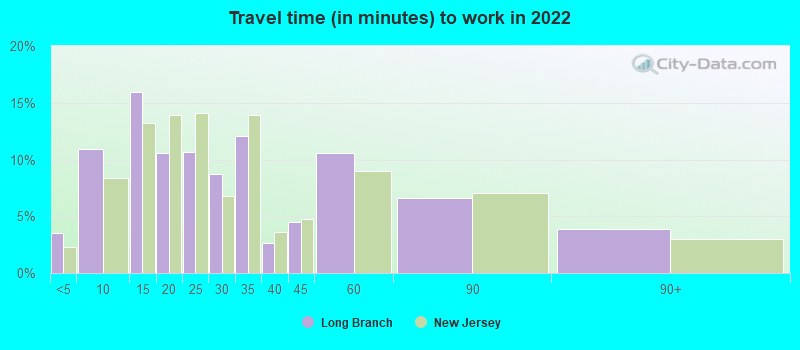
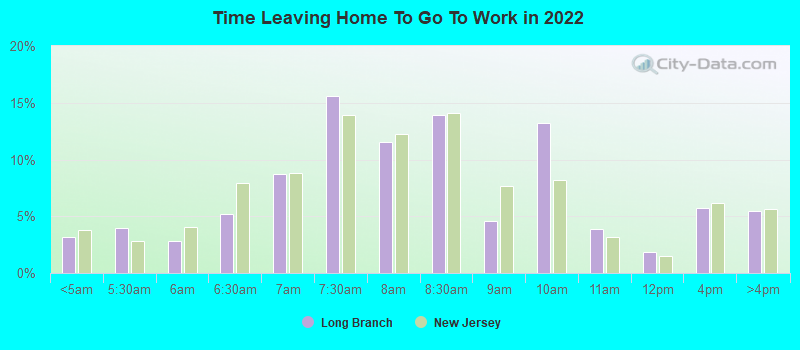
Travel time to work (commute)
- Less than 5 minutes: 441
- 5 to 9 minutes: 1,588
- 10 to 14 minutes: 2,476
- 15 to 19 minutes: 1,604
- 20 to 24 minutes: 1,580
- 25 to 29 minutes: 692
- 30 to 34 minutes: 1,964
- 35 to 39 minutes: 105
- 40 to 44 minutes: 368
- 45 to 59 minutes: 775
- 60 to 89 minutes: 1,089
- 90 or more minutes: 957
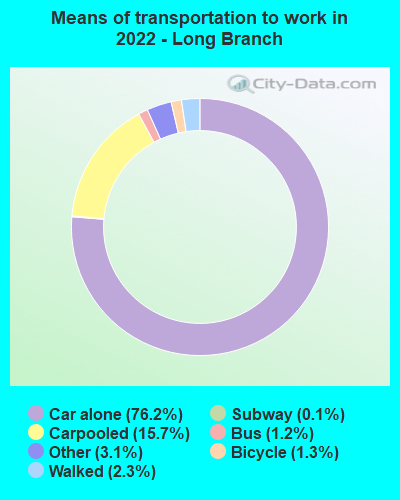
Means of transportation to work:
- Drove a car alone: 7,636 (61.6%)
- Carpooled: 1,874 (15.1%)
- Bus: 203 (1.6%)
- Long-distance train or commuter rail: 34 (0.3%)
- Taxi: 476 (3.8%)
- Bicycle: 92 (0.7%)
- Walked: 340 (2.7%)
- Worked at home: 1,627 (13.1%)
- Unemployment by race in 2022
- Unemployment rate for White non-Hispanic residents
- 4.4%Males
- 4.8%Females
- Unemployment rate for Black residents
- 12.4%Males
- 4.6%Females
- Unemployment rate for American Indian and Alaska Native residents
- 100.0%Females
- Unemployment rate for Asian residents
- 5.0%Females
- Unemployment rate for other race residents
- 5.9%Males
- 5.2%Females
- Unemployment rate for two or more race residents
- 1.6%Males
- Unemployment rate for Hispanic or Latino residents
- 7.4%Males
- 1.8%Females
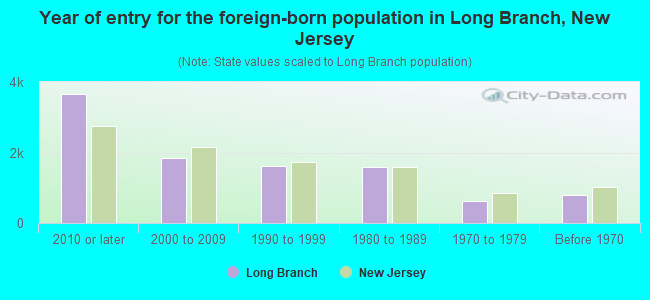
- Year of entry for the foreign-born population in Long Branch, New Jersey
- 3,6512010 or later
- 1,8412000 to 2009
- 1,6291990 to 1999
- 1,5961980 to 1989
- 6231970 to 1979
- 791Before 1970
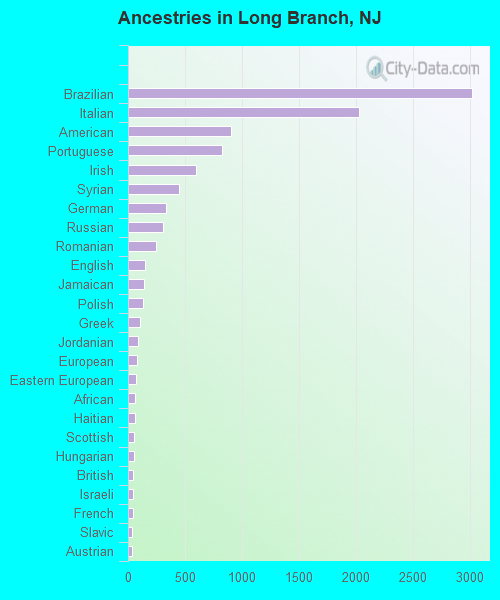
First ancestries reported:
- Brazilian: 3,018 (16.6%)
- Italian: 2,027 (11.2%)
- American: 906 (5.0%)
- Portuguese: 829 (4.6%)
- Irish: 599 (3.3%)
- Syrian: 452 (2.5%)
- German: 337 (1.9%)
- Russian: 308 (1.7%)
- Romanian: 246 (1.4%)
- English: 147 (0.8%)
- Jamaican: 142 (0.8%)
- Polish: 128 (0.7%)
- Greek: 107 (0.6%)
- Jordanian: 92 (0.5%)
- European: 81 (0.4%)
- Eastern European: 70 (0.4%)
- African: 59 (0.3%)
- Haitian: 58 (0.3%)
- Scottish: 57 (0.3%)
- Hungarian: 54 (0.3%)
- British: 47 (0.3%)
- Israeli: 47 (0.3%)
- French: 47 (0.3%)
- Slavic: 38 (0.2%)
- Austrian: 31 (0.2%)
- Turkish: 26 (0.1%)
- Armenian: 23 (0.1%)
- Czechoslovakian: 23 (0.1%)
- West Indian: 22 (0.1%)
- Egyptian: 20 (0.1%)
- Arab: 16 (0.09%)
- Welsh: 16 (0.09%)
- Norwegian: 15 (0.08%)
- Lebanese: 15 (0.08%)
- Ukrainian: 14 (0.08%)
- Belizean: 13 (0.07%)
- Canadian: 11 (0.06%)
- Ghanaian: 11 (0.06%)
- Bulgarian: 11 (0.06%)
- Slovak: 10 (0.06%)
- Scandinavian: 8 (0.04%)
- Czech: 8 (0.04%)
- Serbian: 7 (0.04%)
Most common places of birth for foreign-born residents (%):
| Long Branch: | 42.0% (3,481) |
| New Jersey: | 2.1% (46,020) |
| Long Branch: | 14.1% (1,168) |
| New Jersey: | 4.8% (102,527) |
| Long Branch: | 8.7% (720) |
| New Jersey: | 2.3% (48,885) |
| Long Branch: | 4.6% (378) |
| New Jersey: | 1.3% (28,871) |
| Long Branch: | 2.3% (188) |
| New Jersey: | 2.2% (46,813) |
| Long Branch: | 2.2% (186) |
| New Jersey: | 0.7% (15,533) |
| Long Branch: | 2.1% (175) |
| New Jersey: | 0.9% (20,371) |
| Long Branch: | 1.8% (151) |
| New Jersey: | 12.8% (274,609) |
| Long Branch: | 1.8% (150) |
| New Jersey: | 0.6% (12,929) |
| Long Branch: | 1.8% (146) |
| New Jersey: | 0.3% (6,033) |
| Long Branch: | 1.5% (126) |
| New Jersey: | 1.2% (26,173) |
Place of birth for U.S.-born residents:
- This state: 17,195
- Other state: 5,669
- Northeast: 3,805
- Midwest: 477
- South: 1,194
- West: 237
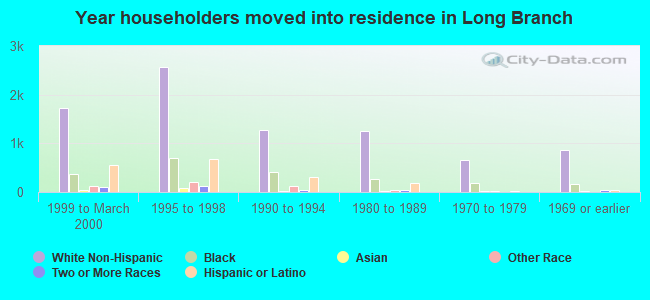
88.4% of Long Branch residents lived in the same house 1 years ago.
Out of people who lived in different houses, 33.3% lived in this county.
Out of people who lived in different counties, 56.5% lived in New Jersey.
| Long Branch: | 88.4% |
| State average: | 90.4% |
Education attainment for males 25 years and older:
- No schooling: 316
- Nursery to 4th grade: 368
- 5th and 6th grade: 116
- 7th and 8th grade: 183
- 9th grade: 117
- 10th grade: 113
- 11th grade: 73
- 12th grade, no diploma: 189
- High school graduate (or equivalency): 2,933
- Less than 1 year of college: 353
- Some college more than 1 year, no degree: 1,086
- Associate degree: 496
- Bachelor's degree: 2,014
- Master's degree: 815
- Professional school degree: 325
- Doctorate degree: 322
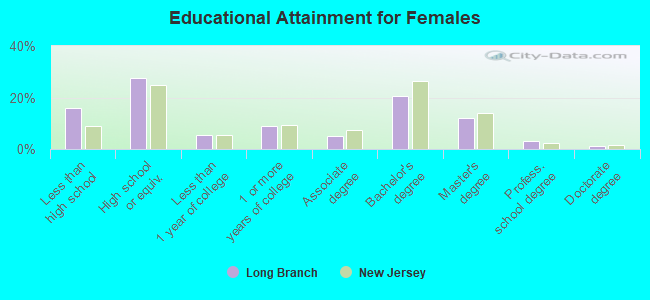
Education attainment for females 25 years and older:
- No schooling: 421
- Nursery to 4th grade: 62
- 5th and 6th grade: 242
- 7th and 8th grade: 153
- 9th grade: 189
- 10th grade: 145
- 11th grade: 320
- 12th grade, no diploma: 242
- High school graduate (or equivalency): 3,063
- Less than 1 year of college: 614
- Some college more than 1 year, no degree: 978
- Associate degree: 545
- Bachelor's degree: 2,293
- Master's degree: 1,322
- Professional school degree: 343
- Doctorate degree: 108
Housing units in structures:
- One, detached: 5,175
- One, attached: 1,774
- Two: 1,329
- 3 or 4: 1,132
- 5 to 9: 958
- 10 to 19: 682
- 20 to 49: 1,224
- 50 or more: 2,792
- Mobile homes: 40
Housing units lacking complete kitchen facilities in 2022: 1.6%
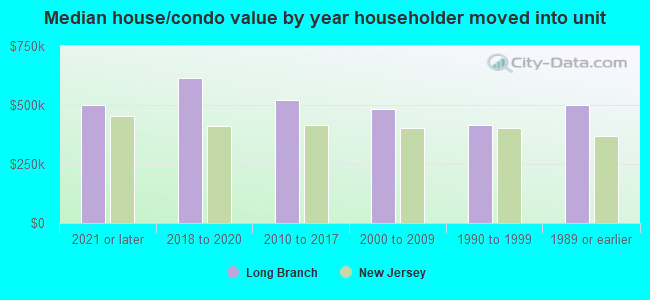
House/condo owner moved in on average 11 years ago
Renter moved in on average 3 years ago
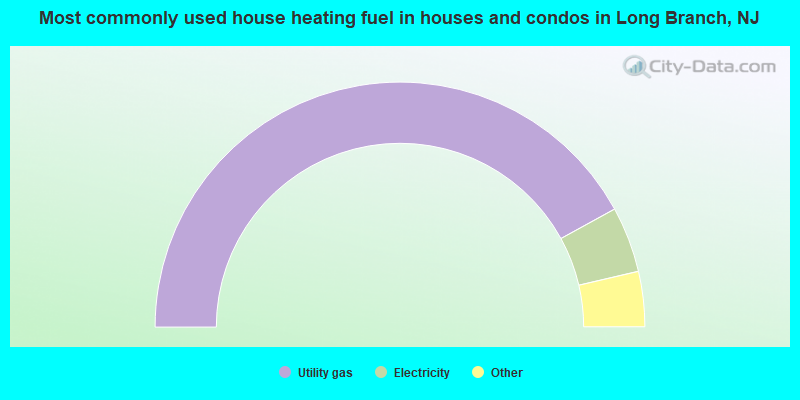
- 84.1%Utility gas
- 8.7%Electricity
- 3.9%Fuel oil, kerosene, etc.
- 1.1%Bottled, tank, or LP gas
- 1.0%Solar energy
- 0.9%Other fuel
- 0.4%No fuel used
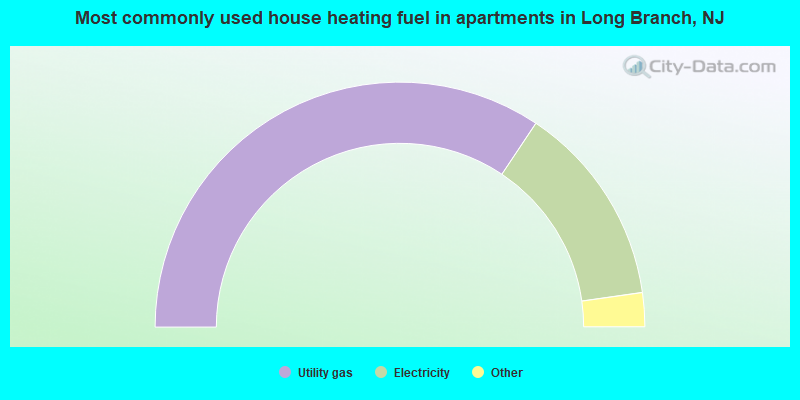
- 68.8%Utility gas
- 26.8%Electricity
- 2.0%Bottled, tank, or LP gas
- 1.1%No fuel used
- 0.8%Fuel oil, kerosene, etc.
- 0.5%Other fuel
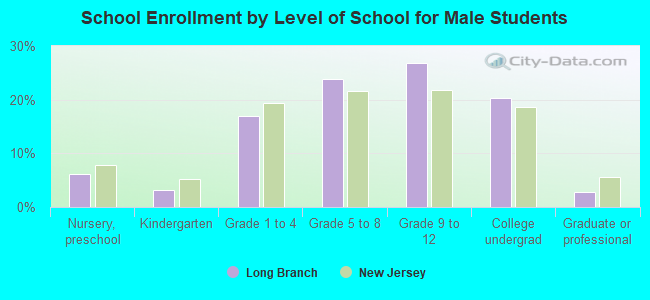
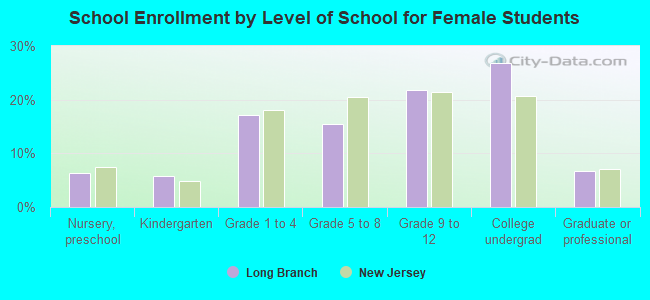
Private vs. public school enrollment:
| Here: | 10.6% |
| New Jersey: | 12.3% |
| Here: | 14.4% |
| New Jersey: | 13.1% |
| Here: | 53.5% |
| New Jersey: | 33.2% |