Median price asked for vacant for-sale houses and condos in 2022 in this county: $155,723.
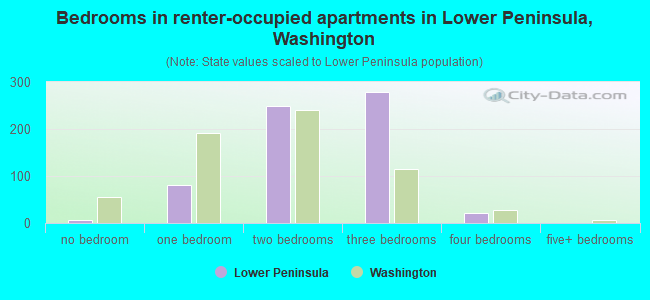
Median contract rent in 2022: $1,806 (lower quartile is $1,300, upper quartile is over $2,000)
Median rent asked for vacant for-rent units in 2022: $1,425
Median gross rent in Lower Peninsula, WA in 2022: $1,975
Housing units in Lower Peninsula with a mortgage: 1,935 (283 second mortgage, 273 home equity loan, 9 both second mortgage and home equity loan) Houses without a mortgage: 820
Compare current foreclosures near Lower Peninsula, WA:
In family households: 649,436 (139,627 male householders, 62,547 female householders)
146,885 spouses, 231,575 children (211,778 natural, 5,857 adopted, 13,940 stepchildren), 15,084 grandchildren, 7,520 brothers or sisters, 6,616 parents, foster children, 10,189 other relatives, 24,313 non-relatives
In nonfamily households: 127,844 (47,852 male householders (34,710 living alone)), 49,892 female householders (40,467 living alone)), 30,100 nonrelatives
In group quarters: 17,945 (8,874 institutionalized population)
126,863 married couples with children.
46,663 single-parent households (11,601 men, 35,062 women).
93.5% of residents of Lower Peninsula speak English at home.
2.5% of residents speak Spanish at home (64% speak English very well, 6% speak English well, 23% speak English not well, 7% don't speak English at all).
2.7% of residents speak other Indo-European language at home (87% speak English very well, 10% speak English well, 3% speak English not well).
1.0% of residents speak Asian or Pacific Island language at home (71% speak English very well, 9% speak English well, 15% speak English not well, 5% don't speak English at all).
0.3% of residents speak other language at home (100% speak English very well).
Foreign born population: 922 (5.2%)
(41.9% of them are naturalized citizens)
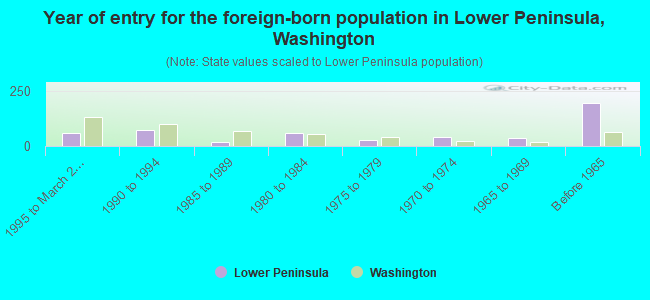
Year of entry for the foreign-born population in Lower Peninsula, Washington
611995 to March 2000
721990 to 1994
161985 to 1989
571980 to 1984
271975 to 1979
421970 to 1974
371965 to 1969
194Before 1965
Most common places of birth for foreign-born residents (%):
United Kingdom
Lower Peninsula:
21.3% (108)
Washington:
3.3% (20,321)
Germany
Lower Peninsula:
18.6% (94)
Washington:
3.4% (21,167)
Mexico
Lower Peninsula:
15.6% (79)
Washington:
24.1% (148,115)
Canada
Lower Peninsula:
8.1% (41)
Washington:
7.7% (47,568)
Korea
Lower Peninsula:
6.3% (32)
Washington:
6.2% (38,172)
France
Lower Peninsula:
4.7% (24)
Washington:
0.5% (3,086)
Iran
Lower Peninsula:
4.2% (21)
Washington:
0.7% (4,573)
Philippines
Lower Peninsula:
4.2% (21)
Washington:
7.6% (46,733)
Laos
Lower Peninsula:
3.2% (16)
Washington:
1.1% (6,542)
Cuba
Lower Peninsula:
3.2% (16)
Washington:
0.2% (1,259)
Japan
Lower Peninsula:
2.4% (12)
Washington:
2.8% (16,936)
Panama
Lower Peninsula:
2.0% (10)
Washington:
0.3% (1,548)
Other Eastern Europe
Lower Peninsula:
1.6% (8)
Washington:
1.2% (7,645)
Place of birth for U.S.-born residents:
This state: 6,543
Other state: 6,158
Northeast: 545
Midwest: 1,444
South: 1,037
West: 3,132
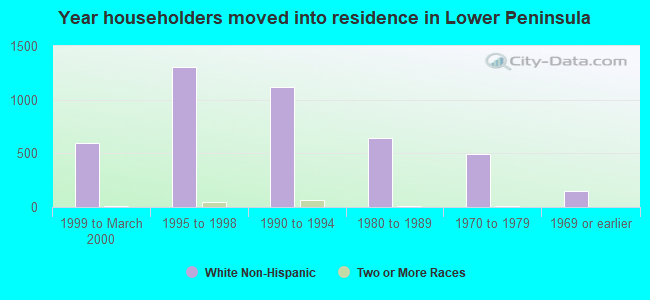
54% of Lower Peninsula residents lived in the same house 5 years ago. Out of people who lived in different houses, 44% lived in this county. Out of people who lived in different counties, 74% lived in Washington.
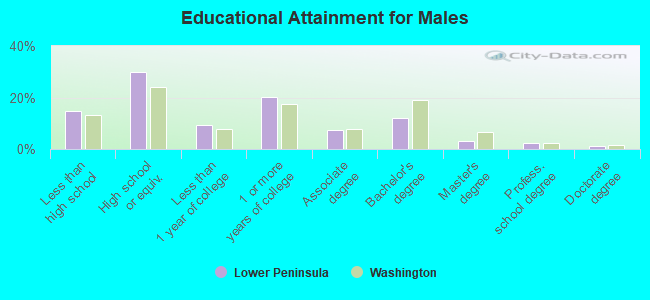
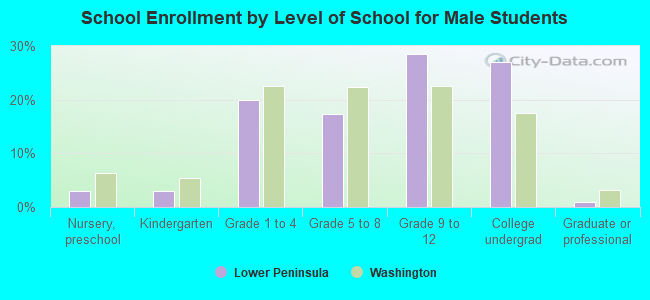
Education attainment for males 25 years and older:
No schooling: 31
Nursery to 4th grade: 5
5th and 6th grade: 14
7th and 8th grade: 137
9th grade: 88
10th grade: 115
11th grade: 220
12th grade, no diploma: 186
High school graduate (or equivalency): 1,612
Less than 1 year of college: 497
Some college more than 1 year, no degree: 1,083
Associate degree: 395
Bachelor's degree: 645
Master's degree: 175
Professional school degree: 116
Doctorate degree: 62
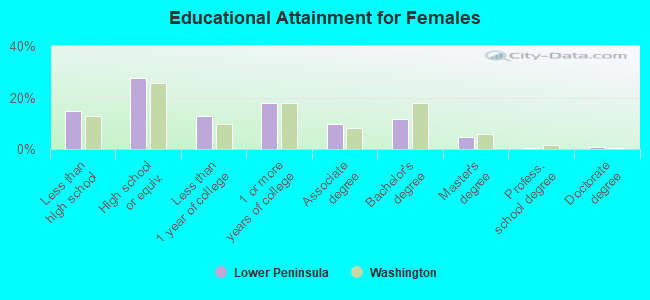
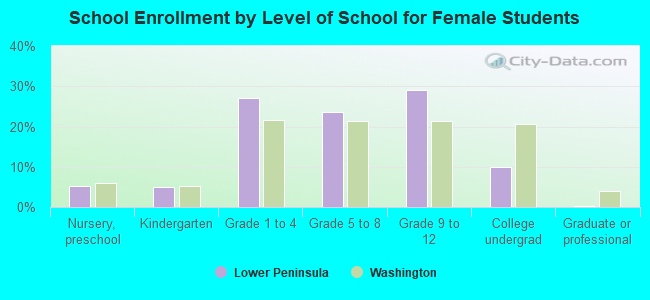
Education attainment for females 25 years and older:
No schooling: 12
Nursery to 4th grade: 0
5th and 6th grade: 0
7th and 8th grade: 75
9th grade: 49
10th grade: 141
11th grade: 190
12th grade, no diploma: 130
High school graduate (or equivalency): 1,128
Less than 1 year of college: 521
Some college more than 1 year, no degree: 728
Associate degree: 402
Bachelor's degree: 472
Master's degree: 190
Professional school degree: 12
Doctorate degree: 34
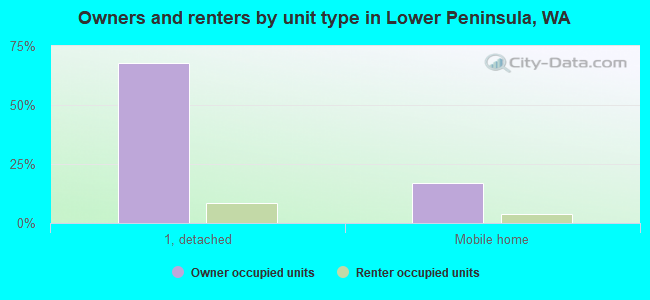
Housing units in structures:
One, detached: 4,626
One, attached: 60
Two: 33
3 or 4: 6
5 to 9: 29
Mobile homes: 1,144
Boats, RVs, vans, etc.: 94
Median worth of mobile homes: $285,707
Housing units lacking complete plumbing facilities: 2.7%
Housing units lacking complete kitchen facilities: 2.0%