Madbury, NH (New Hampshire) Houses and Residents
| Madbury: | $518,156 |
| New Hampshire: | $384,700 |
Total population: 1,771 (Urban population: 203, Rural population: 1,306 (38 farm, 1,268 nonfarm))
Houses: 543 (534 occupied: 410 owner occupied, 124 renter occupied)
| % of renters here: | 23% |
| State: | 28% |
Housing density: 46 houses/condos per square mile
Median price asked for vacant for-sale houses and condos in 2022 in this county: $227,322.
Median contract rent in 2022: $1,496 (lower quartile is $1,106, upper quartile is $1,928)
Median rent asked for vacant for-rent units in 2022: $1,525
Median gross rent in Madbury, NH in 2022: $1,658
Housing units in Madbury with a mortgage: 215 (10 second mortgage, 34 home equity loan, 0 both second mortgage and home equity loan)
Houses without a mortgage: 44
Compare current foreclosures near Madbury, NH:
| Photo | Address | Area | Beds / Baths | Price | Details |
|---|---|---|---|---|---|

|
#1
Main St
Fremont, NH 03044
|
1,470 sq. feet
|
2 baths 4 beds |
$306,800
|
show details |

|
#2
Brentwood Rd
Exeter, NH 03833
|
2,756 sq. feet
|
2 baths 3 beds |
$419,900
|
show details |

|
#3
Old Turnpike Rd
Nottingham, NH 03290
|
4,738 sq. feet
|
3 baths 3 beds |
show details | |

|
#4
Laura Dr
Rochester, NH 03867
|
1,674 sq. feet
|
3 baths 3 beds |
show details | |

|
#5
Hobart St
Rochester, NH 03867
|
1,204 sq. feet
|
1 baths 4 beds |
show details | |

|
#6
Jonathan Ave
Rochester, NH 03839
|
1,130 sq. feet
|
1 baths 2 beds |
show details | |

|
#7
Smoke St
Nottingham, NH 03290
|
4,452 sq. feet
|
2 baths 3 beds |
show details | |

|
#8
Cote Cir
Raymond, NH 03077
|
2,024 sq. feet
|
2 baths 3 beds |
show details | |

|
#9
Louise Ln
Fremont, NH 03044
|
1,960 sq. feet
|
2 baths 3 beds |
show details | |

|
#10
Frost Hill Rd, C O Gregory Jackman
Eliot, ME 03903
|
3,472 sq. feet
|
3 baths 4 beds |
show details |
| Photo | Address | Area | Beds / Baths | Price | Details |
|---|---|---|---|---|---|

|
#11
1st Nh Tpke
Northwood, NH 03261
|
3,778 sq. feet
|
2 baths 6 beds |
show details | |

|
#12
Back River Rd
Dover, NH 03820
|
1,193 sq. feet
|
1 baths 3 beds |
show details | |

|
#13
Alder St
Exeter, NH 03833
|
952 sq. feet
|
2 baths 2 beds |
show details | |

|
#14
Dearborn Rd
Epping, NH 03042
|
1,768 sq. feet
|
2 baths 3 beds |
show details | |

|
#15
Blake Rd
Epping, NH 03042
|
3,113 sq. feet
|
2 baths 2 beds |
show details | |

|
#16
Adams Park
Rye, NH 03870
|
1,008 sq. feet
|
2 baths 3 beds |
show details | |

|
#17
Roller Coaster Rd
Strafford, NH 03884
|
2,530 sq. feet
|
3 baths 6 beds |
show details | |

|
#18
Brentwood Rd
Exeter, NH 03833
|
3,683 sq. feet
|
3 baths 4 beds |
show details | |

|
#19
Harvard St
Exeter, NH 03833
|
1,509 sq. feet
|
1 baths 3 beds |
show details | |

|
#20
Plum St
Exeter, NH 03833
|
924 sq. feet
|
1 baths 3 beds |
show details |
| Photo | Address | Area | Beds / Baths | Price | Details |
|---|---|---|---|---|---|

|
#21
Old Post Rd
York, ME 03909
|
864 sq. feet
|
1 baths 2 beds |
show details | |

|
#22
Ernest Ave Apt 4
Exeter, NH 03833
|
555 sq. feet
|
1 baths 1 beds |
show details | |

|
#23
Piscassic St
Newmarket, NH 03857
|
1,608 sq. feet
|
2 baths 4 beds |
show details | |

|
#24
Cedar Point Rd
Durham, NH 03824
|
4,052 sq. feet
|
3 baths 3 beds |
show details | |

|
#25
Middle Rd
Dover, NH 03820
|
1,120 sq. feet
|
1 baths 3 beds |
show details | |

|
#26
Denmark Dr
Northwood, NH 03261
|
1,809 sq. feet
|
2 baths 3 beds |
show details | |

|
#27
Northam Dr
Dover, NH 03820
|
1,999 sq. feet
|
2 baths 3 beds |
show details | |

|
#28
Wentworth Ter
Dover, NH 03820
|
2,404 sq. feet
|
3 baths 6 beds |
show details | |

|
#29
Mildred Ave
Raymond, NH 03077
|
756 sq. feet
|
2 baths 2 beds |
show details | |

|
#30
Dowaliby Ct
Dover, NH 03820
|
1,273 sq. feet
|
1 baths 3 beds |
show details |
| Photo | Address | Area | Beds / Baths | Price | Details |
|---|---|---|---|---|---|

|
#31
Chapel St
Dover, NH 03820
|
1,872 sq. feet
|
2 baths 4 beds |
show details | |

|
#32
Pine Hill Rd
Berwick, ME 03901
|
2,882 sq. feet
|
2 baths - beds |
show details | |

|
#33
Keay Rd
Berwick, ME 03901
|
2,556 sq. feet
|
2 baths - beds |
show details | |

|
#34
2nd St
Exeter, NH 03833
|
- sq. feet
|
- baths - beds |
show details | |

|
#35
Limestone Ln
Rochester, NH 03867
|
- sq. feet
|
- baths - beds |
show details | |

|
#36
Beech Hill Rd Lot 18
Exeter, NH 03833
|
- sq. feet
|
- baths - beds |
show details | |

|
#37
Holland Way
Exeter, NH 03833
|
15,738 sq. feet
|
- baths - beds |
show details | |

|
#38
Freedom Cir Apt 30
Portsmouth, NH 03801
|
- sq. feet
|
- baths - beds |
show details | |

|
#39
New York St
Dover, NH 03820
|
- sq. feet
|
- baths - beds |
show details | |

|
#40
Lake View Dr
Strafford, NH 03884
|
- sq. feet
|
- baths - beds |
show details |
| Photo | Address | Area | Beds / Baths | Price | Details |
|---|---|---|---|---|---|

|
#41
White Cedar Blvd
Portsmouth, NH 03801
|
- sq. feet
|
- baths - beds |
show details | |

|
#42
Lafayette Rd Ste 107
Portsmouth, NH 03801
|
- sq. feet
|
- baths - beds |
show details | |

|
#43
Sagamore Ave # 13
Portsmouth, NH 03801
|
- sq. feet
|
- baths - beds |
show details | |

|
#44
Hall Pl Apt 1
Exeter, NH 03833
|
- sq. feet
|
- baths - beds |
show details | |

|
#45
Rogers St # B
Dover, NH 03820
|
- sq. feet
|
- baths - beds |
show details | |

|
#46
Fire Road 1
Strafford, NH 03884
|
- sq. feet
|
- baths - beds |
show details | |

|
#47
Beach Rose Ln
North Hampton, NH 03862
|
- sq. feet
|
- baths - beds |
show details | |

|
#48
France Rd
Barrington, NH 03825
|
- sq. feet
|
- baths - beds |
show details | |

|
#49
Boush St
Kittery, ME 03904
|
- sq. feet
|
- baths - beds |
show details | |

|
Check over 1 million property listings on Foreclosure.com!
|
browse all offers | |||
Latest news about housing in Madbury, NH collected exclusively by city-data.com from local newspapers, TV, and radio stations

 | Is NH property tax that bad? Median home cost in NH? (26 replies) |
| Moving to southeast NH help!!! (48 replies) |
| Best safe towns for commute to Portsmouth NH (34 replies) |
| Moving to southeast NH, looking for suggestions (22 replies) |
| Yet Another Guy Looking to Relocate to Southern NH (27 replies) |
| Real estate and schools near the seacoast--input please! (13 replies) |

Household type by relationship:
Households: 114,722- In family households: 90,890 (20,423 male householders, 9,439 female householders)
22,797 spouses, 30,805 children (28,609 natural, 627 adopted, 1,569 stepchildren), 1,471 grandchildren, 649 brothers or sisters, 782 parents, foster children, 688 other relatives, 3,256 non-relatives
- In nonfamily households: 23,832 (8,241 male householders (5,585 living alone)), 8,997 female householders (6,782 living alone)), 6,594 nonrelatives
- In group quarters: 8,421 (993 institutionalized population)
18,381 married couples with children.
6,426 single-parent households (1,675 men, 4,751 women).
94.8% of residents of Madbury speak English at home.
1.0% of residents speak Spanish at home (33% speak English very well, 33% speak English well, 33% speak English not well).
3.7% of residents speak other Indo-European language at home (92% speak English very well, 4% speak English well, 4% speak English not well).
0.5% of residents speak Asian or Pacific Island language at home (43% speak English very well, 57% speak English well).
Foreign born population: 112 (6.3%)
(54.5% of them are naturalized citizens)
| Here: | 6.1 |
| State: | 6.4 |
| Here: | 4.9 |
| State: | 4.0 |

- Bedrooms in owner-occupied houses and condos in Madbury, New Hampshire
- 0no bedroom
- 51 bedroom
- 832 bedrooms
- 1713 bedrooms
- 1314 bedrooms
- 205+ bedrooms

- Bedrooms in renter-occupied apartments in Madbury, New Hampshire
- 3no bedroom
- 271 bedroom
- 502 bedrooms
- 343 bedrooms
- 24 bedrooms
- 85+ bedrooms

- Cars and other vehicles available in Madbury in owner-occupied houses/condos
- 8no vehicle
- 761 vehicle
- 2002 vehicles
- 1053 vehicles
- 114 vehicles
- 105+ vehicles

- Cars and other vehicles available in Madbury in renter-occupied apartments
- 9no vehicle
- 491 vehicle
- 442 vehicles
- 143 vehicles
- 84 vehicles
- 05+ vehicles

- Rooms in owner-occupied houses in Madbury, New Hampshire
- 01 room
- 22 rooms
- 63 rooms
- 364 rooms
- 555 rooms
- 746 rooms
- 947 rooms
- 798 rooms
- 649+ rooms

- Rooms in renter-occupied apartments in Madbury, New Hampshire
- 31 room
- 92 rooms
- 123 rooms
- 404 rooms
- 295 rooms
- 136 rooms
- 87 rooms
- 28 rooms
- 89+ rooms


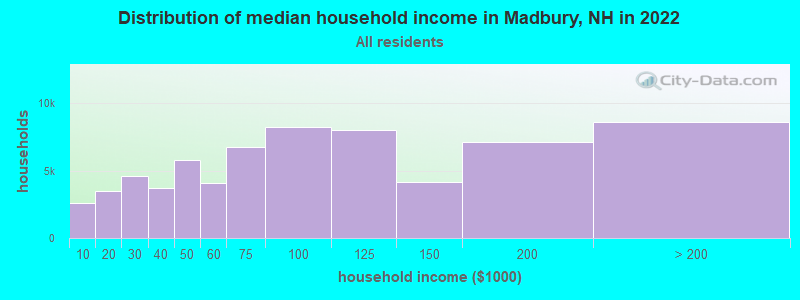
Madbury, NH household income distribution

- 2,557Less than $10,000
- 3,454$10,000 to $19,999
- 4,599$20,000 to $29,999
- 3,684$30,000 to $39,999
- 5,755$40,000 to $49,999
- 4,065$50,000 to $59,999
- 6,749$60,000 to $74,999
- 8,206$75,000 to $99,999
- 7,980$100,000 to $124,999
- 4,121$125,000 to $149,999
- 7,125$150,000 to $199,999
- 8,594$200,000 or more
Percentage of workers working in this county: 60.4%
Number of people working at home: 163 (17.5% of all workers)
Travel time to work (commute)
- Less than 5 minutes: 16
- 5 to 9 minutes: 72
- 10 to 14 minutes: 127
- 15 to 19 minutes: 187
- 20 to 24 minutes: 120
- 25 to 29 minutes: 48
- 30 to 34 minutes: 71
- 35 to 39 minutes: 3
- 40 to 44 minutes: 16
- 45 to 59 minutes: 30
- 60 to 89 minutes: 30
- 90 or more minutes: 24
Means of transportation to work:
- Drove a car alone: 652 (81.2%)
- Carpooled: 76 (9.5%)
- Bus or trolley bus: 2 (0.2%)
- Motorcycle: 1 (0.1%)
- Walked: 7 (0.9%)
- Other means: 6 (0.7%)
- Worked at home: 59 (7.3%)


- Year of entry for the foreign-born population in Madbury, New Hampshire
- 91995 to March 2000
- 211990 to 1994
- 21985 to 1989
- 41980 to 1984
- 71975 to 1979
- 71970 to 1974
- 61965 to 1969
- 9Before 1965

First ancestries reported:
- English: 349 (18.2%)
- Irish: 234 (12.2%)
- French: 195 (10.2%)
- German: 192 (10.0%)
- Other: 182 (9.5%)
- French Canadian: 170 (8.9%)
- Italian: 115 (6.0%)
- United States: 109 (5.7%)
- Scottish: 90 (4.7%)
- Polish: 56 (2.9%)
- Swedish: 49 (2.6%)
- Scotch-Irish: 31 (1.6%)
- Dutch: 19 (1.0%)
- Swiss: 18 (0.9%)
- Arab: 17 (0.9%)
- Welsh: 16 (0.8%)
- Norwegian: 13 (0.7%)
- Lithuanian: 12 (0.6%)
- Greek: 11 (0.6%)
- Subsaharan African: 9 (0.5%)
- Portuguese: 8 (0.4%)
- Russian: 8 (0.4%)
- Czech: 7 (0.4%)
- Ukrainian: 3 (0.2%)
- Danish: 2 (0.1%)
- Hungarian: 2 (0.1%)
Most common places of birth for foreign-born residents (%):
| Madbury: | 27.7% (18) |
| New Hampshire: | 22.9% (12,397) |
| Madbury: | 16.9% (11) |
| New Hampshire: | 8.1% (4,396) |
| Madbury: | 12.3% (8) |
| New Hampshire: | 0.9% (483) |
| Madbury: | 7.7% (5) |
| New Hampshire: | 4.7% (2,530) |
| Madbury: | 6.2% (4) |
| New Hampshire: | 0.7% (401) |
| Madbury: | 6.2% (4) |
| New Hampshire: | 0.9% (471) |
| Madbury: | 4.6% (3) |
| New Hampshire: | 4.9% (2,670) |
| Madbury: | 3.1% (2) |
| New Hampshire: | 0.6% (339) |
| Madbury: | 3.1% (2) |
| New Hampshire: | 1.5% (835) |
| Madbury: | 3.1% (2) |
| New Hampshire: | 1.7% (931) |
| Madbury: | 3.1% (2) |
| New Hampshire: | 0.9% (464) |
| Madbury: | 3.1% (2) |
| New Hampshire: | 0.2% (89) |
| Madbury: | 3.1% (2) |
| New Hampshire: | 0.1% (39) |
Place of birth for U.S.-born residents:
- This state: 666
- Other state: 764
- Northeast: 544
- Midwest: 88
- South: 80
- West: 52
64% of Madbury residents lived in the same house 5 years ago.
Out of people who lived in different houses, 44% lived in this county.
Out of people who lived in different counties, 41% lived in New Hampshire.
Education attainment for males 25 years and older:
- No schooling: 0
- Nursery to 4th grade: 0
- 5th and 6th grade: 0
- 7th and 8th grade: 7
- 9th grade: 2
- 10th grade: 14
- 11th grade: 15
- 12th grade, no diploma: 4
- High school graduate (or equivalency): 89
- Less than 1 year of college: 27
- Some college more than 1 year, no degree: 48
- Associate degree: 18
- Bachelor's degree: 112
- Master's degree: 81
- Professional school degree: 17
- Doctorate degree: 34

Education attainment for females 25 years and older:
- No schooling: 0
- Nursery to 4th grade: 0
- 5th and 6th grade: 0
- 7th and 8th grade: 3
- 9th grade: 10
- 10th grade: 8
- 11th grade: 7
- 12th grade, no diploma: 4
- High school graduate (or equivalency): 89
- Less than 1 year of college: 46
- Some college more than 1 year, no degree: 43
- Associate degree: 43
- Bachelor's degree: 160
- Master's degree: 67
- Professional school degree: 2
- Doctorate degree: 14


Housing units in structures:
- One, detached: 363
- One, attached: 34
- Two: 48
- 3 or 4: 20
- 5 to 9: 3
- 20 to 49: 3
- Mobile homes: 72
Median worth of mobile homes: $195,780

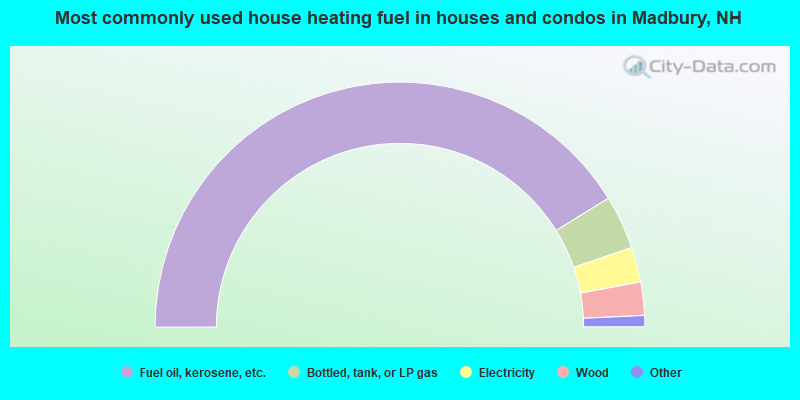
- 82.4%Fuel oil, kerosene, etc.
- 7.1%Bottled, tank, or LP gas
- 4.6%Electricity
- 4.4%Wood
- 1.0%Utility gas
- 0.5%Solar energy
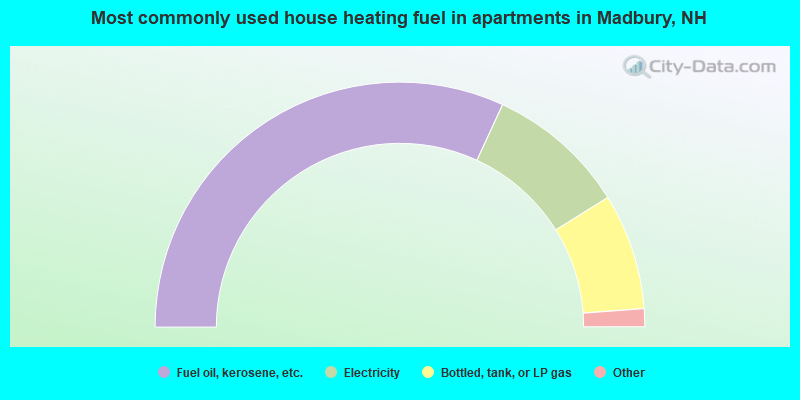
- 63.7%Fuel oil, kerosene, etc.
- 18.5%Electricity
- 15.3%Bottled, tank, or LP gas
- 1.6%Utility gas
- 0.8%Wood
Private vs. public school enrollment:
| Here: | 7.0% |
| New Hampshire: | 8.9% |
| Here: | 11.6% |
| New Hampshire: | 10.7% |
| Here: | 23.5% |
| New Hampshire: | 36.4% |


