Manchester, MO (Missouri) Houses and Residents
| Manchester: | $306,054 |
| Missouri: | $221,200 |
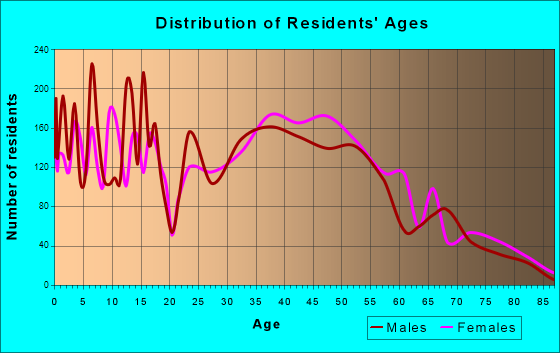
Total population: 18,197 (All urban)
Houses: 7,681 (7,457 occupied: 5,401 owner occupied, 2,039 renter occupied)
| % of renters here: | 27% |
| State: | 32% |
Housing density: 1,537 houses/condos per square mile
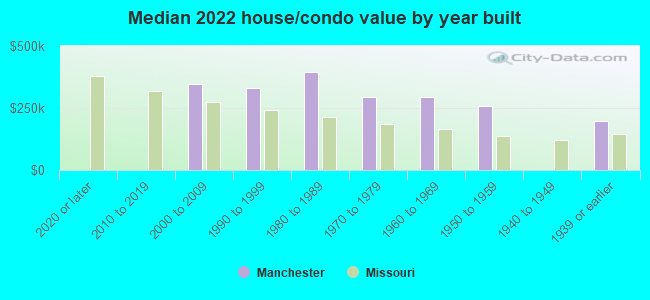
Median price asked for vacant for-sale houses and condos in 2022: $172,597.
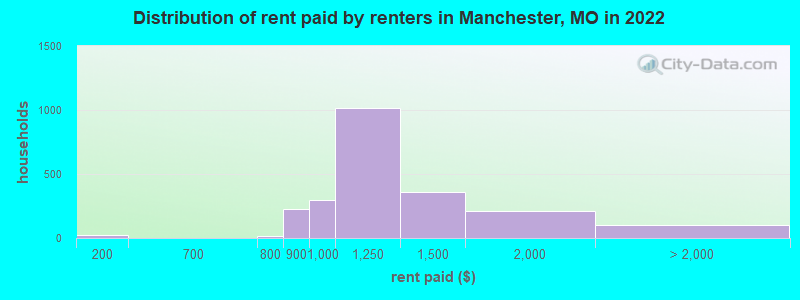
Median contract rent in 2022: $1,156 (lower quartile is $972, upper quartile is $1,296)
Median rent asked for vacant for-rent units in 2022: $3,346
Median gross rent in Manchester, MO in 2022: $1,253
Housing units in Manchester with a mortgage: 3,767 (466 second mortgage, 37 home equity loan, 359 both second mortgage and home equity loan)
Houses without a mortgage: 173
Median household income for houses/condos with a mortgage: $123,822
Median household income for apartments without a mortgage: $88,131
Median monthly housing costs: $1,341
Compare current foreclosures near Manchester, MO:
| Photo | Address | Area | Beds / Baths | Price | Details |
|---|---|---|---|---|---|

|
#1
Hodiamont Ave # E4
Saint Louis, MO 63112
|
1 sq. feet
|
2 baths 2 beds |
$167,000
|
show details |

|
#2
E Milton Ave
Saint Louis, MO 63114
|
1,325 sq. feet
|
1 baths 2 beds |
$184,900
|
show details |

|
#3
Ross Ave
Saint Louis, MO 63146
|
1,520 sq. feet
|
2 baths 3 beds |
$218,400
|
show details |

|
#4
Idaho Ave
Saint Louis, MO 63111
|
979 sq. feet
|
1 baths 2 beds |
$129,900
|
show details |

|
#5
Lilybud Ct
Ballwin, MO 63011
|
1,240 sq. feet
|
2 baths 3 beds |
$219,900
|
show details |

|
#6
Cunniff Pl
Saint Louis, MO 63135
|
1,596 sq. feet
|
1 baths 3 beds |
$84,900
|
show details |

|
#7
Sims Ave
Saint Louis, MO 63114
|
1,278 sq. feet
|
1 baths 3 beds |
$195,000
|
show details |

|
#8
Old State Route 21
Imperial, MO 63052
|
1,763 sq. feet
|
2 baths 3 beds |
$144,900
|
show details |

|
#9
Deer St
Saint Louis, MO 63113
|
1,646 sq. feet
|
1 baths 3 beds |
$250,000
|
show details |

|
#10
W Saint Anthony Ln
Florissant, MO 63031
|
1,224 sq. feet
|
1 baths 3 beds |
$207,000
|
show details |
| Photo | Address | Area | Beds / Baths | Price | Details |
|---|---|---|---|---|---|

|
#11
Burgen Ave
Saint Louis, MO 63116
|
960 sq. feet
|
1 baths 2 beds |
$83,200
|
show details |

|
#12
Mallet Hl
Ballwin, MO 63021
|
4,530 sq. feet
|
4 baths 5 beds |
$630,000
|
show details |

|
#13
Ridge Ave
Saint Louis, MO 63113
|
1,868 sq. feet
|
2 baths 6 beds |
$114,900
|
show details |

|
#14
Connor Rd
House Springs, MO 63051
|
1,076 sq. feet
|
2 baths 3 beds |
$224,900
|
show details |

|
#15
Rosewood Ave
Saint Louis, MO 63120
|
1,152 sq. feet
|
1 baths 2 beds |
$125,000
|
show details |

|
#16
Wesbriar Ct
Maryland Heights, MO 63043
|
1,046 sq. feet
|
1 baths 3 beds |
$285,000
|
show details |

|
#17
Hannover Ave
Saint Louis, MO 63123
|
912 sq. feet
|
1 baths 2 beds |
$159,900
|
show details |

|
#18
Louisiana Ave
Saint Louis, MO 63118
|
2,360 sq. feet
|
2 baths 2 beds |
$187,000
|
show details |

|
#19
Marshall Ave
Saint Louis, MO 63114
|
- sq. feet
|
1 baths 2 beds |
$62,400
|
show details |

|
#20
Hamilton Ave
Saint Louis, MO 63136
|
832 sq. feet
|
1 baths 2 beds |
$17,900
|
show details |
| Photo | Address | Area | Beds / Baths | Price | Details |
|---|---|---|---|---|---|

|
#21
Oregon Ave
Saint Louis, MO 63118
|
1,782 sq. feet
|
2 baths - beds |
$12,000
|
show details |

|
#22
Grover St
Saint Louis, MO 63112
|
792 sq. feet
|
1 baths - beds |
$12,000
|
show details |

|
#23
Canyonlands Dr Apt C
Maryland Heights, MO 63043
|
978 sq. feet
|
2 baths 2 beds |
show details | |

|
#24
Summit Pl
Saint Louis, MO 63136
|
1,039 sq. feet
|
1 baths - beds |
$15,900
|
show details |

|
#25
Northland Pl
Saint Louis, MO 63113
|
1,736 sq. feet
|
1 baths - beds |
$23,900
|
show details |

|
#26
Paris Ave
Saint Louis, MO 63115
|
1,650 sq. feet
|
1 baths - beds |
$24,900
|
show details |

|
#27
Driftwood Trails Dr
Florissant, MO 63031
|
1,283 sq. feet
|
2 baths 3 beds |
show details | |

|
#28
Gilead Dr
Cedar Hill, MO 63016
|
1,716 sq. feet
|
2 baths 3 beds |
show details | |

|
#29
Dale Ave
Saint Louis, MO 63139
|
900 sq. feet
|
1 baths 2 beds |
show details | |

|
#30
Shadow Wood Dr
Saint Charles, MO 63303
|
1,064 sq. feet
|
2 baths 3 beds |
show details |
| Photo | Address | Area | Beds / Baths | Price | Details |
|---|---|---|---|---|---|

|
#31
Mclaran Ave
Saint Louis, MO 63136
|
988 sq. feet
|
1 baths 3 beds |
show details | |

|
#32
Westminster Pl
Saint Louis, MO 63112
|
1,974 sq. feet
|
3 baths 4 beds |
show details | |

|
#33
Oak Hill Ct
Saint Peters, MO 63376
|
1,168 sq. feet
|
2 baths 3 beds |
show details | |

|
#34
Highway Dd
Defiance, MO 63341
|
1,272 sq. feet
|
1 baths 3 beds |
show details | |

|
#35
Olive St
Saint Charles, MO 63301
|
- sq. feet
|
1 baths 2 beds |
show details | |

|
#36
Bordeaux Way
Saint Peters, MO 63376
|
1,254 sq. feet
|
2 baths 2 beds |
show details | |

|
#37
Juniata St
Saint Louis, MO 63139
|
1,050 sq. feet
|
1 baths 2 beds |
show details | |

|
#38
Ridgeview Ct
Saint Charles, MO 63301
|
1,307 sq. feet
|
2 baths 3 beds |
show details | |

|
#39
Benton Taylor Dr
Chesterfield, MO 63005
|
4,708 sq. feet
|
3 baths 4 beds |
show details | |

|
#40
Glandore Dr
Ballwin, MO 63021
|
1,456 sq. feet
|
2 baths 3 beds |
show details |
| Photo | Address | Area | Beds / Baths | Price | Details |
|---|---|---|---|---|---|

|
#41
Ridgeview Dr
Saint Louis, MO 63121
|
2,100 sq. feet
|
1 baths 3 beds |
show details | |

|
#42
Butler Dr
Eureka, MO 63025
|
966 sq. feet
|
1 baths 3 beds |
show details | |

|
#43
Hord Ave
Saint Louis, MO 63136
|
800 sq. feet
|
1 baths 2 beds |
show details | |

|
#44
Naples Dr
Hazelwood, MO 63042
|
1,032 sq. feet
|
2 baths 3 beds |
show details | |

|
#45
Mora Ln
Saint Louis, MO 63147
|
1,084 sq. feet
|
1 baths 2 beds |
show details | |

|
#46
Florissant Rd
Saint Louis, MO 63121
|
1,032 sq. feet
|
2 baths 4 beds |
show details | |

|
#47
Richard Ave
Saint Louis, MO 63132
|
1,064 sq. feet
|
1 baths 3 beds |
show details | |

|
#48
Orchid Blossom Ct
Saint Peters, MO 63376
|
- sq. feet
|
2 baths 3 beds |
show details | |

|
#49
Switzer Ave
Saint Louis, MO 63147
|
1,610 sq. feet
|
1 baths 3 beds |
show details | |

|
Check over 1 million property listings on Foreclosure.com!
|
browse all offers | |||

Latest news about housing in Manchester, MO collected exclusively by city-data.com from local newspapers, TV, and radio stations


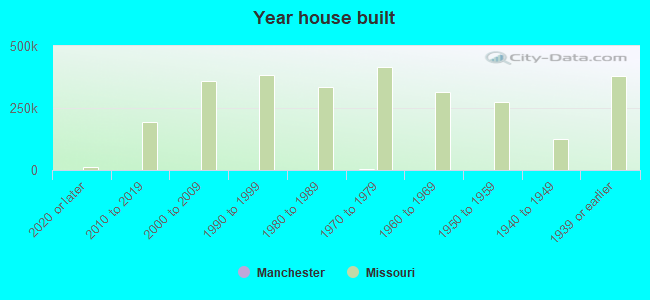
Median year apartment built: 1983
Household type by relationship:
Households: 18,070- Male householders: 3,924 (919 living alone), Female householders: 3,446 (1,143 living alone)
4,122 spouses (4,084 opposite-sex spouses), 195 unmarried partners, (195 opposite-sex unmarried partners), 5,488 children (5,328 natural, 48 adopted, 111 stepchildren), 135 grandchildren, 82 brothers or sisters, 203 parents, 21 foster children, 46 other relatives, 397 non-relatives
- In group quarters: 6
Size of family households: 1,846 2-persons, 1,354 3-persons, 1,257 4-persons, 296 5-persons, 121 6-persons, 10 7-or-more-persons.
Size of nonfamily households: 2,040 1-person, 428 2-persons, 17 3-persons, 5 5-persons.
3,832 married couples with children.
404 single-parent households (160 men, 244 women).
82.8% of residents of Manchester speak English at home.
1.6% of residents speak Spanish at home (81% speak English very well, 18% speak English well, 1% speak English not well).
8.1% of residents speak other Indo-European language at home (91% speak English very well, 3% speak English well, 5% speak English not well, 1% don't speak English at all).
4.4% of residents speak Asian or Pacific Island language at home (82% speak English very well, 16% speak English well, 2% speak English not well).
3.4% of residents speak other language at home (82% speak English very well, 13% speak English well, 3% speak English not well, 3% don't speak English at all).
Foreign born population: 2,209 (12.2%)
(67.3% of them are naturalized citizens)
| Here: | 7.2 |
| State: | 6.4 |
| Here: | 4.0 |
| State: | 4.4 |
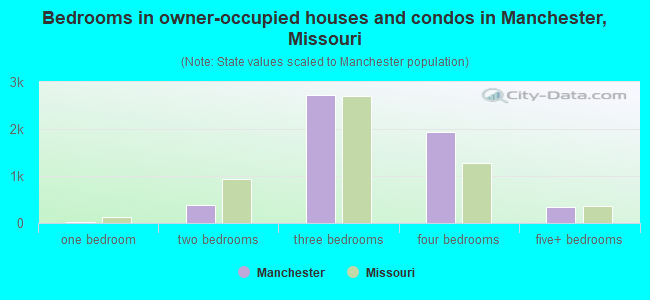
- Bedrooms in owner-occupied houses and condos in Manchester, Missouri
- 0no bedroom
- 131 bedroom
- 3842 bedrooms
- 2,7213 bedrooms
- 1,9404 bedrooms
- 3435+ bedrooms
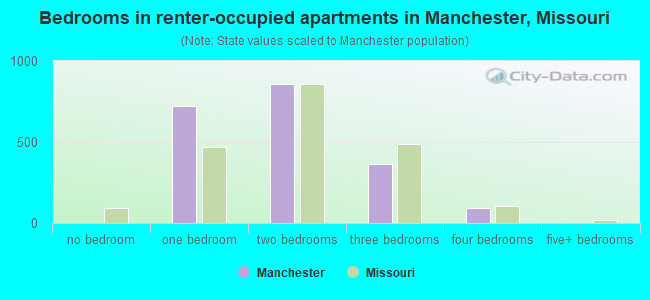
- Bedrooms in renter-occupied apartments in Manchester, Missouri
- 0no bedroom
- 7241 bedroom
- 8592 bedrooms
- 3623 bedrooms
- 944 bedrooms
- 05+ bedrooms
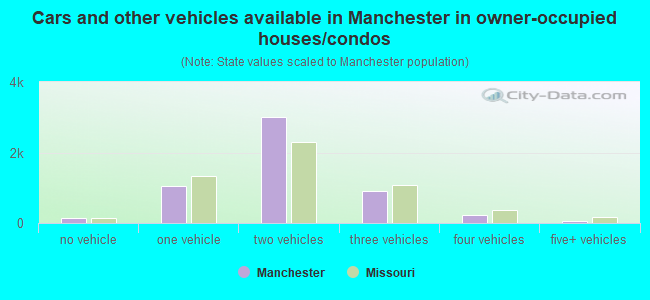
- Cars and other vehicles available in Manchester in owner-occupied houses/condos
- 144no vehicle
- 1,0631 vehicle
- 2,9972 vehicles
- 9033 vehicles
- 2384 vehicles
- 565+ vehicles
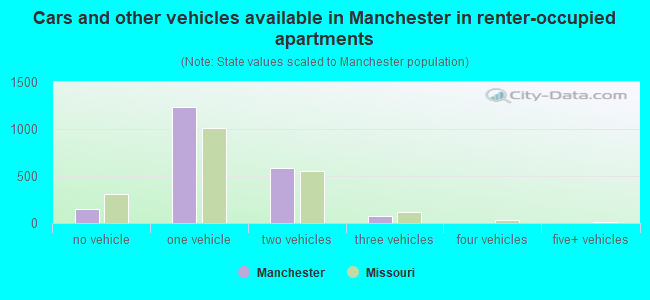
- Cars and other vehicles available in Manchester in renter-occupied apartments
- 146no vehicle
- 1,2341 vehicle
- 5892 vehicles
- 703 vehicles
- 04 vehicles
- 05+ vehicles
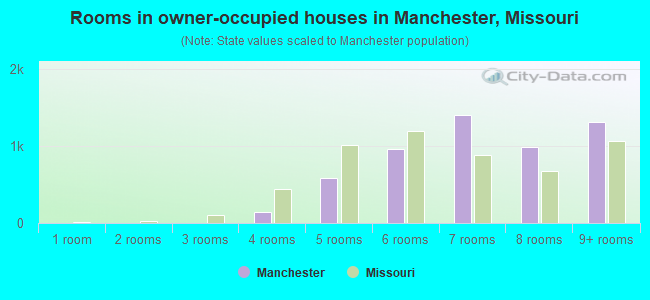
- Rooms in owner-occupied houses in Manchester, Missouri
- 01 room
- 02 rooms
- 03 rooms
- 1494 rooms
- 5895 rooms
- 9636 rooms
- 1,4027 rooms
- 9938 rooms
- 1,3059+ rooms
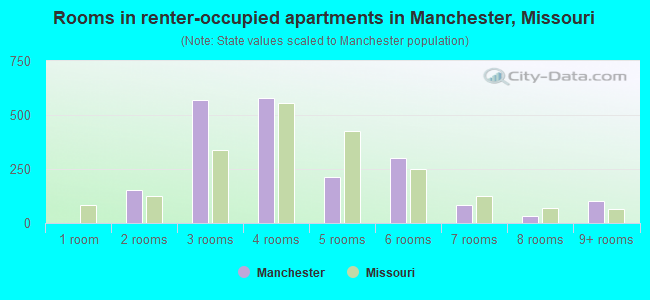
- Rooms in renter-occupied apartments in Manchester, Missouri
- 01 room
- 1552 rooms
- 5693 rooms
- 5804 rooms
- 2155 rooms
- 3026 rooms
- 847 rooms
- 348 rooms
- 1009+ rooms
Manchester, MO household income distribution

- 249Less than $10,000
- 319$10,000 to $19,999
- 459$20,000 to $29,999
- 519$30,000 to $39,999
- 341$40,000 to $49,999
- 505$50,000 to $59,999
- 652$60,000 to $74,999
- 877$75,000 to $99,999
- 810$100,000 to $124,999
- 722$125,000 to $149,999
- 1,207$150,000 to $199,999
- 817$200,000 or more

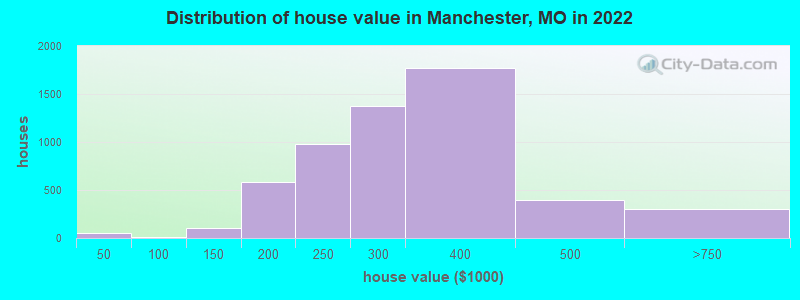
Home value of owner - occupied houses in 2022 in Manchester, MO
-
- 34Less than $10,000
- 12$40,000 to $49,999
- 21$100,000 to $124,999
- 77$125,000 to $149,999
- 142$150,000 to $174,999
- 444$175,000 to $199,999
- 976$200,000 to $249,999
- 1,374$250,000 to $299,999
- 1,776$300,000 to $399,999
- 399$400,000 to $499,999
- 291$500,000 to $749,999
- 14$750,000 to $999,999
Rent paid by renters in 2022 in Manchester, MO
-
- 26$150 to $199
- 13$750 to $799
- 223$800 to $899
- 298$900 to $999
- 1,017$1,000 to $1,249
- 356$1,250 to $1,499
- 207$1,500 to $1,999
- 12$2,000 to $2,499
- 85No cash rent
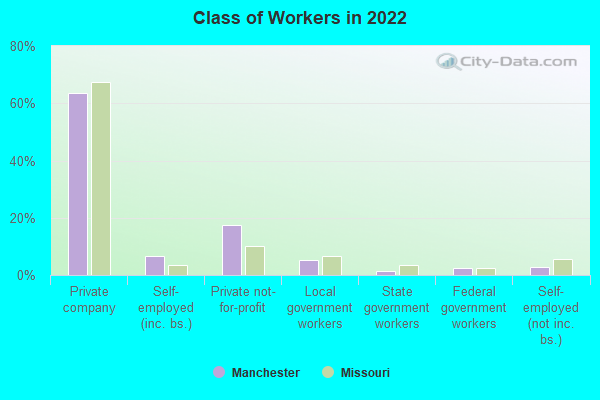
Percentage of workers working in this county: 80.9%
Number of people working at home: 2,205 (23.8% of all workers)
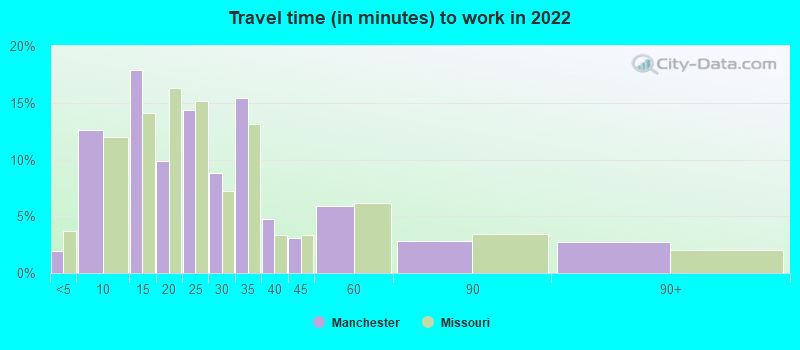
Travel time to work (commute)
- Less than 5 minutes: 160
- 5 to 9 minutes: 699
- 10 to 14 minutes: 1,152
- 15 to 19 minutes: 946
- 20 to 24 minutes: 1,396
- 25 to 29 minutes: 1,016
- 30 to 34 minutes: 970
- 35 to 39 minutes: 327
- 40 to 44 minutes: 268
- 45 to 59 minutes: 126
- 60 to 89 minutes: 96
- 90 or more minutes: 21
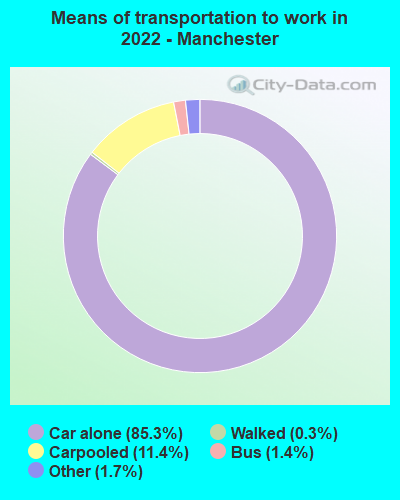
Means of transportation to work:
- Drove a car alone: 4,184 (61.8%)
- Carpooled: 530 (7.8%)
- Bus: 66 (1.0%)
- Taxi: 77 (1.1%)
- Walked: 17 (0.3%)
- Worked at home: 2,205 (32.6%)
- Unemployment by race in 2022
- Unemployment rate for White non-Hispanic residents
- 2.8%Males
- 1.8%Females
- Unemployment rate for Black residents
- 10.7%Males
- 21.1%Females
- Unemployment rate for two or more race residents
- 4.8%Males
- 2.0%Females
- Unemployment rate for Hispanic or Latino residents
- 2.5%Females
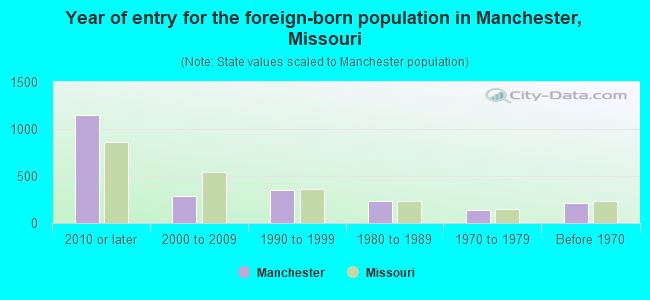
- Year of entry for the foreign-born population in Manchester, Missouri
- 1,1532010 or later
- 2912000 to 2009
- 3481990 to 1999
- 2391980 to 1989
- 1331970 to 1979
- 217Before 1970
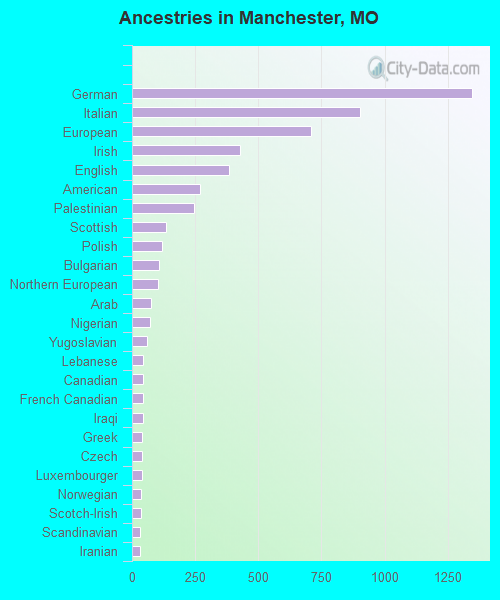
First ancestries reported:
- German: 1,346 (16.3%)
- Italian: 904 (10.9%)
- European: 710 (8.6%)
- Irish: 428 (5.2%)
- English: 385 (4.7%)
- American: 269 (3.2%)
- Palestinian: 245 (3.0%)
- Scottish: 135 (1.6%)
- Polish: 119 (1.4%)
- Bulgarian: 106 (1.3%)
- Northern European: 103 (1.2%)
- Arab: 75 (0.9%)
- Nigerian: 72 (0.9%)
- Yugoslavian: 58 (0.7%)
- Lebanese: 45 (0.5%)
- Canadian: 45 (0.5%)
- French Canadian: 45 (0.5%)
- Iraqi: 42 (0.5%)
- Greek: 40 (0.5%)
- Czech: 40 (0.5%)
- Luxembourger: 39 (0.5%)
- Norwegian: 37 (0.4%)
- Scotch-Irish: 37 (0.4%)
- Scandinavian: 33 (0.4%)
- Iranian: 31 (0.4%)
- Welsh: 31 (0.4%)
- Swedish: 26 (0.3%)
- Eastern European: 25 (0.3%)
- French: 24 (0.3%)
- Dutch: 22 (0.3%)
- Ghanaian: 22 (0.3%)
- Danish: 17 (0.2%)
- Moroccan: 16 (0.2%)
- Austrian: 16 (0.2%)
- Australian: 10 (0.1%)
- British: 10 (0.1%)
- Finnish: 9 (0.1%)
- Russian: 7 (0.08%)
Most common places of birth for foreign-born residents (%):
| Manchester: | 30.3% (660) |
| Missouri: | 8.9% (22,932) |
| Manchester: | 16.7% (365) |
| Missouri: | 1.2% (3,209) |
| Manchester: | 6.9% (151) |
| Missouri: | 0.2% (582) |
| Manchester: | 6.1% (132) |
| Missouri: | 6.6% (17,002) |
| Manchester: | 4.9% (106) |
| Missouri: | 2.9% (7,525) |
| Manchester: | 3.9% (85) |
| Missouri: | 0.2% (494) |
| Manchester: | 3.7% (81) |
| Missouri: | 0.2% (406) |
| Manchester: | 3.5% (76) |
| Missouri: | 4.2% (10,873) |
| Manchester: | 3.2% (69) |
| Missouri: | 0.3% (664) |
| Manchester: | 2.8% (60) |
| Missouri: | 1.9% (4,806) |
| Manchester: | 2.7% (59) |
| Missouri: | 4.1% (10,700) |
| Manchester: | 2.2% (47) |
| Missouri: | 1.4% (3,640) |
Place of birth for U.S.-born residents:
- This state: 11,048
- Other state: 4,696
- Northeast: 709
- Midwest: 1,859
- South: 1,262
- West: 906
90.7% of Manchester residents lived in the same house 1 years ago.
Out of people who lived in different houses, 41.0% lived in this county.
Out of people who lived in different counties, 37.6% lived in Missouri.
| Manchester: | 90.7% |
| State average: | 87.1% |
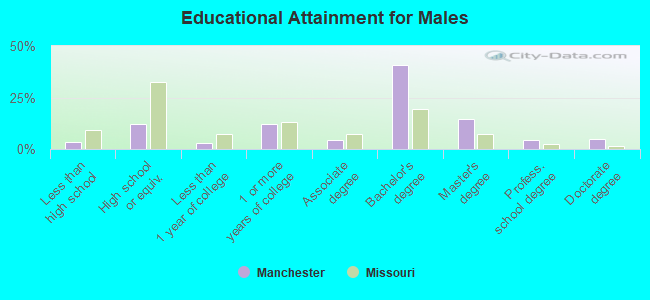
Education attainment for males 25 years and older:
- No schooling: 23
- Nursery to 4th grade: 33
- 5th and 6th grade: 14
- 7th and 8th grade: 36
- 9th grade: 4
- 10th grade: 0
- 11th grade: 20
- 12th grade, no diploma: 92
- High school graduate (or equivalency): 770
- Less than 1 year of college: 198
- Some college more than 1 year, no degree: 767
- Associate degree: 286
- Bachelor's degree: 2,558
- Master's degree: 928
- Professional school degree: 262
- Doctorate degree: 294
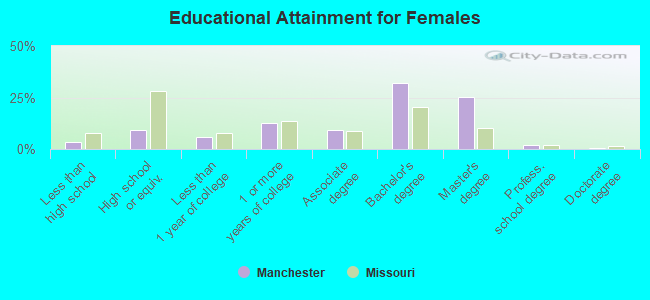
Education attainment for females 25 years and older:
- No schooling: 15
- Nursery to 4th grade: 14
- 5th and 6th grade: 13
- 7th and 8th grade: 9
- 9th grade: 71
- 10th grade: 0
- 11th grade: 55
- 12th grade, no diploma: 42
- High school graduate (or equivalency): 583
- Less than 1 year of college: 380
- Some college more than 1 year, no degree: 804
- Associate degree: 579
- Bachelor's degree: 2,052
- Master's degree: 1,626
- Professional school degree: 134
- Doctorate degree: 40
Housing units in structures:
- One, detached: 5,443
- One, attached: 429
- 3 or 4: 110
- 5 to 9: 533
- 10 to 19: 1,027
- 20 to 49: 37
- 50 or more: 100
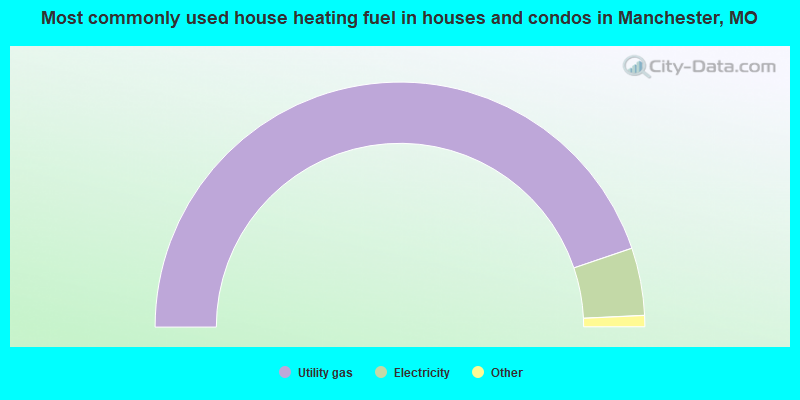
- 89.6%Utility gas
- 8.9%Electricity
- 1.2%Bottled, tank, or LP gas
- 0.3%Fuel oil, kerosene, etc.
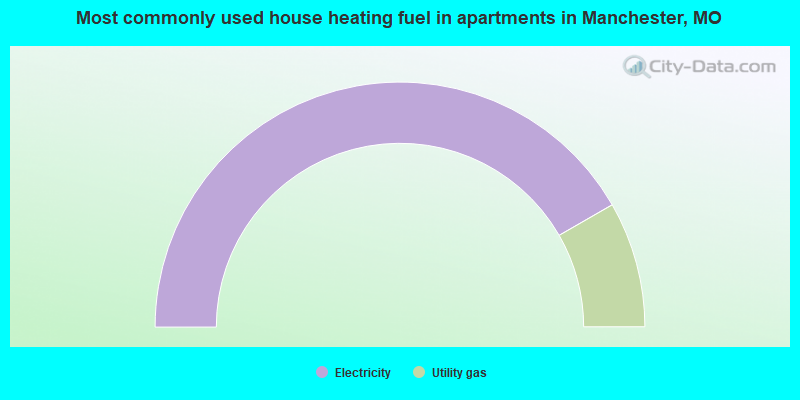
- 83.4%Electricity
- 16.6%Utility gas
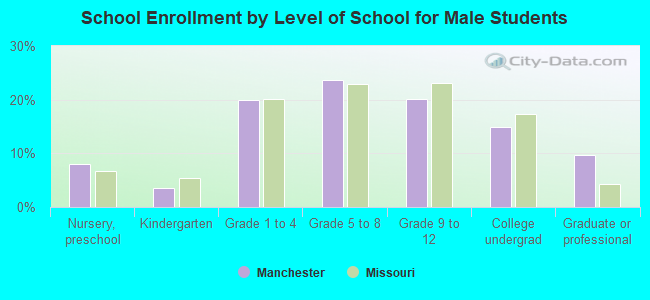
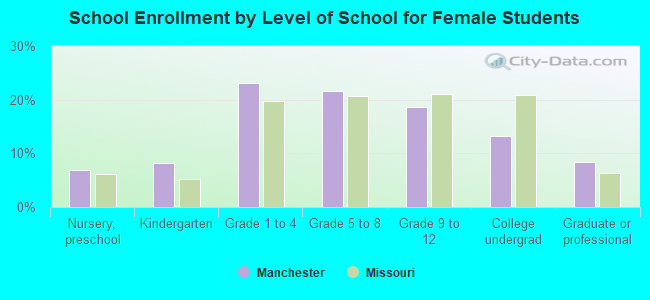
Private vs. public school enrollment:
| Here: | 13.6% |
| Missouri: | 15.4% |
| Here: | 15.7% |
| Missouri: | 13.9% |
| Here: | 18.3% |
| Missouri: | 22.6% |