Jump to a detailed profile or search site with Google Custom Search

Maryland, NY (New York) Houses and Residents

Estimated median house or condo value in 2022: $160,502 (it was $68,800 in 2000)
Maryland:

$160,502
New York:

$400,400
Lower value quartile - upper value quartile: $97,557 - $213,545

Total population: 1,897 (Urban population: 0, Rural population: 1,920 (38 farm, 1,882 nonfarm))

Houses: 1,035 (773 occupied: 602 owner occupied, 171 renter occupied)

% of renters here:

22%
State:

46%

Housing density: 20 houses/condos per square mile

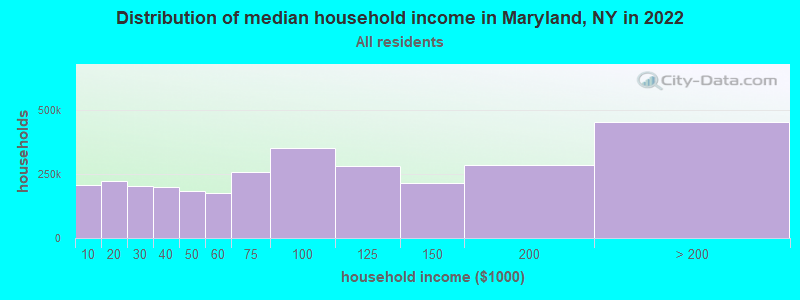
Median price asked for vacant for-sale houses and condos in 2022 in this county: $227,166.

Median contract rent in 2022: $670 (lower quartile is $515, upper quartile is $863)


Median rent asked for vacant for-rent units in 2022: $710


Median gross rent in Maryland, NY in 2022: $857

Housing units in Maryland with a mortgage: 225 (21 second mortgage, 24 home equity loan, 0 both second mortgage and home equity loan)
Houses without a mortgage: 128

Compare current foreclosures near Maryland, NY:

Check out more offers near Maryland, NY.
Powered by Foreclosure.com


Latest news about housing in Maryland, NY collected exclusively by city-data.com from local newspapers, TV, and radio stations

Maryland, New York Age and Sex of Residents

Household type by relationship:

Households: 56,939
  • In family households: 44,261 (10,543 male householders, 4,515 female householders)
    11,641 spouses, 13,962 children (12,887 natural, 358 adopted, 717 stepchildren), 819 grandchildren, 298 brothers or sisters, 351 parents, foster children, 375 other relatives, 1,530 non-relatives
  • In nonfamily households: 12,678 (4,443 male householders (3,175 living alone)), 5,119 female householders (4,064 living alone)), 3,116 nonrelatives
  • In group quarters: 5,320 (556 institutionalized population)

9,340 married couples with children.
3,333 single-parent households (998 men, 2,335 women).

94.9% of residents of Maryland speak English at home.
2.6% of residents speak Spanish at home (68% speak English very well, 13% speak English well, 19% speak English not well).
2.3% of residents speak other Indo-European language at home (57% speak English very well, 24% speak English well, 19% speak English not well).
0.2% of residents speak other language at home (50% speak English very well, 50% speak English not well).

Foreign born population: 78 (3.8%)
(57.7% of them are naturalized citizens)

Median number of rooms in houses and condos:
Here:

6.7
State:

6.3

Median number of rooms in apartments
Here:

4.6
State:

3.8

Owner-occupied Renter-occupied
Bedrooms in owner-occupied houses and condos in Maryland, New York
  • Bedrooms in owner-occupied houses and condos in Maryland, New York
  • 3no bedroom
  • 401 bedroom
  • 1122 bedrooms
  • 2853 bedrooms
  • 1204 bedrooms
  • 425+ bedrooms
Bedrooms in renter-occupied apartments in Maryland, New York
  • Bedrooms in renter-occupied apartments in Maryland, New York
  • 10no bedroom
  • 361 bedroom
  • 522 bedrooms
  • 463 bedrooms
  • 194 bedrooms
  • 85+ bedrooms
Owner-occupied Renter-occupied
Cars and other vehicles available in Maryland in owner-occupied houses/condos
  • Cars and other vehicles available in Maryland in owner-occupied houses/condos
  • 13no vehicle
  • 1491 vehicle
  • 3112 vehicles
  • 1113 vehicles
  • 144 vehicles
  • 45+ vehicles
Cars and other vehicles available in Maryland in renter-occupied apartments
  • Cars and other vehicles available in Maryland in renter-occupied apartments
  • 31no vehicle
  • 701 vehicle
  • 582 vehicles
  • 103 vehicles
  • 04 vehicles
  • 25+ vehicles
Owner-occupied Renter-occupied
Rooms in owner-occupied houses in Maryland, New York
  • Rooms in owner-occupied houses in Maryland, New York
  • 31 room
  • 92 rooms
  • 123 rooms
  • 614 rooms
  • 1235 rooms
  • 1256 rooms
  • 1007 rooms
  • 888 rooms
  • 819+ rooms
Rooms in renter-occupied apartments in Maryland, New York
  • Rooms in renter-occupied apartments in Maryland, New York
  • 51 room
  • 162 rooms
  • 173 rooms
  • 454 rooms
  • 285 rooms
  • 246 rooms
  • 157 rooms
  • 28 rooms
  • 199+ rooms
Year house built
Breakdown of mean house values by ages of householders
Owners and renters by unit type in Maryland, NY
  • Maryland, NY household income distribution

  • Distribution of median household income in Maryland, NY in 2022
  • 33,769Less than $10,000
  • 49,851$10,000 to $19,999
  • 50,504$20,000 to $29,999
  • 54,484$30,000 to $39,999
  • 54,847$40,000 to $49,999
  • 53,696$50,000 to $59,999
  • 79,499$60,000 to $74,999
  • 109,697$75,000 to $99,999
  • 86,399$100,000 to $124,999
  • 62,542$125,000 to $149,999
  • 71,312$150,000 to $199,999
  • 82,953$200,000 or more

Percentage of workers working in this county: 81.9%
Number of people working at home: 114 (12.0% of all workers)

Travel time to work (commute)

  • Less than 5 minutes: 38
  • 5 to 9 minutes: 56
  • 10 to 14 minutes: 82
  • 15 to 19 minutes: 108
  • 20 to 24 minutes: 225
  • 25 to 29 minutes: 73
  • 30 to 34 minutes: 125
  • 35 to 39 minutes: 19
  • 40 to 44 minutes: 17
  • 45 to 59 minutes: 30
  • 60 to 89 minutes: 46
  • 90 or more minutes: 22

Means of transportation to work:

  • Drove a car alone: 682 (76.7%)
  • Carpooled: 130 (14.6%)
  • Bus or trolley bus: 7 (0.8%)
  • Subway or elevated: 2 (0.2%)
  • Walked: 20 (2.2%)
  • Worked at home: 48 (5.4%)
Class of Workers in 2000
Year of entry for the foreign-born population in Maryland, New York
  • Year of entry for the foreign-born population in Maryland, New York
  • 21995 to March 2000
  • 01990 to 1994
  • 01985 to 1989
  • 91980 to 1984
  • 91975 to 1979
  • 01970 to 1974
  • 21965 to 1969
  • 29Before 1965
Ancestries in Maryland, NY

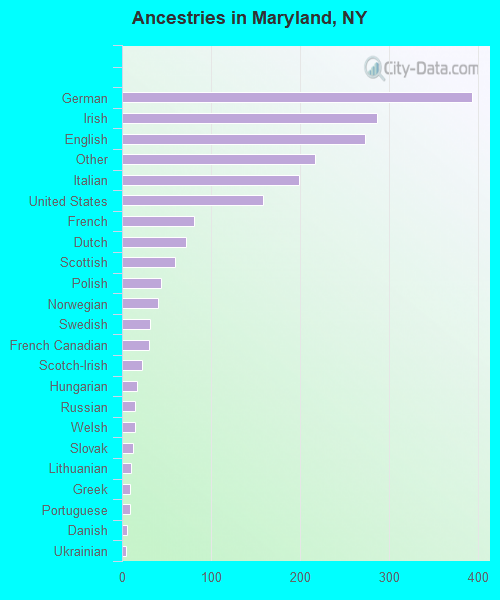
First ancestries reported:

  • German: 393 (19.5%)
  • Irish: 287 (14.3%)
  • English: 273 (13.6%)
  • Other: 217 (10.8%)
  • Italian: 199 (9.9%)
  • United States: 158 (7.9%)
  • French: 81 (4.0%)
  • Dutch: 72 (3.6%)
  • Scottish: 60 (3.0%)
  • Polish: 44 (2.2%)
  • Norwegian: 41 (2.0%)
  • Swedish: 32 (1.6%)
  • French Canadian: 30 (1.5%)
  • Scotch-Irish: 22 (1.1%)
  • Hungarian: 17 (0.8%)
  • Russian: 15 (0.7%)
  • Welsh: 15 (0.7%)
  • Slovak: 12 (0.6%)
  • Lithuanian: 10 (0.5%)
  • Greek: 9 (0.4%)
  • Portuguese: 9 (0.4%)
  • Danish: 6 (0.3%)
  • Ukrainian: 5 (0.2%)
  • Czech: 2 (0.10%)
  • Swiss: 2 (0.10%)

Most common places of birth for foreign-born residents (%):

Canada
Maryland:

21.6% (11)
New York:

1.4% (54,876)

Hungary
Maryland:

15.7% (8)
New York:

0.4% (17,401)

Italy
Maryland:

13.7% (7)
New York:

3.8% (147,729)

Germany
Maryland:

9.8% (5)
New York:

1.8% (69,327)

Portugal
Maryland:

7.8% (4)
New York:

0.3% (13,508)

Turkey
Maryland:

7.8% (4)
New York:

0.4% (16,228)

United Kingdom
Maryland:

3.9% (2)
New York:

1.6% (62,237)

Ireland
Maryland:

3.9% (2)
New York:

1.1% (41,934)

Other Western Europe
Maryland:

3.9% (2)
New York:

0.3% (10,672)

Czechoslovakia (includes Czech Republic and Slovakia)
Maryland:

3.9% (2)
New York:

0.3% (13,246)

Philippines
Maryland:

3.9% (2)
New York:

1.9% (72,408)

Trinidad and Tobago
Maryland:

3.9% (2)
New York:

2.5% (98,473)

Place of birth for U.S.-born residents:

  • This state: 1,578
  • Other state: 273
  • Northeast: 165
  • Midwest: 31
  • South: 55
  • West: 22

63% of Maryland residents lived in the same house 5 years ago.
   Out of people who lived in different houses, 64% lived in this county.
   Out of people who lived in different counties, 79% lived in New York.

Education attainment for males 25 years and older:

  • No schooling: 8
  • Nursery to 4th grade: 4
  • 5th and 6th grade: 9
  • 7th and 8th grade: 19
  • 9th grade: 14
  • 10th grade: 33
  • 11th grade: 28
  • 12th grade, no diploma: 32
  • High school graduate (or equivalency): 261
  • Less than 1 year of college: 39
  • Some college more than 1 year, no degree: 72
  • Associate degree: 59
  • Bachelor's degree: 46
  • Master's degree: 33
  • Professional school degree: 0
  • Doctorate degree: 2
Educational Attainment for Males

Education attainment for females 25 years and older:

  • No schooling: 8
  • Nursery to 4th grade: 2
  • 5th and 6th grade: 8
  • 7th and 8th grade: 9
  • 9th grade: 10
  • 10th grade: 12
  • 11th grade: 22
  • 12th grade, no diploma: 16
  • High school graduate (or equivalency): 279
  • Less than 1 year of college: 40
  • Some college more than 1 year, no degree: 77
  • Associate degree: 55
  • Bachelor's degree: 84
  • Master's degree: 30
  • Professional school degree: 7
  • Doctorate degree: 4
Educational Attainment for Females
Maryland marital status for males
Maryland marital status for females

Housing units in structures:

  • One, detached: 679
  • One, attached: 13
  • Two: 38
  • 3 or 4: 30
  • 5 to 9: 21
  • 10 to 19: 8
  • Mobile homes: 246

Median worth of mobile homes: $60,600

Housing units lacking complete plumbing facilities: 3.2%

Housing units lacking complete kitchen facilities: 3.9%
Year householders moved into residence in Maryland
Houses and condos Apartments
Most commonly used house heating fuel in houses and condos in Maryland, NY
  • 67.8%Fuel oil, kerosene, etc.
  • 14.6%Wood
  • 11.6%Bottled, tank, or LP gas
  • 5.0%Electricity
  • 0.7%Other fuel
  • 0.3%Utility gas
Most commonly used house heating fuel in apartments in Maryland, NY
  • 63.2%Fuel oil, kerosene, etc.
  • 16.4%Bottled, tank, or LP gas
  • 16.4%Electricity
  • 4.1%Wood

Private vs. public school enrollment:

Students in private schools in grades 1 to 8 (elementary and middle school): 9
Here:

3.9%
New York:

14.0%

Students in private schools in grades 9 to 12 (high school): 5
Here:

4.5%
New York:

13.2%

Students in private undergraduate colleges: 11
Here:

19.3%
New York:

38.2%
School Enrollment by Level of School for Male Students
School Enrollment by Level of School for Female Students
Age and Sex of Sensory-Disabled Noninstitutionalized Residents
Age and Sex of Physically-Disabled Noninstitutionalized Residents
Age and Sex of Mentally-Disabled Noninstitutionalized Residents
Age and Sex of Self-Care Disabled Noninstitutionalized Residents
Age and Sex of Go-Outside-Home Disabled Noninstitutionalized Residents
Age and Sex of Noninstitutionalized Residents with Employment Disability