Marysville, WA (Washington) Houses and Residents
Estimated median house or condo value in 2022: $586,800 (it was $169,100 in 2000 )
Marysville:
$586,800Washington:
$569,500
Lower value quartile - upper value quartile: $456,700 - $699,400Mean price in 2022: Detached houses: $584,529 Here:
$584,529State:
$734,307
Townhouses or other attached units: $527,185 Here:
$527,185State:
$657,697
In 2-unit structures: $408,164 Here:
$408,164State:
$534,634
In 3-to-4-unit structures: $371,641 Here:
$371,641State:
$510,239
In 5-or-more-unit structures: $498,960 Here:
$498,960State:
$503,183
Mobile homes: $232,807 Here:
$232,807State:
$218,362
Occupied boats, RVs, vans, etc.: $87,937 Here:
$87,937State:
$159,523
Total population: 65,087 (Urban population: 24,990, Rural population: 231 (16 farm, 215 nonfarm ))
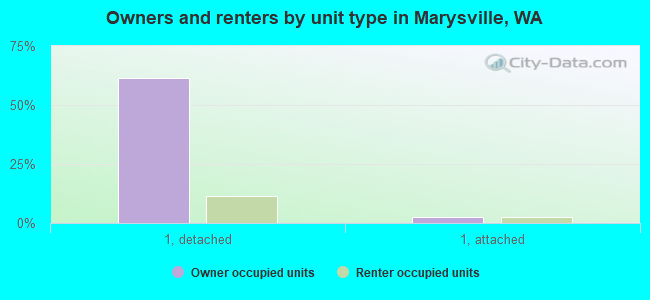
Houses: 26,216 (24,757 occupied: 18,195 owner occupied, 6,562 renter occupied )
% of renters here:
27%State:
36%
Housing density: 2,734 houses/condos per square mile
Median price asked for vacant for-sale houses and condos in 2022: $609,228.
Median contract rent in 2022: $1,878 (lower quartile is $1,506, upper quartile is over $2,000)
Median rent asked for vacant for-rent units in 2022: $1,672
Median gross rent in Marysville, WA in 2022: over $2,000
Housing units in Marysville with a mortgage: 13,318 (1,026 second mortgage, 0 home equity loan, 662 both second mortgage and home equity loan )Houses without a mortgage: 176
Median household income for houses/condos with a mortgage: $121,441
Median household income for apartments without a mortgage: $97,595
Median monthly housing costs: $2,043
Data:
Median house or condo value ($)
Median house or condo value ($ change since 2000)
Median house or condo value ($) - White
Median house or condo value ($) - Black or African American
Median house or condo value ($) - Asian
Median house or condo value ($) - Hispanic or Latino
Median house or condo value ($) - American Indian and Alaska Native
Median house or condo value ($) - Multirace
Median house or condo value ($) - Other Race
Median price asked for mobile homes ($)
Household density (households per square mile)
Mean house or condo value by units in structure - 1, detached ($)
Mean house or condo value by units in structure - 1, attached ($)
Mean house or condo value by units in structure - 2 ($)
Mean house or condo value by units in structure by units in structure - 3 or 4 ($)
Mean house or condo value by units in structure - 5 or more ($)
Mean house or condo value by units in structure - Boat, RV, van, etc. ($)
Mean house or condo value by units in structure - Mobile home ($)
Median contract rent ($)
Median contract rent - Lower quartile ($)
Median contract rent - Upper quartile ($)
Median gross rent ($)
Urban houses (%)
Rural houses (%)
Houses occupied (%)
Houses occupied (% change since 2000)
Houses owner occupied (%)
Houses owner occupied (% change since 2000)
Houses renter occupied (%)
Houses renter occupied (% change since 2000)
Vacant housing units - For rent (%)
Vacant housing units - For rent (% change since 2000)
Vacant housing units - For sale only (%)
Vacant housing units - For sale only (% change since 2000)
Vacant housing units - Rented or sold, not occupied (%)
Vacant housing units - Rented or sold, not occupied (% change since 2000)
Vacant housing units - For seasonal, recreational, or occasional use (%)
Vacant housing units - For seasonal, recreational, or occasional use (% change since 2000)
Vacant housing units - For migrant workers (%)
Vacant housing units - For migrant workers (% change since 2000)
Vacant housing units - Other vacant (%)
Vacant housing units - Other vacant (% change since 2000)
Median monthly housing costs ($)
Median household income for houses/condos with a mortgage ($)
Median household income for houses/condos without a mortgage ($)
Median household income ($)
Median household income ($) - White
Median household income ($) - Black or African American
Median household income ($) - Asian
Median household income ($) - Hispanic or Latino
Median household income ($) - American Indian and Alaska Native
Median household income ($) - Multirace
Median household income ($) - Other Race
Mortgage status - with mortgage (%)
Mortgage status - with second mortgage (%)
Mortgage status - with home equity loan (%)
Mortgage status - with both second mortgage and home equity loan (%)
Mortgage status - without a mortgage (%)
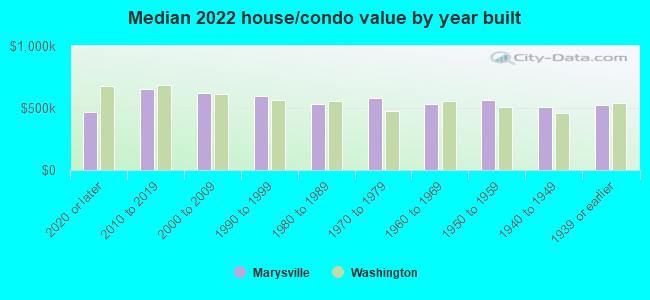
Median year house/condo built
Median year apartment built
Household type by relationship - Male householder living alone (%)
Household type by relationship - Male householder not living alone (%)
Household type by relationship - Female householder living alone (%)
Household type by relationship - Female householder not living alone (%)
Household type by relationship - Opposite-Sex spouse (%)
Household type by relationship - Same-Sex spouse (%)
Household type by relationship - Opposite-Sex unmarried partner (%)
Household type by relationship - Same-Sex unmarried partner (%)
Household type by relationship - In group quarters (%)
Size of family households - 2-person household (%)
Size of family households - 3-person household (%)
Size of family households - 4-person household (%)
Size of family households - 5-person household (%)
Size of family households - 6-person household (%)
Size of family households - 7-or-more-person household (%)
Size of nonfamily households - 1-person household (%)
Size of nonfamily households - 2-person household (%)
Size of nonfamily households - 3-person household (%)
Size of nonfamily households - 4-person household (%)
Size of nonfamily households - 5-person household (%)
Size of nonfamily households - 6-person household (%)
Size of nonfamily households - 7-or-moreperson household (%)
Year house built - Built 2010 or later (%)
Year house built - Built 2000 to 2009 (%)
Year house built - Built 1990 to 1999 (%)
Year house built - Built 1980 to 1989 (%)
Year house built - Built 1970 to 1979 (%)
Year house built - Built 1960 to 1969 (%)
Year house built - Built 1950 to 1959 (%)
Year house built - Built 1940 to 1949 (%)
Year house built - Built 1939 or earlier (%)
Median number of rooms in houses and condos
Median number of rooms in apartments
Median number of bedrooms in owner occupied houses
Mean number of bedrooms in owner occupied houses
Median number of bedrooms in renter occupied houses
Mean number of bedrooms in renter occupied houses
Median number of vehichles in owner occupied houses
Mean number of vehichles in owner occupied houses
Median number of vehichles in renter occupied houses
Mean number of vehichles in renter occupied houses
Rooms in owner-occupied houses - 1 room (%)
Rooms in owner-occupied houses - 2 rooms (%)
Rooms in owner-occupied houses - 3 rooms (%)
Rooms in owner-occupied houses - 4 rooms (%)
Rooms in owner-occupied houses - 5 rooms (%)
Rooms in owner-occupied houses - 6 rooms (%)
Rooms in owner-occupied houses - 7 rooms (%)
Rooms in owner-occupied houses - 8 rooms (%)
Rooms in owner-occupied houses - 9+ rooms (%)
Rooms in renter-occupied houses - 1 room (%)
Rooms in renter-occupied houses - 2 rooms (%)
Rooms in renter-occupied houses - 3 rooms (%)
Rooms in renter-occupied houses - 4 rooms (%)
Rooms in renter-occupied houses - 5 rooms (%)
Rooms in renter-occupied houses - 6 rooms (%)
Rooms in renter-occupied houses - 7 rooms (%)
Rooms in renter-occupied houses - 8 rooms (%)
Rooms in renter-occupied houses - 9+ rooms (%)
Bedrooms in owner-occupied houses - no bedrooms (%)
Bedrooms in owner-occupied houses - 1 bedroom (%)
Bedrooms in owner-occupied houses - 2 bedrooms (%)
Bedrooms in owner-occupied houses - 3 bedrooms (%)
Bedrooms in owner-occupied houses - 4 bedrooms (%)
Bedrooms in owner-occupied houses - 5+ bedrooms (%)
Bedrooms in renter-occupied houses - no bedrooms (%)
Bedrooms in renter-occupied houses - 1 bedroom (%)
Bedrooms in renter-occupied houses - 2 bedrooms (%)
Bedrooms in renter-occupied houses - 3 bedrooms (%)
Bedrooms in renter-occupied houses - 4 bedrooms (%)
Bedrooms in renter-occupied houses - 5+ bedrooms (%)
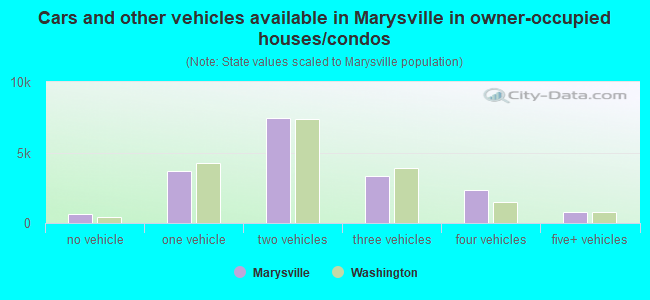
Vehicles available in owner-occupied houses - no vehicle available (%)
Vehicles available in owner-occupied houses - 1 vehicle available(%)
Vehicles available in owner-occupied houses - 2 Vehicles available (%)
Vehicles available in owner-occupied houses - 3 Vehicles available (%)
Vehicles available in owner-occupied houses - 4 Vehicles available (%)
Vehicles available in owner-occupied houses - 5+ Vehicles available (%)
Vehicles available in renter-occupied houses - no vehicle available (%)
Vehicles available in renter-occupied houses - 1 vehicle available (%)
Vehicles available in renter-occupied houses - 2 Vehicles available (%)
Vehicles available in renter-occupied houses - 3 Vehicles available (%)
Vehicles available in renter-occupied houses - 4 Vehicles available (%)
Vehicles available in renter-occupied houses - 5+ Vehicles available (%)
Housing units in structures - 1, detached (%)
Housing units in structures - 1, attached (%)
Housing units in structures - 2 (%)
Housing units in structures - 3 or 4 (%)
Housing units in structures - 5 to 9 (%)
Housing units in structures - 10 to 19 (%)
Housing units in structures - 20 to 49 (%)
Housing units in structures - 50 or more (%)
Housing units in structures - Mobile home (%)
Housing units in structures - Boat, RV, van, etc. (%)
Housing units in structures - Owners - 1, detached (%)
Housing units in structures - Owners - 1, attached (%)
Housing units in structures - Owners - 2 (%)
Housing units in structures - Owners - 3 or 4 (%)
Housing units in structures - Owners - 5 to 9 (%)
Housing units in structures - Owners - 10 to 19 (%)
Housing units in structures - Owners - 20 to 49 (%)
Housing units in structures - Owners - 50 or more (%)
Housing units in structures - Owners - Mobile home (%)
Housing units in structures - Owners - Boat, RV, van, etc. (%)
Housing units in structures - Renters - 1, detached (%)
Housing units in structures - Renters - 1, attached (%)
Housing units in structures - Renters - 2 (%)
Housing units in structures - Renters - 3 or 4 (%)
Housing units in structures - Renters - 5 to 9 (%)
Housing units in structures - Renters - 10 to 19 (%)
Housing units in structures - Renters - 20 to 49 (%)
Housing units in structures - Renters - 50 or more (%)
Housing units in structures - Renters - Mobile home (%)
Housing units in structures - Renters - Boat, RV, van, etc. (%)
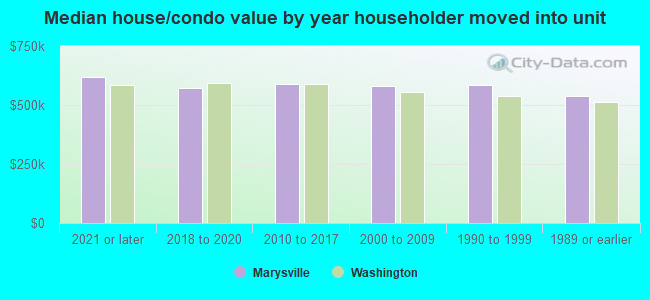
House/condo owner moved in on average (years ago)
Renter moved in on average (years ago)
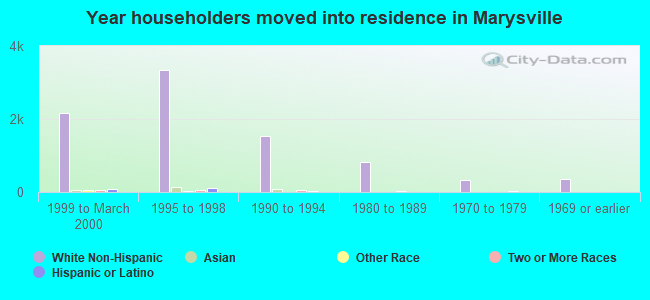
Year householder moved into unit - Moved in 1999 to March 2000 (%)
Year householder moved into unit - Moved in 1999 to March 2000 (%) - White
Year householder moved into unit - Moved in 1999 to March 2000 (%) - Black or African American
Year householder moved into unit - Moved in 1999 to March 2000 (%) - Asian
Year householder moved into unit - Moved in 1999 to March 2000 (%) - Hispanic or Latino
Year householder moved into unit - Moved in 1999 to March 2000 (%) - American Indian and Alaska Native
Year householder moved into unit - Moved in 1999 to March 2000 (%) - Multirace
Year householder moved into unit - Moved in 1999 to March 2000 (%) - Other Race
Year householder moved into unit - Moved in 1995 to 1998 (%)
Year householder moved into unit - Moved in 1995 to 1998 (%) - White
Year householder moved into unit - Moved in 1995 to 1998 (%) - Black or African American
Year householder moved into unit - Moved in 1995 to 1998 (%) - Asian
Year householder moved into unit - Moved in 1995 to 1998 (%) - Hispanic or Latino
Year householder moved into unit - Moved in 1995 to 1998 (%) - American Indian and Alaska Native
Year householder moved into unit - Moved in 1995 to 1998 (%) - Multirace
Year householder moved into unit - Moved in 1995 to 1998 (%) - Other Race
Year householder moved into unit - Moved in 1990 to 1994 (%)
Year householder moved into unit - Moved in 1990 to 1994 (%) - White
Year householder moved into unit - Moved in 1990 to 1994 (%) - Black or African American
Year householder moved into unit - Moved in 1990 to 1994 (%) - Asian
Year householder moved into unit - Moved in 1990 to 1994 (%) - Hispanic or Latino
Year householder moved into unit - Moved in 1990 to 1994 (%) - American Indian and Alaska Native
Year householder moved into unit - Moved in 1990 to 1994 (%) - Multirace
Year householder moved into unit - Moved in 1990 to 1994 (%) - Other Race
Year householder moved into unit - Moved in 1980 to 1989 (%)
Year householder moved into unit - Moved in 1980 to 1989 (%) - White
Year householder moved into unit - Moved in 1980 to 1989 (%) - Black or African American
Year householder moved into unit - Moved in 1980 to 1989 (%) - Asian
Year householder moved into unit - Moved in 1980 to 1989 (%) - Hispanic or Latino
Year householder moved into unit - Moved in 1980 to 1989 (%) - American Indian and Alaska Native
Year householder moved into unit - Moved in 1980 to 1989 (%) - Multirace
Year householder moved into unit - Moved in 1980 to 1989 (%) - Other Race
Year householder moved into unit - Moved in 1970 to 1979 (%)
Year householder moved into unit - Moved in 1970 to 1979 (%) - White
Year householder moved into unit - Moved in 1970 to 1979 (%) - Black or African American
Year householder moved into unit - Moved in 1970 to 1979 (%) - Asian
Year householder moved into unit - Moved in 1970 to 1979 (%) - Hispanic or Latino
Year householder moved into unit - Moved in 1970 to 1979 (%) - American Indian and Alaska Native
Year householder moved into unit - Moved in 1970 to 1979 (%) - Multirace
Year householder moved into unit - Moved in 1970 to 1979 (%) - Other Race
Year householder moved into unit - Moved in 1969 or earlier (%)
Year householder moved into unit - Moved in 1969 or earlier (%) - White
Year householder moved into unit - Moved in 1969 or earlier (%) - Black or African American
Year householder moved into unit - Moved in 1969 or earlier (%) - Asian
Year householder moved into unit - Moved in 1969 or earlier (%) - Hispanic or Latino
Year householder moved into unit - Moved in 1969 or earlier (%) - American Indian and Alaska Native
Year householder moved into unit - Moved in 1969 or earlier (%) - Multirace
Year householder moved into unit - Moved in 1969 or earlier (%) - Other Race
Housing units lacking complete plumbing facilities (%)
Housing units lacking complete kitchen facilities (%)
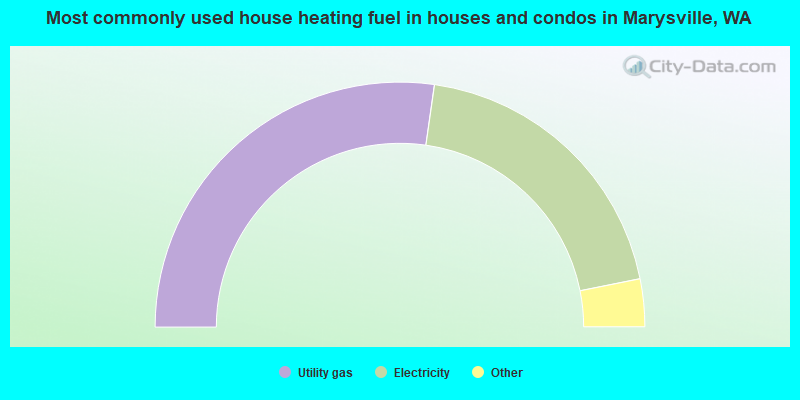
House heating fuel used in houses and condos - Utility gas (%)
House heating fuel used in houses and condos - Bottled, tank, or LP gas (%)
House heating fuel used in houses and condos - Electricity (%)
House heating fuel used in houses and condos - Fuel oil, kerosene, etc. (%)
House heating fuel used in houses and condos - Coal or coke (%)
House heating fuel used in houses and condos - Wood (%)
House heating fuel used in houses and condos - Solar energy (%)
House heating fuel used in houses and condos - Other fuel (%)
House heating fuel used in houses and condos - No fuel used (%)
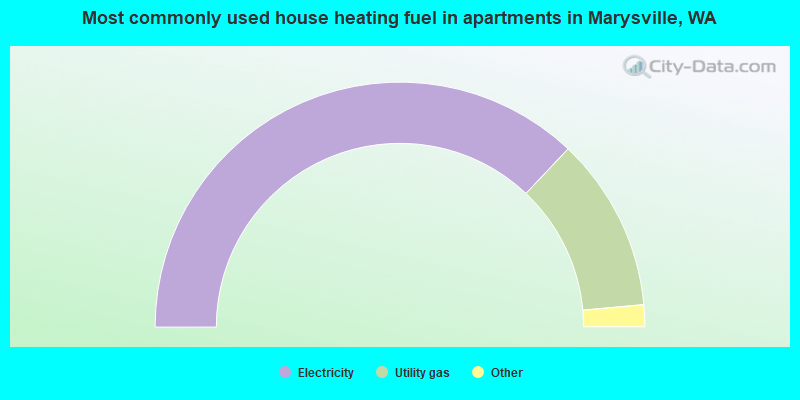
House heating fuel used in apartments - Utility gas (%)
House heating fuel used in apartments - Bottled, tank, or LP gas (%)
House heating fuel used in apartments - Electricity (%)
House heating fuel used in apartments - Fuel oil, kerosene, etc. (%)
House heating fuel used in apartments - Coal or coke (%)
House heating fuel used in apartments - Wood (%)
House heating fuel used in apartments - Solar energy (%)
House heating fuel used in apartments - Other fuel (%)
House heating fuel used in apartments - No fuel used (%)
Latest news about housing in Marysville, WA collected exclusively by city-data.com from local newspapers, TV, and radio stations
Median year house/condo built: 1991Median year apartment built: 1997Household type by relationship:
Households: 72,280
Male householders: 13,285 (2,420 living alone ), Female householders: 11,472 (2,113 living alone )13,566 spouses (13,364 opposite-sex spouses ), 2,900 unmarried partners , (2,729 opposite-sex unmarried partners ), 22,038 children (19,865 natural , 407 adopted , 1,766 stepchildren ), 1,572 grandchildren , 1,344 brothers or sisters , 969 parents , 0 foster children , 1,947 other relatives , 2,663 non-relatives In group quarters: 524
Size of family households: 6,376 2-persons , 3,935 3-persons , 3,497 4-persons , 1,540 5-persons , 1,424 6-persons , 667 7-or-more-persons .
Size of nonfamily households: 4,533 1-person , 2,649 2-persons , 72 3-persons , 64 4-persons .
11,633 married couples with children. single-parent households (1,184 men , 2,082 women ).
81.1% of residents of Marysville speak English at home. of residents speak Spanish at home (67% speak English very well , 22% speak English well , 10% speak English not well , 1% don't speak English at all ).of residents speak other Indo-European language at home (62% speak English very well , 25% speak English well , 11% speak English not well , 1% don't speak English at all ).of residents speak Asian or Pacific Island language at home (62% speak English very well , 26% speak English well , 11% speak English not well , 1% don't speak English at all ).of residents speak other language at home (91% speak English very well , 2% speak English well , 1% speak English not well , 7% don't speak English at all ).
Foreign born population: 11,417 (15.8%)of them are naturalized citizens )
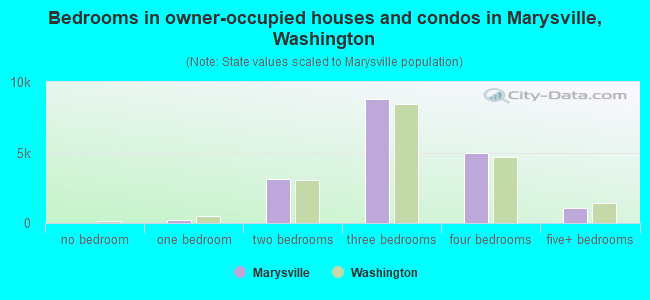
Median number of rooms in houses and condos:
Median number of rooms in apartments
Owner-occupied Renter-occupied
Rooms in owner-occupied houses in Marysville, Washington
0 1 room 71 2 rooms 519 3 rooms 1,985 4 rooms 3,525 5 rooms 4,219 6 rooms 3,268 7 rooms 1,610 8 rooms 2,998 9+ rooms
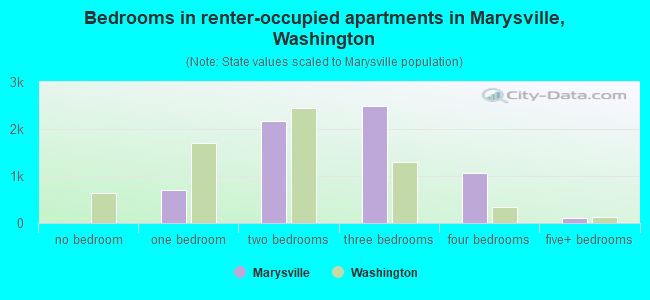
Rooms in renter-occupied apartments in Marysville, Washington
0 1 room 165 2 rooms 991 3 rooms 1,961 4 rooms 1,355 5 rooms 1,312 6 rooms 380 7 rooms 115 8 rooms 283 9+ rooms
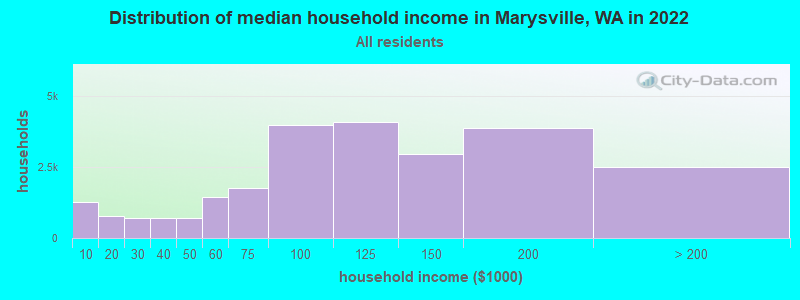
Marysville, WA household income distribution 1,258 Less than $10,000777 $10,000 to $19,999719 $20,000 to $29,999709 $30,000 to $39,999715 $40,000 to $49,9991,459 $50,000 to $59,9991,760 $60,000 to $74,9993,973 $75,000 to $99,9994,085 $100,000 to $124,9992,945 $125,000 to $149,9993,874 $150,000 to $199,9992,483 $200,000 or more
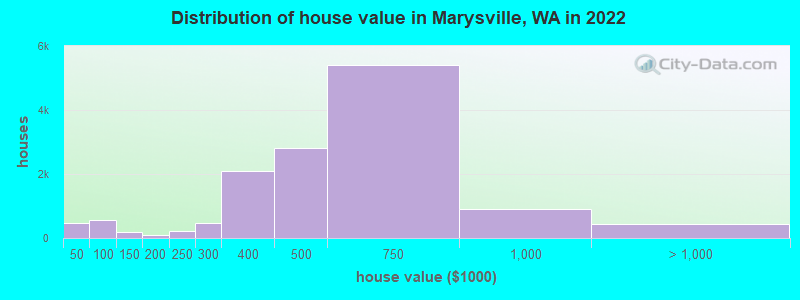
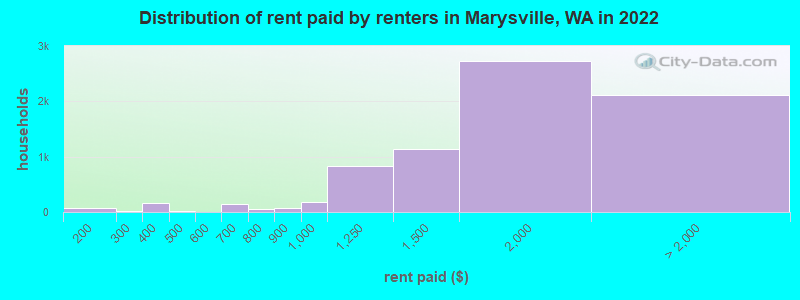
Home value of owner - occupied houses in 2022 in Marysville, WA 117 Less than $10,00011 $10,000 to $14,9999 $15,000 to $19,99940 $20,000 to $24,99962 $25,000 to $29,99931 $30,000 to $34,99925 $35,000 to $39,999166 $40,000 to $49,99935 $50,000 to $59,999112 $60,000 to $69,99958 $70,000 to $79,999115 $80,000 to $89,99960 $90,000 to $99,999173 $100,000 to $124,99911 $125,000 to $149,99959 $150,000 to $174,99937 $175,000 to $199,999221 $200,000 to $249,999472 $250,000 to $299,9992,091 $300,000 to $399,9992,801 $400,000 to $499,9995,414 $500,000 to $749,999899 $750,000 to $999,999356 $1,000,000 to $1,499,99947 $1,500,000 to $1,999,99946 $2,000,000 or moreRent paid by renters in 2022 in Marysville, WA 24 Less than $10035 $100 to $14939 $150 to $19914 $200 to $24912 $250 to $29930 $300 to $349129 $350 to $39922 $450 to $4992 $500 to $5494 $550 to $599128 $600 to $64920 $650 to $69940 $700 to $74921 $750 to $79964 $800 to $899186 $900 to $999838 $1,000 to $1,2491,145 $1,250 to $1,4992,734 $1,500 to $1,9991,197 $2,000 to $2,499630 $2,500 to $2,99972 $3,000 to $3,4997 $3,500 or more203 No cash rent
Percentage of workers working in this county: 84.1%Number of people working at home: 4,603 (12.4% of all workers )
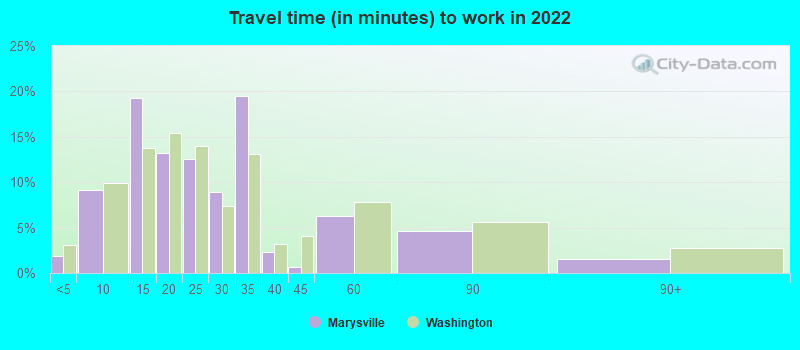
Travel time to work (commute)
Less than 5 minutes: 2265 to 9 minutes: 1,99610 to 14 minutes: 4,29915 to 19 minutes: 4,96220 to 24 minutes: 4,14925 to 29 minutes: 1,64330 to 34 minutes: 4,73535 to 39 minutes: 93140 to 44 minutes: 1,79945 to 59 minutes: 2,61360 to 89 minutes: 4,02190 or more minutes: 1,517
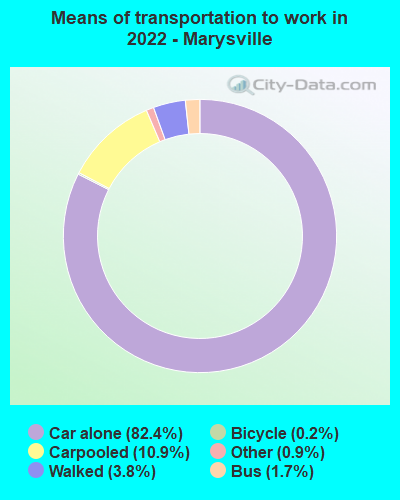
Means of transportation to work:
Drove a car alone: 11,726 (60.8%)Carpooled: 1,663 (8.6%)Bus : 333 (1.7%)Long-distance train or commuter rail : 2 (0.0%)Light rail, streetcar or trolley : 23 (0.1%)Taxi: 148 (0.8%)Bicycle: 15 (0.1%)Walked: 647 (3.4%)Worked at home: 4,603 (23.9%)
Unemployment by race in 2022
Unemployment rate for White non-Hispanic residents 2.4% Males1.8% FemalesUnemployment rate for Black residents 11.5% Males11.4% FemalesUnemployment rate for American Indian and Alaska Native residents 3.0% Males8.2% FemalesUnemployment rate for Asian residents 6.3% Males6.3% FemalesUnemployment rate for other race residents 3.2% MalesUnemployment rate for two or more race residents 8.1% Males2.7% FemalesUnemployment rate for Hispanic or Latino residents 3.7% Males3.1% Females
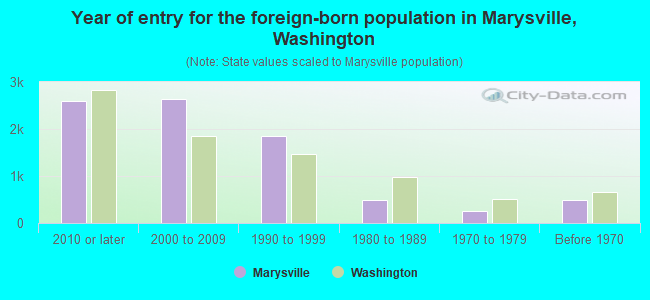
Year of entry for the foreign-born population in Marysville, Washington
2,595 2010 or later 2,633 2000 to 2009 1,842 1990 to 1999 494 1980 to 1989 246 1970 to 1979 483 Before 1970
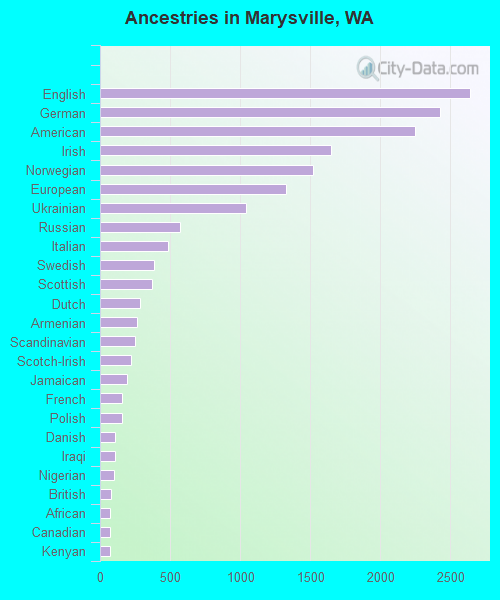
First ancestries reported:
English: 2,646 (8.2%)
German: 2,427 (7.5%)
American: 2,248 (6.9%)
Irish: 1,653 (5.1%)
Norwegian: 1,522 (4.7%)
European: 1,325 (4.1%)
Ukrainian: 1,041 (3.2%)
Russian: 570 (1.8%)
Italian: 483 (1.5%)
Swedish: 384 (1.2%)
Scottish: 373 (1.2%)
Dutch: 287 (0.9%)
Armenian: 266 (0.8%)
Scandinavian: 247 (0.8%)
Scotch-Irish: 222 (0.7%)
Jamaican: 196 (0.6%)
French: 159 (0.5%)
Polish: 155 (0.5%)
Danish: 107 (0.3%)
Iraqi: 104 (0.3%)
Nigerian: 97 (0.3%)
British: 82 (0.3%)
African: 74 (0.2%)
Canadian: 72 (0.2%)
Kenyan: 72 (0.2%)
Romanian: 59 (0.2%)
Finnish: 47 (0.1%)
French Canadian: 45 (0.1%)
Greek: 42 (0.1%)
Czech: 39 (0.1%)
Icelander: 34 (0.1%)
Yugoslavian: 33 (0.1%)
Portuguese: 28 (0.09%)
Slovak: 26 (0.08%)
Welsh: 22 (0.07%)
Austrian: 21 (0.06%)
Eastern European: 16 (0.05%)
Swiss: 14 (0.04%)
Syrian: 12 (0.04%)
Latvian: 12 (0.04%)
Maltese: 11 (0.03%)
Hungarian: 11 (0.03%)
Czechoslovakian: 10 (0.03%)
Celtic: 9 (0.03%)
Serbian: 9 (0.03%)
Croatian: 8 (0.02%)
Egyptian: 8 (0.02%)
Ethiopian: 8 (0.02%)
Brazilian: 6 (0.02%)
Slavic: 6 (0.02%)
Ugandan: 5 (0.02%)
Northern European: 5 (0.02%)
Pennsylvania German: 2 (0.01%)
Most common places of birth for foreign-born residents (%): Mexico Marysville:
21.3% (1,841)Washington:
21.1% (241,655)
Philippines Marysville:
13.6% (1,176)Washington:
6.3% (71,661)
India Marysville:
10.6% (921)Washington:
8.9% (101,353)
Ukraine Marysville:
10.4% (900)Washington:
3.1% (35,872)
China, excluding Hong Kong and Taiwan Marysville:
4.9% (421)Washington:
7.4% (84,470)
Russia Marysville:
4.6% (395)Washington:
1.9% (21,540)
Thailand Marysville:
3.4% (292)Washington:
0.9% (9,937)
Vietnam Marysville:
3.0% (263)Washington:
5.4% (62,003)
Canada Marysville:
2.7% (238)Washington:
4.1% (47,238)
Pakistan Marysville:
2.6% (225)Washington:
0.6% (6,294)
Iraq Marysville:
2.4% (206)Washington:
0.5% (6,259)
Korea Marysville:
1.6% (141)Washington:
4.3% (48,886)
Guatemala Marysville:
1.6% (140)Washington:
1.2% (13,855)
Place of birth for U.S.-born residents:
This state: 38,862Other state: 19,988Northeast: 908Midwest: 4,421South: 2,095West: 12,564 87.5% of Marysville residents lived in the same house 1 years ago.
Out of people who lived in different houses, 38.7% lived in this county.
Out of people who lived in different counties, 57.1% lived in Washington.
Marysville:
87.5%State average:
85.2%
Education attainment for males 25 years and older:
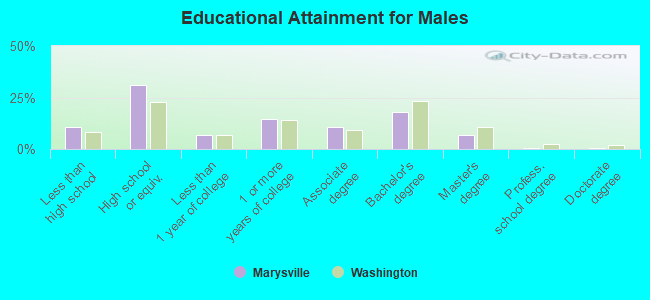
No schooling: 219Nursery to 4th grade: 05th and 6th grade: 07th and 8th grade: 6319th grade: 31310th grade: 13711th grade: 81912th grade, no diploma: 586High school graduate (or equivalency): 7,971Less than 1 year of college: 1,754Some college more than 1 year, no degree: 3,755Associate degree: 2,763Bachelor's degree: 4,612Master's degree: 1,695Professional school degree: 137Doctorate degree: 92
Education attainment for females 25 years and older:
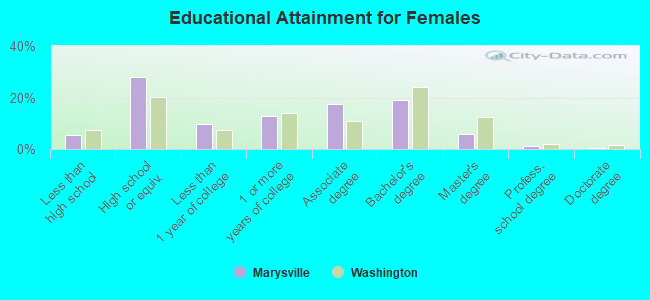
No schooling: 246Nursery to 4th grade: 05th and 6th grade: 897th and 8th grade: 2589th grade: 4010th grade: 011th grade: 20812th grade, no diploma: 512High school graduate (or equivalency): 6,909Less than 1 year of college: 2,374Some college more than 1 year, no degree: 3,109Associate degree: 4,333Bachelor's degree: 4,711Master's degree: 1,443Professional school degree: 321Doctorate degree: 60
Housing units in structures:
One, detached: 20,188One, attached: 1,340Two: 1,0523 or 4: 6085 to 9: 67610 to 19: 65520 to 49: 27450 or more: 515Mobile homes: 837Boats, RVs, vans, etc.: 71Median worth of mobile homes: $130,790
Housing units lacking complete plumbing facilities in 2022: 0.7%Housing units lacking complete kitchen facilities in 2022: 1.2%House/condo owner moved in on average 8 years ago
Renter moved in on average 3 years ago
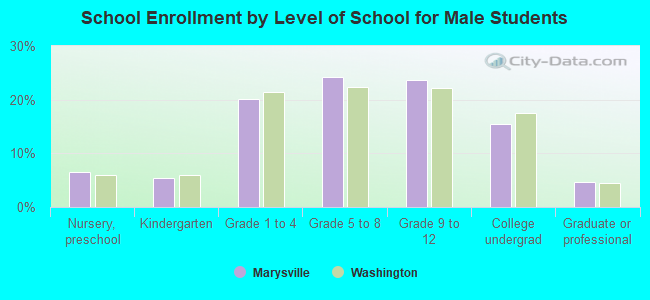
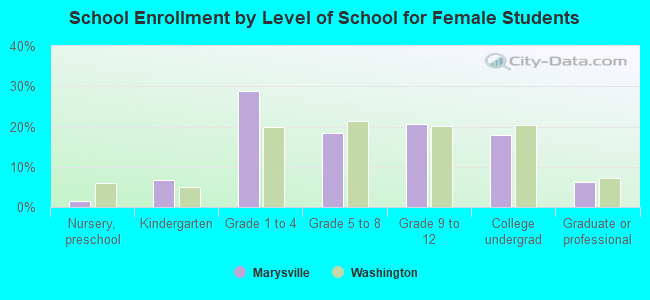
Private vs. public school enrollment:
Students in private schools in grades 1 to 8 (elementary and middle school): 1,284 Here:
15.9%Washington:
12.4%
Students in private schools in grades 9 to 12 (high school): 280 Students in private undergraduate colleges: 495 Here:
16.9%Washington:
16.5%