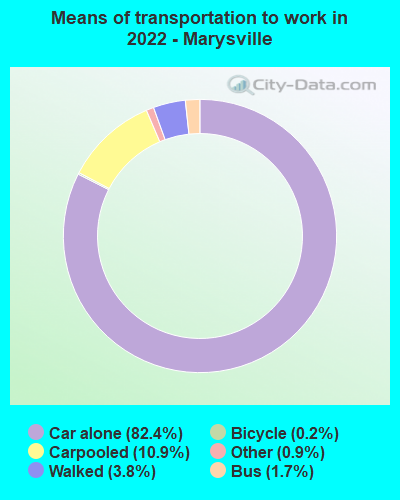
Marysville, Washington
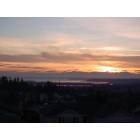
Marysville: sound view
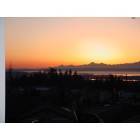
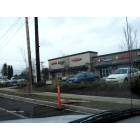
Marysville: View From Grove Street
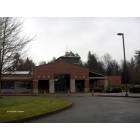
Marysville: Marysville Public Library, 6120 Grove Street
Marysville: Entering marysville.
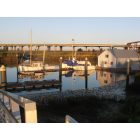
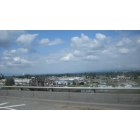
Marysville: Marysville's Harbor
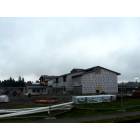
Marysville: New Grove Elementary School being built at 64th & Grove, opening Fall 2008
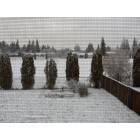
Marysville: View of our back yard and soccer field after 01/09/05 snow storm
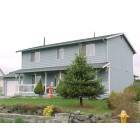
Marysville: Typical house in Kellogg Meadows, Marysville, WA
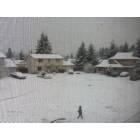
Marysville: View of our front yard after 01/09/05 snow storm, Marysville, WA
Marysville: Vinaccio Coffee Shop, 4711 64th St NE
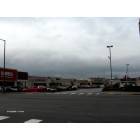
Marysville: Marysville Mall, State Street and Fourth
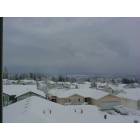
Marysville: snow 2008
- add
your
Submit your own pictures of this city and show them to the world
- OSM Map
- General Map
- Google Map
- MSN Map
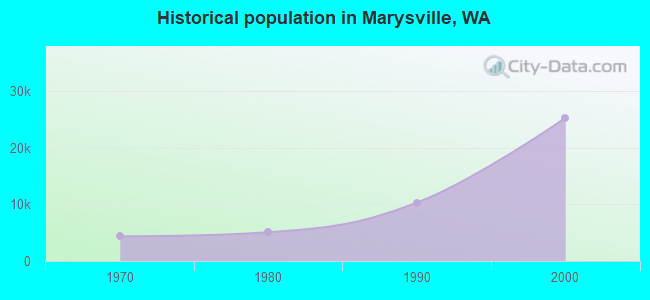
Population change since 2000: +185.5%
| Males: 38,064 | |
| Females: 34,211 |
| Median resident age: | 38.1 years |
| Washington median age: | 38.4 years |
Zip codes: 98271.
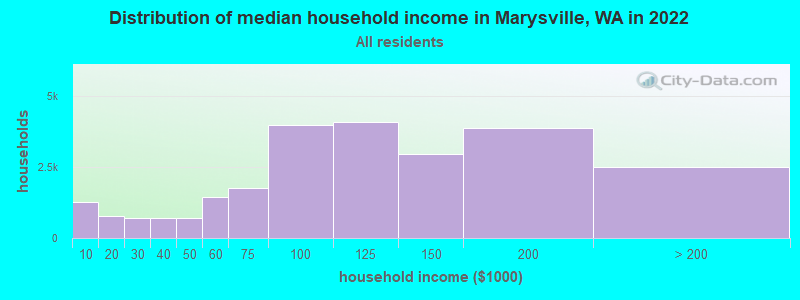
| Marysville: | $104,433 |
| WA: | $91,306 |
Estimated per capita income in 2022: $41,411 (it was $20,414 in 2000)
Marysville city income, earnings, and wages data
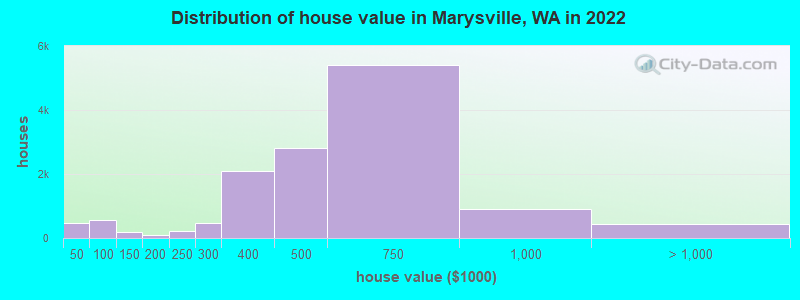
Estimated median house or condo value in 2022: $586,800 (it was $169,100 in 2000)
| Marysville: | $586,800 |
| WA: | $569,500 |
Mean prices in 2022: all housing units: $555,518; detached houses: $584,529; townhouses or other attached units: $527,185; in 2-unit structures: $408,164; in 3-to-4-unit structures: $371,641; in 5-or-more-unit structures: $498,960; mobile homes: $232,807; occupied boats, rvs, vans, etc.: $87,937
Median gross rent in 2022: $2,080.
(8.8% for White Non-Hispanic residents, 7.6% for Black residents, 4.9% for Hispanic or Latino residents, 5.6% for American Indian residents, 28.2% for Native Hawaiian and other Pacific Islander residents, 5.4% for other race residents, 7.3% for two or more races residents)
Detailed information about poverty and poor residents in Marysville, WA


Compare current foreclosures in Marysville, WA:
| Photo | Address | Area | Beds / Baths | Price | Details |
|---|---|---|---|---|---|

|
#1
63rd Pl NE
Marysville, WA 98270
|
2,082 sq. feet
|
2 baths 4 beds |
show details | |

|
#2
150th St NE
Marysville, WA 98271
|
960 sq. feet
|
2 baths 3 beds |
show details | |

|
#3
51st Ave NE
Marysville, WA 98271
|
1,174 sq. feet
|
2 baths 3 beds |
show details | |

|
#4
123rd Pl NE
Marysville, WA 98271
|
1,018 sq. feet
|
1 baths 3 beds |
show details | |

|
#5
38th Ave NW
Marysville, WA 98271
|
728 sq. feet
|
1 baths 2 beds |
show details | |

|
#6
58th St NE
Marysville, WA 98270
|
6,934 sq. feet
|
7 baths 9 beds |
show details | |

|
#7
66th Dr NE
Marysville, WA 98270
|
1,396 sq. feet
|
2 baths 3 beds |
show details | |

|
#8
126th St NE
Marysville, WA 98271
|
1,699 sq. feet
|
2 baths 3 beds |
show details | |

|
#9
139th Pl NE
Marysville, WA 98271
|
1,512 sq. feet
|
2 baths 3 beds |
show details | |

|
#10
133rd Pl NE
Marysville, WA 98271
|
1,664 sq. feet
|
1 baths 3 beds |
show details |
| Photo | Address | Area | Beds / Baths | Price | Details |
|---|---|---|---|---|---|

|
#11
48th Dr NE
Marysville, WA 98270
|
1,526 sq. feet
|
1 baths 2 beds |
show details | |

|
#12
58th St NE
Marysville, WA 98270
|
1,608 sq. feet
|
1 baths 3 beds |
show details | |

|
#13
79th Ave NE
Marysville, WA 98270
|
2,146 sq. feet
|
2 baths 3 beds |
show details | |

|
#14
96th St NE
Marysville, WA 98270
|
2,392 sq. feet
|
2 baths 3 beds |
show details | |

|
#15
75th Dr NE
Marysville, WA 98270
|
1,180 sq. feet
|
2 baths 3 beds |
show details | |

|
#16
53rd Dr NE
Marysville, WA 98270
|
1,216 sq. feet
|
1 baths 1 beds |
show details | |

|
#17
77th Pl NE
Marysville, WA 98270
|
1,417 sq. feet
|
1 baths 3 beds |
show details | |

|
#18
27th Ave NE
Marysville, WA 98271
|
1,160 sq. feet
|
2 baths 3 beds |
show details | |

|
#19
Alla Madison Dr
Marysville, WA 98271
|
1,413 sq. feet
|
1 baths 3 beds |
show details | |

|
#20
64th Dr NE
Marysville, WA 98270
|
1,587 sq. feet
|
2 baths 3 beds |
show details |
| Photo | Address | Area | Beds / Baths | Price | Details |
|---|---|---|---|---|---|

|
#21
38th Ave NE
Marysville, WA 98271
|
1,398 sq. feet
|
1 baths 2 beds |
show details | |

|
#22
55th Pl NE
Marysville, WA 98270
|
1,763 sq. feet
|
2 baths 3 beds |
show details | |

|
#23
Sunnyside Blvd
Marysville, WA 98270
|
3,376 sq. feet
|
5 baths 6 beds |
show details | |

|
#24
122nd Pl NE
Marysville, WA 98271
|
2,104 sq. feet
|
2 baths 4 beds |
show details | |

|
#25
125th St NE
Marysville, WA 98271
|
1,088 sq. feet
|
2 baths 3 beds |
show details | |

|
#26
Beach Ave
Marysville, WA 98270
|
1,056 sq. feet
|
2 baths 3 beds |
show details | |

|
#27
46th Dr NE
Marysville, WA 98270
|
2,132 sq. feet
|
3 baths 4 beds |
show details | |

|
#28
47th Dr NE
Marysville, WA 98270
|
1,422 sq. feet
|
1 baths 3 beds |
show details | |

|
#29
59th Ave NE
Marysville, WA 98270
|
1,746 sq. feet
|
2 baths 3 beds |
show details | |

|
#30
47th Ave NE
Marysville, WA 98271
|
1,698 sq. feet
|
2 baths 3 beds |
show details |
| Photo | Address | Area | Beds / Baths | Price | Details |
|---|---|---|---|---|---|

|
#31
145th St NE
Marysville, WA 98271
|
1,404 sq. feet
|
2 baths 3 beds |
show details | |

|
#32
Alder Ave
Marysville, WA 98270
|
869 sq. feet
|
1 baths 2 beds |
show details | |

|
#33
67th St NE
Marysville, WA 98270
|
2,345 sq. feet
|
2 baths 4 beds |
show details | |

|
#34
81st Dr NE
Marysville, WA 98270
|
2,781 sq. feet
|
2 baths 5 beds |
show details | |

|
#35
178th Pl NE
Marysville, WA 98271
|
1,009 sq. feet
|
2 baths 3 beds |
show details | |

|
#36
69th Pl NE
Marysville, WA 98270
|
2,141 sq. feet
|
2 baths 3 beds |
show details | |

|
#37
56th Ave NE
Marysville, WA 98270
|
1,620 sq. feet
|
2 baths 3 beds |
show details | |

|
#38
54th Dr NE
Marysville, WA 98270
|
1,050 sq. feet
|
2 baths 3 beds |
show details | |

|
#39
51st Dr NE
Marysville, WA 98271
|
1,482 sq. feet
|
2 baths 3 beds |
show details | |

|
#40
50th Ave NE
Marysville, WA 98270
|
1,370 sq. feet
|
2 baths 3 beds |
show details |
| Photo | Address | Area | Beds / Baths | Price | Details |
|---|---|---|---|---|---|

|
#41
79th Ave NE
Marysville, WA 98270
|
2,252 sq. feet
|
2 baths 3 beds |
show details | |

|
#42
Sunnyside Blvd
Marysville, WA 98270
|
2,752 sq. feet
|
4 baths 3 beds |
show details | |

|
#43
102nd Pl NE
Marysville, WA 98270
|
987 sq. feet
|
2 baths 3 beds |
show details | |

|
#44
130th Pl NE
Marysville, WA 98271
|
1,248 sq. feet
|
1 baths 3 beds |
show details | |

|
#45
62nd Dr NE
Marysville, WA 98270
|
2,108 sq. feet
|
2 baths 3 beds |
show details | |

|
#46
60th Dr NE
Marysville, WA 98270
|
1,620 sq. feet
|
2 baths 2 beds |
show details | |

|
#47
66th Ave NE
Marysville, WA 98270
|
2,018 sq. feet
|
2 baths 4 beds |
show details | |

|
#48
72nd St NE
Marysville, WA 98271
|
1,620 sq. feet
|
2 baths 3 beds |
show details | |

|
#49
48th Dr NE
Marysville, WA 98270
|
1,194 sq. feet
|
1 baths 3 beds |
show details | |

|
Check over 1 million property listings on Foreclosure.com!
|
browse all offers | |||


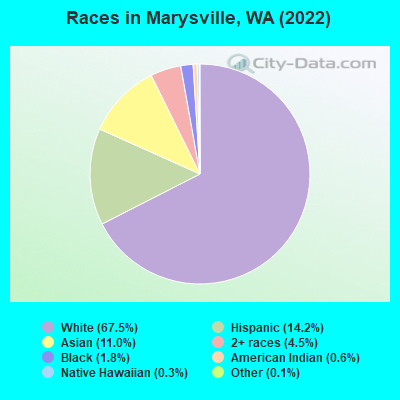
- 48,80667.5%White alone
- 10,28114.2%Hispanic
- 7,94411.0%Asian alone
- 3,2474.5%Two or more races
- 1,2731.8%Black alone
- 4330.6%American Indian alone
- 2010.3%Native Hawaiian and Other
Pacific Islander alone - 950.1%Other race alone
Races in Marysville detailed stats: ancestries, foreign born residents, place of birth
According to our research of Washington and other state lists, there were 72 registered sex offenders living in Marysville, Washington as of April 29, 2024.
The ratio of all residents to sex offenders in Marysville is 937 to 1.
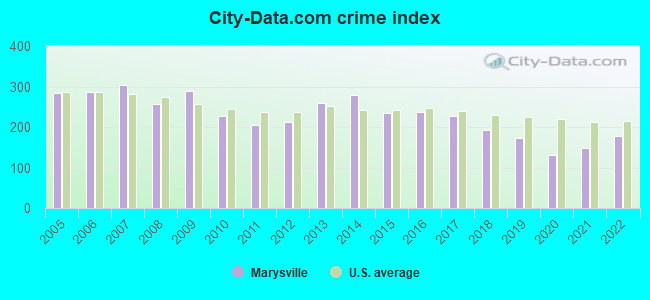
The City-Data.com crime index weighs serious crimes and violent crimes more heavily. Higher means more crime, U.S. average is 246.1. It adjusts for the number of visitors and daily workers commuting into cities.
- means the value is smaller than the state average.- means the value is about the same as the state average.
- means the value is bigger than the state average.
- means the value is much bigger than the state average.
Crime rate in Marysville detailed stats: murders, rapes, robberies, assaults, burglaries, thefts, arson
Full-time law enforcement employees in 2021, including police officers: 98 (65 officers - 54 male; 11 female).
| Officers per 1,000 residents here: | 0.90 |
| Washington average: | 1.35 |
 Recent articles from our blog. Our writers, many of them Ph.D. graduates or candidates, create easy-to-read articles on a wide variety of topics.

 | Snohomish, Lake Stevens, Marysville? (14 replies) |
| How best to get from SEATAC to Marysville WA (18 replies) |
| Best Baseball Town around Marysville (5 replies) |
| Thinking if moving to the Marysville area (6 replies) |
| Best Baseball Town near Marysville (1 reply) |
| Which is more accurate, if you love Seattle you’d love Anchorage or you’d love San Francisco? (26 replies) |
Latest news from Marysville, WA collected exclusively by city-data.com from local newspapers, TV, and radio stations
Ancestries: German (7.4%), English (7.1%), American (6.4%), Irish (5.1%), Norwegian (4.7%), European (4.2%).
Current Local Time: PST time zone
Incorporated in 1891
Elevation: 20 feet
Land area: 9.59 square miles.
Population density: 7,537 people per square mile (high).
8,657 residents are foreign born (5.4% Asia, 3.1% Latin America, 2.3% Europe).
| This city: | 12.0% |
| Washington: | 14.9% |
Median real estate property taxes paid for housing units with mortgages in 2022: $4,220 (0.7%)
Median real estate property taxes paid for housing units with no mortgage in 2022: $4,390 (0.8%)
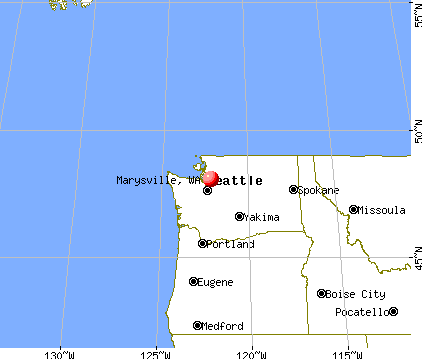
Nearest city with pop. 50,000+: Everett, WA  (7.1 miles , pop. 91,488).
Nearest city with pop. 200,000+: East Seattle, WA (30.9 miles , pop. 480,100).
Nearest city with pop. 1,000,000+: Los Angeles, CA (986.4 miles , pop. 3,694,820).
Nearest cities:
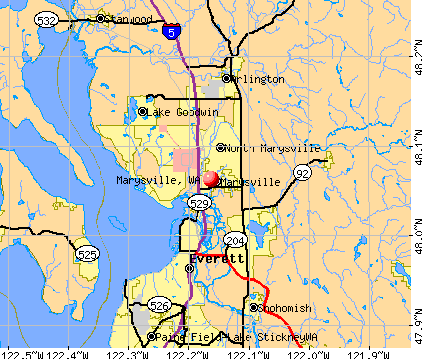
), ), ), ), ), ), )Latitude: 48.06 N, Longitude: 122.16 W
Daytime population change due to commuting: -17,956 (-24.8%)
Workers who live and work in this city: 9,570 (25.7%)
Area code: 360
Property values in Marysville, WA
Marysville tourist attractions:
Marysville, Washington accommodation & food services, waste management - Economy and Business Data
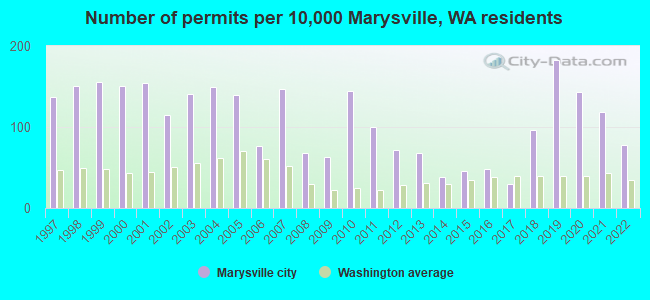
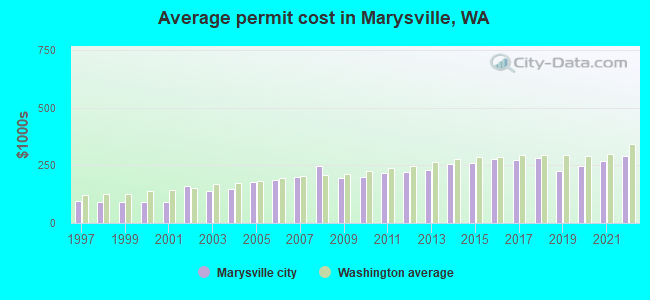
Single-family new house construction building permits:
- 2022: 197 buildings, average cost: $290,500
- 2021: 298 buildings, average cost: $267,600
- 2020: 361 buildings, average cost: $245,900
- 2019: 464 buildings, average cost: $226,300
- 2018: 244 buildings, average cost: $281,300
- 2017: 77 buildings, average cost: $276,400
- 2016: 121 buildings, average cost: $277,700
- 2015: 116 buildings, average cost: $262,000
- 2014: 96 buildings, average cost: $255,700
- 2013: 172 buildings, average cost: $228,900
- 2012: 182 buildings, average cost: $222,400
- 2011: 252 buildings, average cost: $216,000
- 2010: 368 buildings, average cost: $200,200
- 2009: 160 buildings, average cost: $195,600
- 2008: 172 buildings, average cost: $245,500
- 2007: 372 buildings, average cost: $197,600
- 2006: 195 buildings, average cost: $185,500
- 2005: 354 buildings, average cost: $176,900
- 2004: 376 buildings, average cost: $147,700
- 2003: 357 buildings, average cost: $139,400
- 2002: 291 buildings, average cost: $158,900
- 2001: 389 buildings, average cost: $93,400
- 2000: 383 buildings, average cost: $93,400
- 1999: 396 buildings, average cost: $93,400
- 1998: 380 buildings, average cost: $93,300
- 1997: 347 buildings, average cost: $93,600
| Here: | 3.9% |
| Washington: | 4.6% |
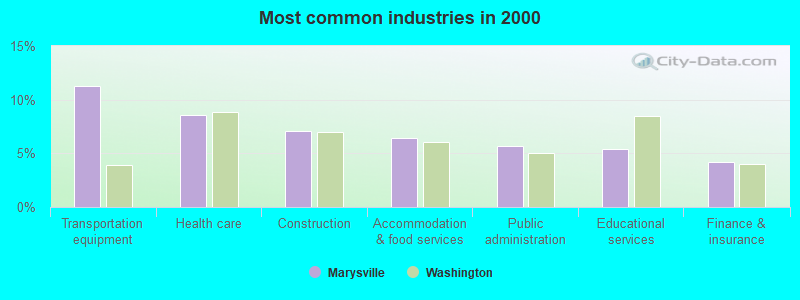
- Transportation equipment (11.3%)
- Health care (8.6%)
- Construction (7.1%)
- Accommodation & food services (6.4%)
- Public administration (5.7%)
- Educational services (5.4%)
- Finance & insurance (4.2%)
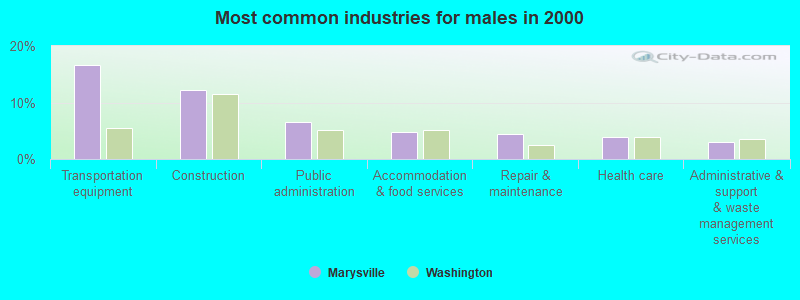
- Transportation equipment (16.7%)
- Construction (12.1%)
- Public administration (6.6%)
- Accommodation & food services (4.8%)
- Repair & maintenance (4.4%)
- Health care (3.9%)
- Administrative & support & waste management services (3.0%)
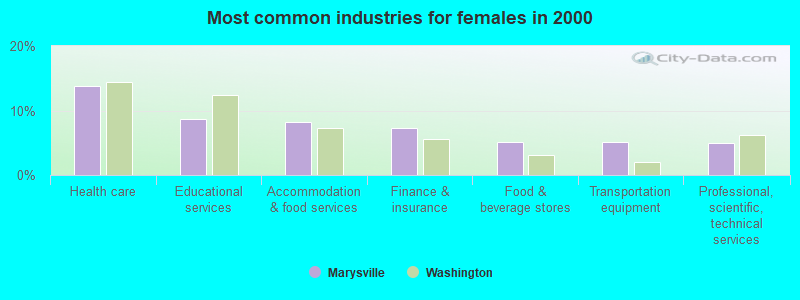
- Health care (13.8%)
- Educational services (8.7%)
- Accommodation & food services (8.3%)
- Finance & insurance (7.3%)
- Food & beverage stores (5.1%)
- Transportation equipment (5.1%)
- Professional, scientific, technical services (4.9%)
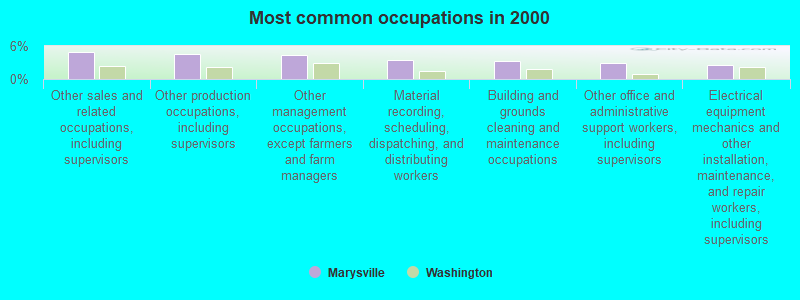
- Other sales and related occupations, including supervisors (4.9%)
- Other production occupations, including supervisors (4.6%)
- Other management occupations, except farmers and farm managers (4.4%)
- Material recording, scheduling, dispatching, and distributing workers (3.5%)
- Building and grounds cleaning and maintenance occupations (3.2%)
- Other office and administrative support workers, including supervisors (2.9%)
- Electrical equipment mechanics and other installation, maintenance, and repair workers, including supervisors (2.6%)
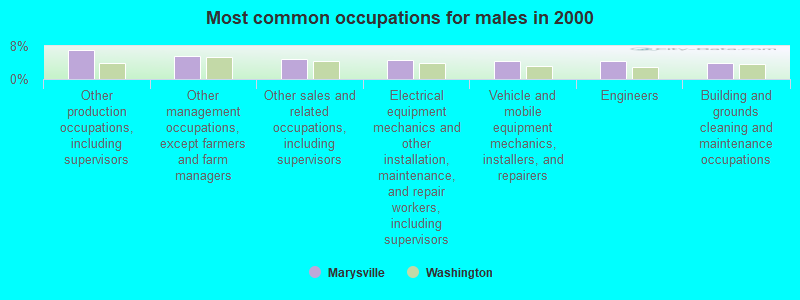
- Other production occupations, including supervisors (6.9%)
- Other management occupations, except farmers and farm managers (5.5%)
- Other sales and related occupations, including supervisors (4.9%)
- Electrical equipment mechanics and other installation, maintenance, and repair workers, including supervisors (4.6%)
- Vehicle and mobile equipment mechanics, installers, and repairers (4.4%)
- Engineers (4.2%)
- Building and grounds cleaning and maintenance occupations (3.9%)
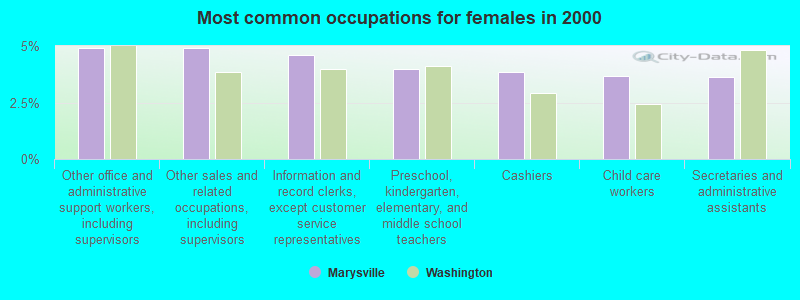
- Other office and administrative support workers, including supervisors (4.9%)
- Other sales and related occupations, including supervisors (4.9%)
- Information and record clerks, except customer service representatives (4.6%)
- Preschool, kindergarten, elementary, and middle school teachers (4.0%)
- Cashiers (3.8%)
- Child care workers (3.7%)
- Secretaries and administrative assistants (3.6%)
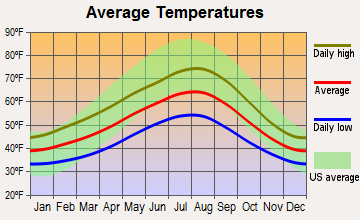
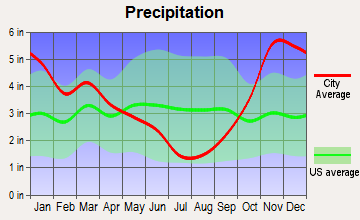
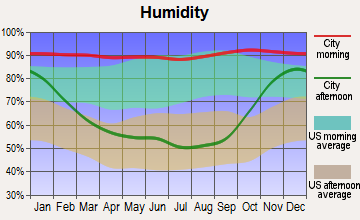
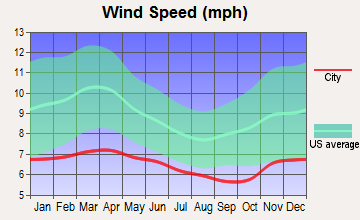
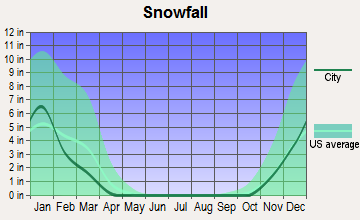
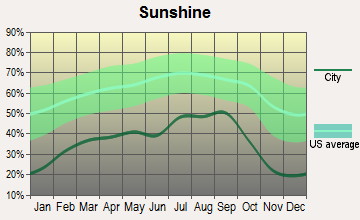
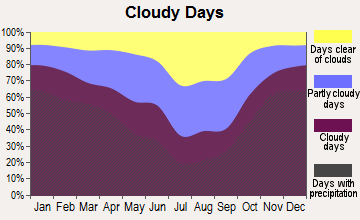
Average climate in Marysville, Washington
Based on data reported by over 4,000 weather stations
|
|


(lower is better)
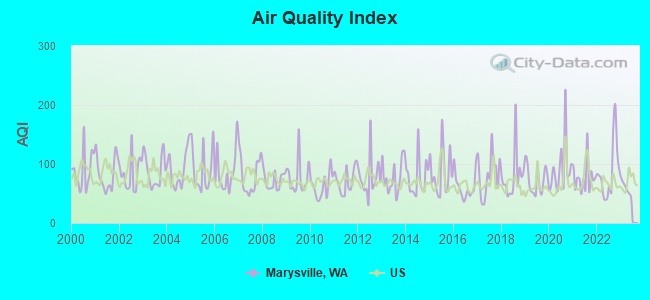
Air Quality Index (AQI) level in 2022 was 87.7. This is worse than average.
| City: | 87.7 |
| U.S.: | 72.6 |
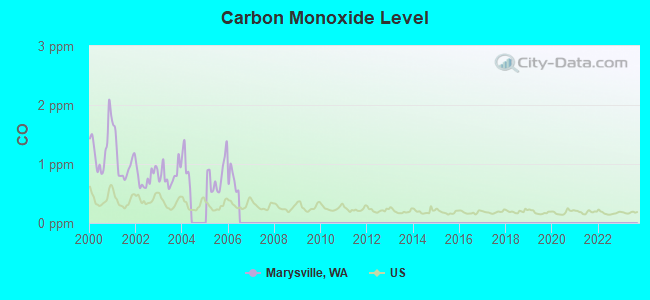
Carbon Monoxide (CO) [ppm] level in 2005 was 0.803. This is significantly worse than average. Closest monitor was 5.8 miles away from the city center.
| City: | 0.803 |
| U.S.: | 0.251 |
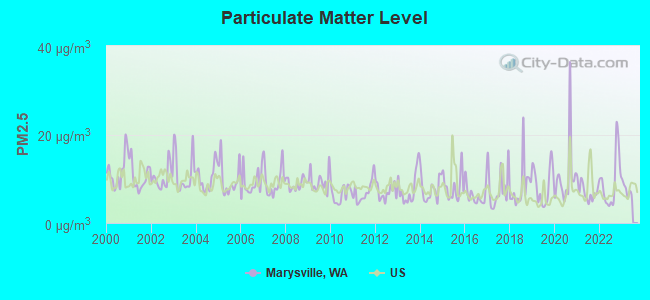
Particulate Matter (PM2.5) [µg/m3] level in 2022 was 9.29. This is about average. Closest monitor was 0.7 miles away from the city center.
| City: | 9.29 |
| U.S.: | 8.11 |
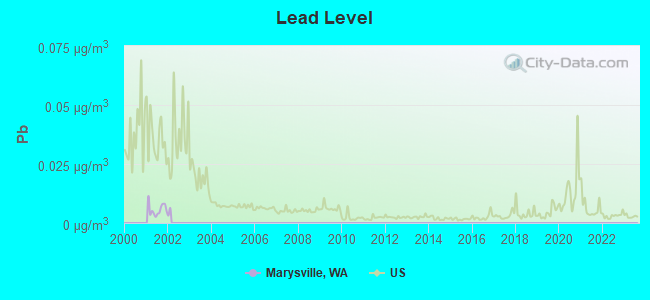
Lead (Pb) [µg/m3] level in 2001 was 0.00573. This is significantly better than average. Closest monitor was 22.0 miles away from the city center.
| City: | 0.00573 |
| U.S.: | 0.00931 |
Earthquake activity:
Marysville-area historical earthquake activity is significantly above Washington state average. It is 1189% greater than the overall U.S. average.On 4/13/1949 at 19:55:42, a magnitude 7.0 (7.0 UK, Class: Major, Intensity: VIII - XII) earthquake occurred 58.4 miles away from the city center, causing $80,000,000 total damage
On 2/28/2001 at 18:54:32, a magnitude 6.8 (6.8 MD, Depth: 32.2 mi, Class: Strong, Intensity: VII - IX) earthquake occurred 68.4 miles away from the city center
On 2/28/2001 at 18:54:32, a magnitude 6.8 (6.5 MB, 6.6 MS, 6.8 MW) earthquake occurred 70.0 miles away from the city center, causing $2,000,000,000 total damage and $305,000,000 insured losses
On 4/29/1965 at 15:28:43, a magnitude 6.6 (6.6 UK) earthquake occurred 52.2 miles away from the city center, causing $28,000,000 total damage
On 7/3/1999 at 01:43:54, a magnitude 5.8 (5.4 MB, 5.5 MS, 5.8 MW, 5.3 ME, Depth: 25.2 mi, Class: Moderate, Intensity: VI - VII) earthquake occurred 85.5 miles away from Marysville center
On 5/3/1996 at 04:04:22, a magnitude 5.5 (5.2 MB, 5.3 MD, 5.5 ML, Depth: 2.5 mi) earthquake occurred 25.0 miles away from the city center
Magnitude types: body-wave magnitude (MB), duration magnitude (MD), energy magnitude (ME), local magnitude (ML), surface-wave magnitude (MS), moment magnitude (MW)
Natural disasters:
The number of natural disasters in Snohomish County (31) is a lot greater than the US average (15).Major Disasters (Presidential) Declared: 27
Emergencies Declared: 2
Causes of natural disasters: Floods: 21, Storms: 17, Mudslides: 14, Landslides: 10, Winter Storms: 6, Winds: 5, Earthquakes: 2, Heavy Rain: 1, Hurricane: 1, Snow: 1, Tornado: 1, Volcanic Eruption: 1, Other: 1 (Note: some incidents may be assigned to more than one category).

Hospitals and medical centers in Marysville:
Heliports located in Marysville:
Amtrak stations near Marysville:
Colleges/universities with over 2000 students nearest to Marysville:
- Everett Community College (about 5 miles; Everett, WA; Full-time enrollment: 5,818)
- Edmonds Community College (about 19 miles; Lynnwood, WA; FT enrollment: 7,271)
- University of Washington-Bothell Campus (about 21 miles; Bothell, WA; FT enrollment: 3,902)
- Cascadia Community College (about 21 miles; Bothell, WA; FT enrollment: 2,238)
- Shoreline Community College (about 24 miles; Shoreline, WA; FT enrollment: 5,026)
- Lake Washington Institute of Technology (about 25 miles; Kirkland, WA; FT enrollment: 2,947)
- Seattle Community College-North Campus (about 27 miles; Seattle, WA; FT enrollment: 4,220)
Biggest public high schools in Marysville:
- TOTEM MIDDLE SCHOOL (Location: 1605 7TH ST, Grades: 6-9)
- MARYSVILLE MOUNTAIN VIEW HIGH SCHOOL (Location: 4317 76TH ST NE, Grades: 9-12)
- HERITAGE SCHOOL (Location: 7204 27TH AVE NE, Grades: 9-12)
- SCHOOL HOME PARTNERSHIP PROGRAM (Location: 4220 80TH ST NE, Grades: KG-12)
- MARYSVILLE SD SPECIAL (Location: 4220 80TH ST NE, Grades: PK-12)
- MARYSVILLE ARTS AND TECHNOLOGY HIGH SCHOOL (Location: 7204 27TH AVE NE, Grades: 9-12)
- MARYSVILLE PILCHUCK HIGH SCHOOL (Location: 5611 108TH STREET NE, Grades: 9-12)
- MARYSVILLE ON-LINE MOVE UP PROGRAM (Location: 4220 80TH STREET NE, Grades: 9-12)
- SCHOOL FOR THE ENTREPRENEUR (Location: 8301 84TH STREET NE, Grades: 9-12)
- INTL SCH OF COMMUNICATIONS (Location: 8301 84TH STREET NE, Grades: 9-12)
Private high school in Marysville:
Biggest public elementary/middle schools in Marysville:
- CASCADE ELEMENTARY (Location: 5200 100TH ST NE, Grades: KG-5)
- LIBERTY ELEMENTARY (Location: 1919 10TH ST, Grades: PK-5)
- MARYSVILLE MIDDLE SCHOOL (Location: 4923 67TH ST NE, Grades: 6-8)
- PINEWOOD ELEMENTARY (Location: 5115 84TH ST NE, Grades: KG-5)
- SHOULTES ELEMENTARY (Location: 13525 51ST AVE NE, Grades: KG-5)
- SUNNYSIDE ELEMENTARY (Location: 3707 SUNNYSIDE BLVD, Grades: KG-5)
- ALLEN CREEK ELEMENTARY SCHOOL (Location: 6505 60TH NE, Grades: PK-5)
- MARSHALL ELEMENTARY (Location: 4407 116TH ST NE, Grades: PK-5)
- KELLOGG MARSH ELEMENTARY SCHOOL (Location: 6325 91ST ST NE, Grades: PK-5)
- CEDARCREST SCHOOL (Location: 6400 88TH ST NE, Grades: 6-8)
Library in Marysville:
Points of interest:
Notable locations in Marysville: Cedar Crest Golf Course (A), Woodinville Town Center (B), Marysville Ash Avenue Park and Ride (C), Marysville I Park and Ride (D), Brookside Mobile Recreational Vehicle Park (E), Maryville Fred Meyer (F), Geddes Marina (G), Marysville Sewage Treatment Plant (H), Northwest Ambulance (I), Ken Baxter Senior Community Center (J), Grandview Village Retirement Community (K), Merrill Gardens at Marysville (L), Marysville Care Center (M), Madeleine Villa Health Care Center (N), Marysville Public Safety Building (O), Marysville Fire District / Snohomish County Fire District 12 Station 63 (P), Marysville Fire Department (Q), Marysville City Hall (R), Marysville Public Works (S), Marysville Municipal Court (T). Display/hide their locations on the map
Shopping Center: Town Center Mall (1). Display/hide its location on the map
Churches in Marysville include: Victory Foursquare Gospel Church (A), Marysville Christian Church (B), Kingdom Hall of Jehovahs Witnesses (C), Ninety - Second Street Church of Christ (D), Allen Creek Community Church (E), First Baptist Church (F), Judah Praise Center (G), Evergreen Unitarian Universalist Fellowship Church (H), Saint Philip's Episcopal Church (I). Display/hide their locations on the map
Reservoir: Marysville Sewage Lagoon (A). Display/hide its location on the map
Creeks: Jones Creek (A), Allen Creek (B), Munson Creek (C), West Fork Quilceda Creek (D). Display/hide their locations on the map
Tourist attraction: Norwesco Telephone Pioneer Museum (Cultural Attractions- Events- & Facilities; 1709 Grove Street) (1). Display/hide its approximate location on the map
Hotels: Comfort Inn Marysville (6311 33rd Avenue Northeast) (1), City Center Motel (810 State Avenue) (2), Best Western Tulalip Inn (3228 Marine Drive Northeast) (3). Display/hide their approximate locations on the map
Birthplace of: Patty Schemel - Rock drummer, Jack Metcalf - Politician, Joshua Reisman - College basketball player (BYU Cougars).
| This city: | 2.8 people |
| Washington: | 2.5 people |
| This city: | 72.4% |
| Whole state: | 64.4% |
| This city: | 8.1% |
| Whole state: | 7.7% |
Likely homosexual households (counted as self-reported same-sex unmarried-partner households)
- Lesbian couples: 0.4% of all households
- Gay men: 0.2% of all households
People in group quarters in Marysville in 2010:
- 224 people in other noninstitutional facilities
- 191 people in nursing facilities/skilled-nursing facilities
- 83 people in group homes intended for adults
- 43 people in workers' group living quarters and job corps centers
- 33 people in local jails and other municipal confinement facilities
- 25 people in residential treatment centers for adults
People in group quarters in Marysville in 2000:
- 122 people in other noninstitutional group quarters
- 98 people in nursing homes
- 28 people in homes or halfway houses for drug/alcohol abuse
- 19 people in local jails and other confinement facilities (including police lockups)
- 13 people in homes for the mentally retarded
Banks with most branches in Marysville (2011 data):
- KeyBank National Association: Quil Ceda Branch at 9226 34th Avenue Northeast, branch established on 2003/06/23; Marysville Branch at 1300 State Street, branch established on 1977/01/01. Info updated 2008/03/03: Bank assets: $86,198.8 mil, Deposits: $64,214.8 mil, headquarters in Cleveland, OH, positive income, Commercial Lending Specialization, 1067 total offices, Holding Company: Keycorp
- Opus Bank: Marysville Branch at 815 State St, branch established on 1916/01/01; North Marysville at 3711 88th St. Ne, branch established on 2000/04/25. Info updated 2011/11/08: Bank assets: $2,404.2 mil, Deposits: $1,831.2 mil, headquarters in Irvine, CA, negative income in the last year, Commercial Lending Specialization, 38 total offices
- Wells Fargo Bank, National Association: Downtown Marysville Branch at 1226 State Ave Pob 8, branch established on 1956/04/05; Marysville Branch at 10010 Shoultes Road, branch established on 1969/08/01. Info updated 2011/04/05: Bank assets: $1,161,490.0 mil, Deposits: $905,653.0 mil, headquarters in Sioux Falls, SD, positive income, 6395 total offices, Holding Company: Wells Fargo & Company
- Whidbey Island Bank: Marysville Office at 1031 State Avenue, branch established on 2002/07/01. Info updated 2010/09/27: Bank assets: $1,668.6 mil, Deposits: $1,471.8 mil, headquarters in Coupeville, WA, positive income, Commercial Lending Specialization, 32 total offices, Holding Company: Washington Banking Company
- U.S. Bank National Association: North Marysville Albertsons Branch at 11401 State Avenue, branch established on 1996/07/22. Info updated 2012/01/30: Bank assets: $330,470.8 mil, Deposits: $236,091.5 mil, headquarters in Cincinnati, OH, positive income, 3121 total offices, Holding Company: U.S. Bancorp
- JPMorgan Chase Bank, National Association: Marysville Branch at 1344 State Street, branch established on 1934/07/01. Info updated 2011/11/10: Bank assets: $1,811,678.0 mil, Deposits: $1,190,738.0 mil, headquarters in Columbus, OH, positive income, International Specialization, 5577 total offices, Holding Company: Jpmorgan Chase & Co.
- Washington Federal: Marysville Branch at 3617 88th Street Ne, branch established on 2004/11/30. Info updated 2011/12/19: Bank assets: $13,653.0 mil, Deposits: $8,905.8 mil, headquarters in Seattle, WA, positive income, Mortgage Lending Specialization, 174 total offices
- Union Bank, National Association: Marysville Branch at 1020 State Ave, branch established on 1979/01/18. Info updated 2011/09/01: Bank assets: $88,967.5 mil, Deposits: $65,286.4 mil, headquarters in San Francisco, CA, positive income, Commercial Lending Specialization, 403 total offices, Holding Company: Mitsubishi Ufj Financial Group, Inc.
- HomeStreet Bank: Marysville at 1238 State Avenue, branch established on 2001/01/02. Info updated 2010/08/31: Bank assets: $2,248.5 mil, Deposits: $2,011.6 mil, headquarters in Seattle, WA, positive income, Commercial Lending Specialization, 20 total offices
For population 15 years and over in Marysville:
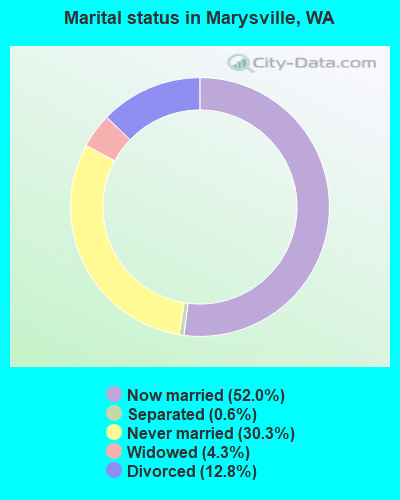
- Never married: 30.3%
- Now married: 52.0%
- Separated: 0.6%
- Widowed: 4.3%
- Divorced: 12.8%
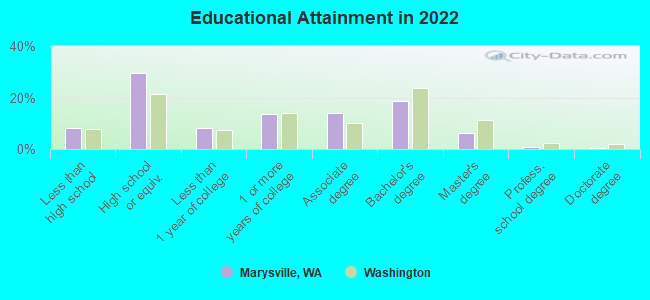
For population 25 years and over in Marysville:
- High school or higher: 91.9%
- Bachelor's degree or higher: 26.1%
- Graduate or professional degree: 7.5%
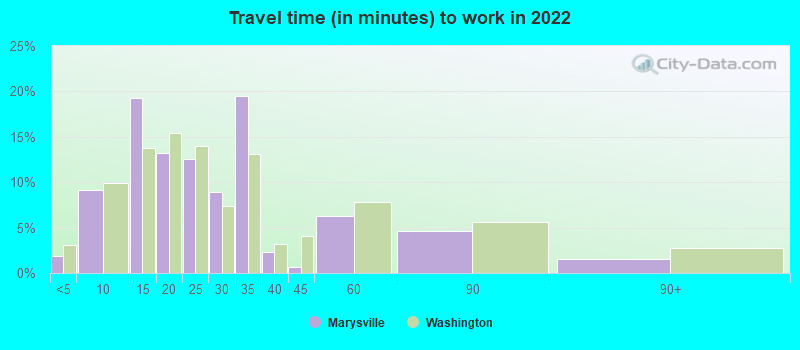
- Unemployed: 3.2%
- Mean travel time to work (commute): 27.9 minutes
| Here: | 9.5 |
| Washington average: | 11.6 |
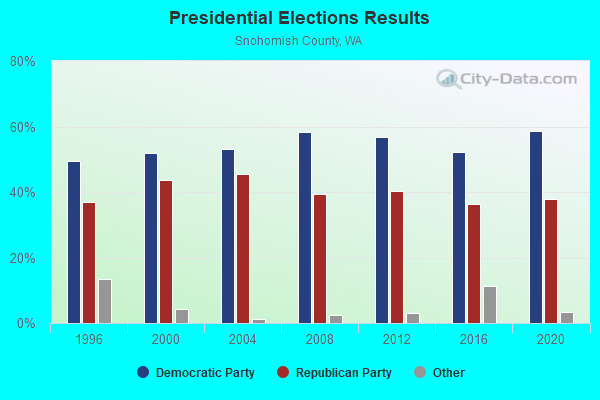
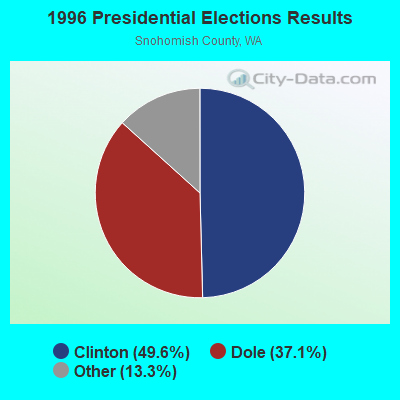
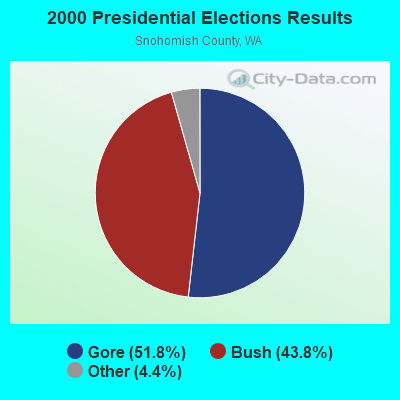
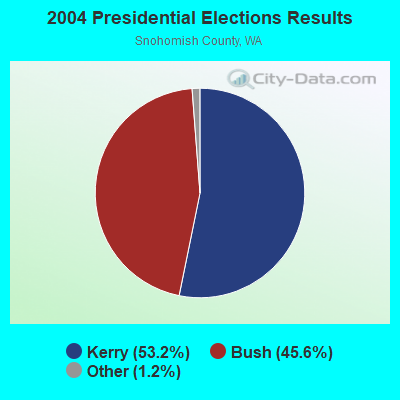
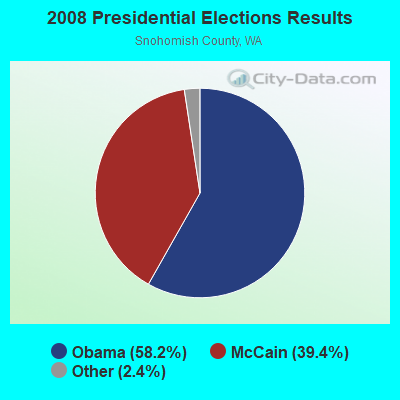

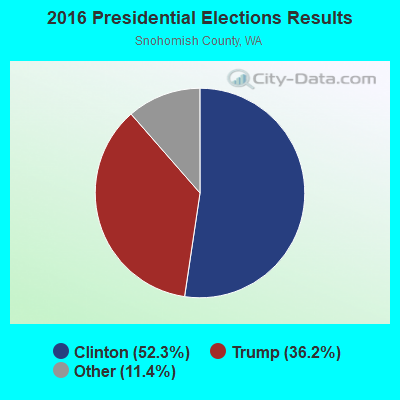
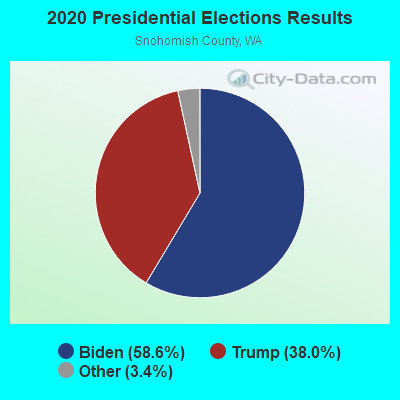
Graphs represent county-level data. Detailed 2008 Election Results
Religion statistics for Marysville, WA (based on Snohomish County data)
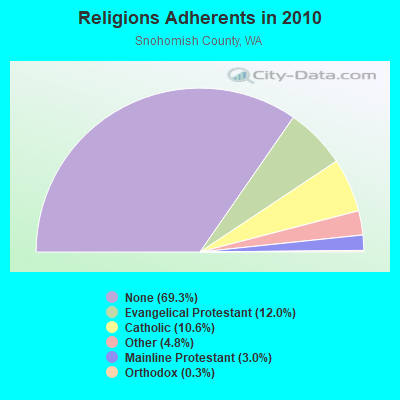
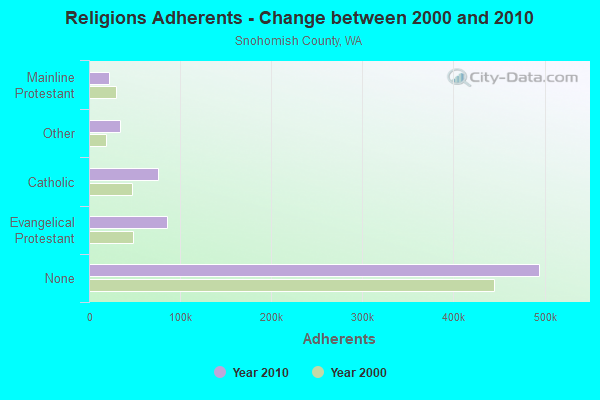
| Religion | Adherents | Congregations |
|---|---|---|
| Evangelical Protestant | 85,354 | 327 |
| Catholic | 75,393 | 16 |
| Other | 34,270 | 90 |
| Mainline Protestant | 21,642 | 71 |
| Orthodox | 1,943 | 6 |
| Black Protestant | 406 | 4 |
| None | 494,327 | - |
Food Environment Statistics:
| This county: | 1.79 / 10,000 pop. |
| Washington: | 2.06 / 10,000 pop. |
| Here: | 0.18 / 10,000 pop. |
| State: | 0.19 / 10,000 pop. |
| Here: | 1.42 / 10,000 pop. |
| Washington: | 1.18 / 10,000 pop. |
| This county: | 2.55 / 10,000 pop. |
| Washington: | 2.67 / 10,000 pop. |
| This county: | 6.95 / 10,000 pop. |
| State: | 8.26 / 10,000 pop. |
| Here: | 7.5% |
| State: | 7.7% |
| Snohomish County: | 27.4% |
| State: | 25.7% |
| Snohomish County: | 14.3% |
| Washington: | 13.9% |
Health and Nutrition:
| This city: | 49.4% |
| Washington: | 49.9% |
| This city: | 46.4% |
| Washington: | 47.2% |
| Marysville: | 28.5 |
| Washington: | 28.4 |
| Here: | 20.2% |
| State: | 20.9% |
| Marysville: | 10.4% |
| Washington: | 10.5% |
| This city: | 6.8 |
| State: | 6.8 |
| Marysville: | 33.1% |
| Washington: | 32.8% |
| This city: | 56.7% |
| State: | 56.8% |
| Marysville: | 79.5% |
| Washington: | 79.4% |
More about Health and Nutrition of Marysville, WA Residents
| Local government employment and payroll (March 2022) | |||||
| Function | Full-time employees | Monthly full-time payroll | Average yearly full-time wage | Part-time employees | Monthly part-time payroll |
|---|---|---|---|---|---|
| Police Protection - Officers | 70 | $786,164 | $134,771 | 0 | $0 |
| Other Government Administration | 28 | $266,262 | $114,112 | 10 | $25,969 |
| Other and Unallocable | 27 | $224,184 | $99,637 | 0 | $0 |
| Water Supply | 24 | $183,826 | $91,913 | 0 | $0 |
| Financial Administration | 20 | $165,094 | $99,056 | 0 | $0 |
| Judicial and Legal | 17 | $151,084 | $106,648 | 2 | $6,856 |
| Streets and Highways | 17 | $111,472 | $78,686 | 2 | $5,884 |
| Sewerage | 16 | $112,720 | $84,540 | 0 | $0 |
| Parks and Recreation | 14 | $113,866 | $97,599 | 7 | $3,054 |
| Correction | 13 | $107,842 | $99,546 | 0 | $0 |
| Police - Other | 12 | $80,184 | $80,184 | 4 | $15,744 |
| Solid Waste Management | 8 | $52,440 | $78,660 | 0 | $0 |
| Natural Resources | 3 | $28,756 | $115,024 | 0 | $0 |
| Totals for Government | 269 | $2,383,894 | $106,345 | 25 | $57,507 |
Marysville government finances - Expenditure in 2021 (per resident):
- Construction - General - Other: $27,893,000 ($385.93)
Regular Highways: $19,269,000 ($266.61)
Parks and Recreation: $2,652,000 ($36.69)
- Current Operations - Water Utilities: $31,870,000 ($440.95)
Police Protection: $15,722,000 ($217.53)
Solid Waste Management: $7,389,000 ($102.23)
Regular Highways: $5,810,000 ($80.39)
Local Fire Protection: $5,526,000 ($76.46)
Sewerage: $5,201,000 ($71.96)
General - Other: $4,597,000 ($63.60)
Central Staff Services: $4,370,000 ($60.46)
Parks and Recreation: $2,857,000 ($39.53)
Correctional Institutions: $2,810,000 ($38.88)
Judicial and Legal Services: $1,555,000 ($21.52)
Natural Resources - Other: $986,000 ($13.64)
Financial Administration: $669,000 ($9.26)
Health - Other: $636,000 ($8.80)
Corrections - Other: $263,000 ($3.64)
General Public Buildings: $38,000 ($0.53)
- General - Interest on Debt: $3,011,000 ($41.66)
- Other Capital Outlay - Sewerage: $3,693,000 ($51.10)
Natural Resources - Other: $1,048,000 ($14.50)
Water Utilities: $65,000 ($0.90)
Regular Highways: $61,000 ($0.84)
Central Staff Services: $52,000 ($0.72)
Parks and Recreation: $6,000 ($0.08)
- Total Salaries and Wages: $30,714,000 ($424.96)
- Water Utilities - Interest on Debt: $885,000 ($12.24)
Marysville government finances - Revenue in 2021 (per resident):
- Charges - Sewerage: $20,453,000 ($282.99)
Solid Waste Management: $8,031,000 ($111.12)
Other: $4,171,000 ($57.71)
Parks and Recreation: $1,160,000 ($16.05)
Regular Highways: $97,000 ($1.34)
- Federal Intergovernmental - Housing and Community Development: $433,000 ($5.99)
Other: $57,000 ($0.79)
- Local Intergovernmental - Other: $605,000 ($8.37)
- Miscellaneous - Interest Earnings: $1,621,000 ($22.43)
Rents: $564,000 ($7.80)
Fines and Forfeits: $489,000 ($6.77)
General Revenue - Other: $311,000 ($4.30)
Special Assessments: $173,000 ($2.39)
Donations From Private Sources: $66,000 ($0.91)
- Revenue - Water Utilities: $12,692,000 ($175.61)
- State Intergovernmental - Other: $6,330,000 ($87.58)
Highways: $2,171,000 ($30.04)
General Local Government Support: $972,000 ($13.45)
- Tax - General Sales and Gross Receipts: $19,499,000 ($269.79)
Property: $14,932,000 ($206.60)
Public Utilities Sales: $7,484,000 ($103.55)
Other License: $6,066,000 ($83.93)
Documentary and Stock Transfer: $4,176,000 ($57.78)
Amusements Sales: $206,000 ($2.85)
Occupation and Business License - Other: $184,000 ($2.55)
Other Selective Sales: $69,000 ($0.95)
Marysville government finances - Debt in 2021 (per resident):
- Long Term Debt - Outstanding Unspecified Public Purpose: $117,325,000 ($1623.31)
Beginning Outstanding - Unspecified Public Purpose: $112,124,000 ($1551.35)
Issue, Unspecified Public Purpose: $18,670,000 ($258.32)
Retired Unspecified Public Purpose: $13,469,000 ($186.36)
7.60% of this county's 2021 resident taxpayers lived in other counties in 2020 ($97,930 average adjusted gross income)
| Here: | 7.60% |
| Washington average: | 7.53% |
0.04% of residents moved from foreign countries ($285 average AGI)
Snohomish County: 0.04% Washington average: 0.05%
Top counties from which taxpayers relocated into this county between 2020 and 2021:
| from King County, WA | |
| from Pierce County, WA | |
| from Skagit County, WA |
7.20% of this county's 2020 resident taxpayers moved to other counties in 2021 ($85,049 average adjusted gross income)
| Here: | 7.20% |
| Washington average: | 7.40% |
0.02% of residents moved to foreign countries ($153 average AGI)
Snohomish County: 0.02% Washington average: 0.04%
Top counties to which taxpayers relocated from this county between 2020 and 2021:
| to King County, WA | |
| to Pierce County, WA | |
| to Skagit County, WA |
| Businesses in Marysville, WA | ||||
| Name | Count | Name | Count | |
|---|---|---|---|---|
| 7-Eleven | 3 | Kmart | 1 | |
| AT&T | 2 | Kohl's | 1 | |
| Ace Hardware | 1 | Kroger | 2 | |
| Albertsons | 2 | Little Caesars Pizza | 2 | |
| Applebee's | 1 | Marshalls | 1 | |
| Arby's | 1 | MasterBrand Cabinets | 3 | |
| AutoZone | 1 | McDonald's | 4 | |
| Baskin-Robbins | 1 | Nike | 4 | |
| Bath & Body Works | 1 | Office Depot | 1 | |
| Best Western | 1 | Papa John's Pizza | 1 | |
| Blockbuster | 2 | Payless | 2 | |
| Burger King | 2 | Penske | 1 | |
| Carl\s Jr. | 1 | PetSmart | 1 | |
| Chevrolet | 1 | Pizza Hut | 2 | |
| Circle K | 1 | Quiznos | 1 | |
| Cold Stone Creamery | 1 | RadioShack | 1 | |
| Comfort Inn | 1 | Red Robin | 1 | |
| Costco | 1 | Rite Aid | 2 | |
| Curves | 2 | Sears | 1 | |
| Dairy Queen | 1 | Sprint Nextel | 2 | |
| Discount Tire | 1 | Staples | 1 | |
| Domino's Pizza | 1 | Starbucks | 6 | |
| Famous Footwear | 1 | Subaru | 1 | |
| Fashion Bug | 1 | Subway | 4 | |
| FedEx | 4 | T-Mobile | 2 | |
| Ford | 1 | Taco Bell | 3 | |
| GNC | 2 | Target | 1 | |
| H&R Block | 2 | U-Haul | 2 | |
| Holiday Inn | 1 | UPS | 8 | |
| Home Depot | 1 | Vans | 1 | |
| IHOP | 1 | Verizon Wireless | 2 | |
| JCPenney | 1 | Vons | 1 | |
| Jack In The Box | 2 | Wendy's | 1 | |
| Jamba Juice | 1 | YMCA | 1 | |
| KFC | 1 | |||
Strongest AM radio stations in Marysville:
- KRKO (1380 AM; 50 kW; EVERETT, WA; Owner: S-R BROADCASTING, CO.)
- KIXI (880 AM; 50 kW; MERCER ISLAND/SEATTL, WA; Owner: BELLEVUE RADIO, INC.)
- KKOL (1300 AM; 50 kW; SEATTLE, WA; Owner: INSPIRATION MEDIA, INC.)
- KIRO (710 AM; 50 kW; SEATTLE, WA; Owner: ENTERCOM SEATTLE LICENSE, LLC)
- KGNW (820 AM; 50 kW; BURIEN-SEATTLE, WA; Owner: INSPIRATION MEDIA, INC.)
- KTTH (770 AM; 50 kW; SEATTLE, WA; Owner: ENTERCOM SEATTLE LICENSE, LLC)
- KOMO (1000 AM; 50 kW; SEATTLE, WA; Owner: FISHER BROADCASTING - SEATTLE RADIO, L.L.C.)
- KYCW (1090 AM; 50 kW; SEATTLE, WA; Owner: INFINITY RADIO SUBSIDIARY OPERATIONS INC.)
- KAPS (660 AM; 10 kW; MOUNT VERNON, WA; Owner: VALLEY BROADCASTERS, INC.)
- KWYZ (1230 AM; 1 kW; EVERETT, WA; Owner: RADIO HANKOOK, INC.)
- KJR (950 AM; 50 kW; SEATTLE, WA)
- KCIS (630 AM; 5 kW; EDMONDS, WA; Owner: CRISTA MINISTRIES)
- KRPI (1550 AM; 50 kW; FERNDALE, WA; Owner: BBC BROADCASTING, INC.)
Strongest FM radio stations in Marysville:
- KSER (90.7 FM; EVERETT, WA; Owner: KSER FOUNDATION)
- K205DL (88.9 FM; GRANITE FALLS/EVERET, WA; Owner: CALVARY CHAPEL OF TWIN FALLS, INC.)
- KISW (99.9 FM; SEATTLE, WA; Owner: ENTERCOM SEATTLE LICENSE, LLC)
- KQBZ (100.7 FM; SEATTLE, WA; Owner: ENTERCOM SEATTLE LICENSE, LLC)
- K206CU (89.1 FM; MOUNT VERNON, WA; Owner: CALVARY CHAPEL OF TWIN FALLS, INC.)
- KCMS (105.3 FM; EDMONDS, WA; Owner: CRISTA MINISTRIES, INC.)
- KMTT (103.7 FM; TACOMA, WA; Owner: ENTERCOM SEATTLE LICENSE, LLC)
- KNDD (107.7 FM; SEATTLE, WA; Owner: ENTERCOM SEATTLE LICENSE, LLC)
- KYPT (96.5 FM; SEATTLE, WA; Owner: INFINITY RADIO SUBSIDIARY OPERATIONS INC.)
- KSVR (91.7 FM; MOUNT VERNON, WA; Owner: BOARD OF TRUSTEES OF SKAGIT VALLEY COLLEGE)
- KBSG-FM (97.3 FM; TACOMA, WA; Owner: ENTERCOM SEATTLE LICENSE, LLC)
- KZOK-FM (102.5 FM; SEATTLE, WA; Owner: INFINITY RADIO SUBSIDIARY OPERATIONS INC.)
- KBKS (106.1 FM; TACOMA, WA; Owner: INFINITY RADIO SUBSIDIARY OPERATIONS INC.)
- KING-FM (98.1 FM; SEATTLE, WA; Owner: CLASSIC RADIO, INC.)
- KLSY-FM (92.5 FM; BELLEVUE, WA; Owner: BELLEVUE RADIO INC.)
- KPLU-FM (88.5 FM; TACOMA, WA; Owner: PACIFIC LUTHERAN UNIVERSITY, INC.)
- KWJZ (98.9 FM; SEATTLE, WA; Owner: ORCA RADIO, INC.)
- KMPS-FM (94.1 FM; SEATTLE, WA; Owner: INFINITY RADIO SUBSIDIARY OPERATIONS INC.)
- K213BM (90.5 FM; EVERETT, ETC., WA; Owner: JACK STRAW FOUNDATION)
- KRWM (106.9 FM; BREMERTON, WA; Owner: SEASCAPE RADIO, INC.)
TV broadcast stations around Marysville:
- K58BW (Channel 58; EVERETT, WA; Owner: KIRO-TV HOLDINGS, INC.)
- KING-TV (Channel 5; SEATTLE, WA; Owner: KING BROADCASTING COMPANY)
- KSTW (Channel 11; TACOMA, WA; Owner: UPN TELEVISION STATIONS INC.)
- K29ED (Channel 29; EVERETT, WA; Owner: TRIBUNE TELEVISION HOLDINGS, INC.)
- K58DP (Channel 58; SEATTLE, WA; Owner: WORD OF GOD FELLOWSHIP, INC.)
- KTWB-TV (Channel 22; SEATTLE, WA; Owner: TRIBUNE TELEVISION HOLDINGS, INC.)
- KOMO-TV (Channel 4; SEATTLE, WA; Owner: FISHER BROADCASTING - SEATTLE TV, L.L.C.)
- KIRO-TV (Channel 7; SEATTLE, WA; Owner: KIRO-TV HOLDINGS, INC.)
- KCTS-TV (Channel 9; SEATTLE, WA; Owner: KCTS TELEVISION)
- KHCV (Channel 45; SEATTLE, WA; Owner: NORTH PACIFIC INTERNATIONAL TELEVISION, INC.)
- KWPX (Channel 33; BELLEVUE, WA; Owner: PAXSON COMMUNICATIONS LICENSE COMPANY, LLC)
- K57HB (Channel 57; EUREKA, CA; Owner: MS COMMUNICATIONS, LLC)
- KONG-TV (Channel 16; EVERETT, WA; Owner: KONG-TV, INC.)
- National Bridge Inventory (NBI) Statistics
- 32Number of bridges
- 1,227ft / 374mTotal length
- $319,433,000Total costs
- 1,373,619Total average daily traffic
- 103,072Total average daily truck traffic
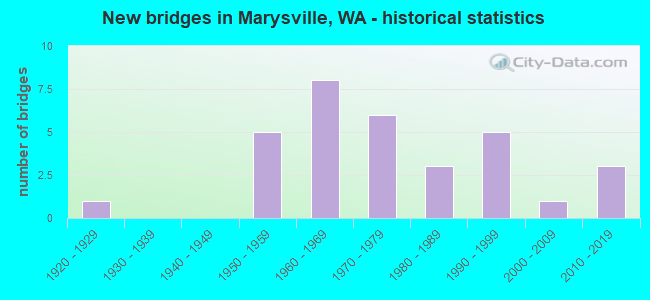
- New bridges - historical statistics
- 11920-1929
- 51950-1959
- 81960-1969
- 61970-1979
- 31980-1989
- 51990-1999
- 12000-2009
- 32010-2019
FCC Registered Broadcast Land Mobile Towers: 38 (See the full list of FCC Registered Broadcast Land Mobile Towers in Marysville, WA)
FCC Registered Microwave Towers: 19 (See the full list of FCC Registered Microwave Towers in this town)
FCC Registered Paging Towers: 1 (See the full list of FCC Registered Paging Towers)
FCC Registered Maritime Coast & Aviation Ground Towers: 2 (See the full list of FCC Registered Maritime Coast & Aviation Ground Towers)
FCC Registered Amateur Radio Licenses: 537 (See the full list of FCC Registered Amateur Radio Licenses in Marysville)
FAA Registered Aircraft: 55 (See the full list of FAA Registered Aircraft in Marysville)
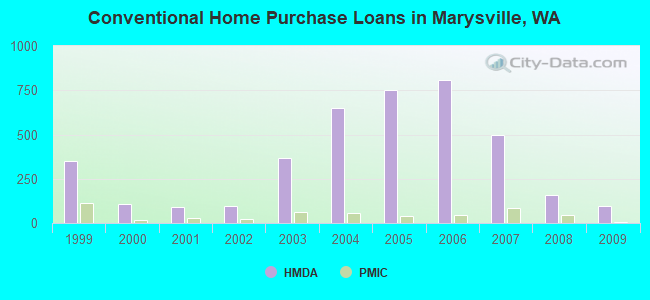
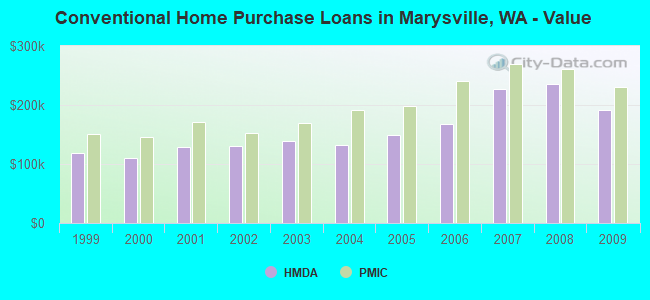
| Home Mortgage Disclosure Act Aggregated Statistics For Year 2009 (Based on 2 full and 10 partial tracts) | ||||||||||||||
| A) FHA, FSA/RHS & VA Home Purchase Loans | B) Conventional Home Purchase Loans | C) Refinancings | D) Home Improvement Loans | E) Loans on Dwellings For 5+ Families | F) Non-occupant Loans on < 5 Family Dwellings (A B C & D) | G) Loans On Manufactured Home Dwelling (A B C & D) | ||||||||
|---|---|---|---|---|---|---|---|---|---|---|---|---|---|---|
| Number | Average Value | Number | Average Value | Number | Average Value | Number | Average Value | Number | Average Value | Number | Average Value | Number | Average Value | |
| LOANS ORIGINATED | 214 | $238,544 | 94 | $190,949 | 587 | $221,958 | 13 | $106,414 | 6 | $674,182 | 50 | $188,004 | 11 | $125,957 |
| APPLICATIONS APPROVED, NOT ACCEPTED | 15 | $238,180 | 11 | $180,025 | 70 | $231,435 | 3 | $70,907 | 0 | $0 | 5 | $146,688 | 2 | $133,410 |
| APPLICATIONS DENIED | 27 | $244,401 | 22 | $167,836 | 218 | $232,021 | 15 | $108,234 | 1 | $401,440 | 14 | $194,235 | 7 | $87,094 |
| APPLICATIONS WITHDRAWN | 25 | $241,682 | 12 | $221,491 | 177 | $248,234 | 4 | $125,570 | 0 | $0 | 9 | $208,150 | 1 | $236,870 |
| FILES CLOSED FOR INCOMPLETENESS | 3 | $226,003 | 1 | $351,060 | 39 | $246,776 | 2 | $64,415 | 0 | $0 | 2 | $333,620 | 1 | $110,960 |
Detailed mortgage data for all 9 tracts in Marysville, WA
| Private Mortgage Insurance Companies Aggregated Statistics For Year 2009 (Based on 2 full and 10 partial tracts) | ||||||
| A) Conventional Home Purchase Loans | B) Refinancings | C) Non-occupant Loans on < 5 Family Dwellings (A & B) | ||||
|---|---|---|---|---|---|---|
| Number | Average Value | Number | Average Value | Number | Average Value | |
| LOANS ORIGINATED | 6 | $231,317 | 11 | $259,289 | 0 | $0 |
| APPLICATIONS APPROVED, NOT ACCEPTED | 2 | $194,770 | 7 | $243,417 | 0 | $0 |
| APPLICATIONS DENIED | 3 | $212,003 | 6 | $233,157 | 0 | $0 |
| APPLICATIONS WITHDRAWN | 1 | $201,380 | 2 | $213,885 | 0 | $0 |
| FILES CLOSED FOR INCOMPLETENESS | 1 | $141,750 | 0 | $0 | 1 | $141,750 |
2002 - 2018 National Fire Incident Reporting System (NFIRS) incidents
- Fire incident types reported to NFIRS in Marysville, WA
- 1,48840.4%Structure Fires
- 1,42238.6%Outside Fires
- 53614.5%Mobile Property/Vehicle Fires
- 2396.5%Other
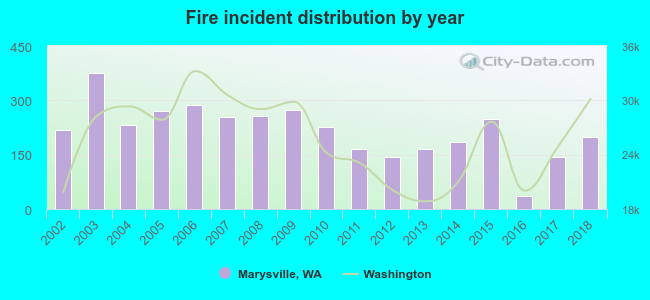 According to the data from the years 2002 - 2018 the average number of fires per year is 217. The highest number of reported fires - 375 took place in 2003, and the least - 37 in 2016. The data has a dropping trend.
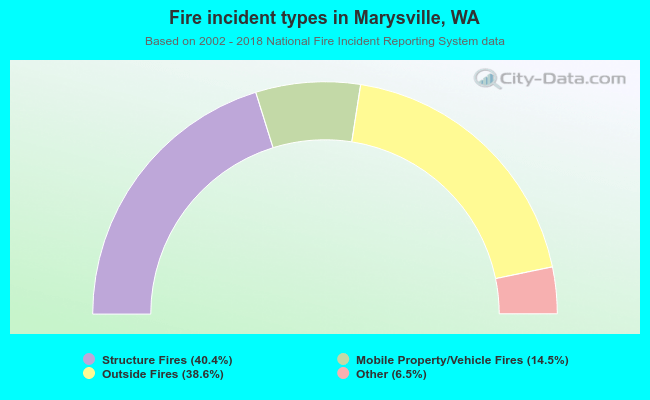 When looking into fire subcategories, the most reports belonged to: Structure Fires (40.4%), and Outside Fires (38.6%).
Fire-safe hotels and motels in Marysville, Washington:
- The Village Motor Inn, 235 Beech St, Marysville, Washington 98270 , Phone: (360) 659-0005, Fax: (360) 658-0866
- Holiday Inn Express Hotel And Suites Marysville Wa, 8606 36th Ave NE, Marysville, Washington 98270 , Phone: (360) 530-1234, Fax: (360) 530-1235
- Home2 Suites by Hilton Marysville, 4070 116th St NE, Marysville, Washington 98271 , Phone: (360) 658-2900, Fax: (360) 658-2901
- Navy Lodge Everett, 14320 45th Ave NE, Marysville, Washington 98271 , Phone: (360) 653-6390
- Quality Inn - Marysville/Tulalip, 6311 33RD Ave NE, Marysville, Washington 98271 , Phone: (360) 658-1339, Fax: (360) 658-9355
| Most common first names in Marysville, WA among deceased individuals | ||
| Name | Count | Lived (average) |
|---|---|---|
| Robert | 210 | 72.2 years |
| John | 185 | 75.8 years |
| William | 164 | 75.4 years |
| Mary | 132 | 79.6 years |
| James | 128 | 71.5 years |
| Charles | 125 | 74.6 years |
| George | 119 | 78.3 years |
| Dorothy | 105 | 80.0 years |
| Helen | 96 | 80.5 years |
| Margaret | 94 | 78.0 years |
| Most common last names in Marysville, WA among deceased individuals | ||
| Last name | Count | Lived (average) |
|---|---|---|
| Johnson | 115 | 77.9 years |
| Smith | 84 | 78.2 years |
| Anderson | 77 | 77.7 years |
| Jones | 58 | 70.1 years |
| Brown | 57 | 79.5 years |
| Olson | 51 | 77.3 years |
| Miller | 49 | 75.8 years |
| Nelson | 47 | 77.7 years |
| Williams | 40 | 75.8 years |
| Wilson | 39 | 78.6 years |
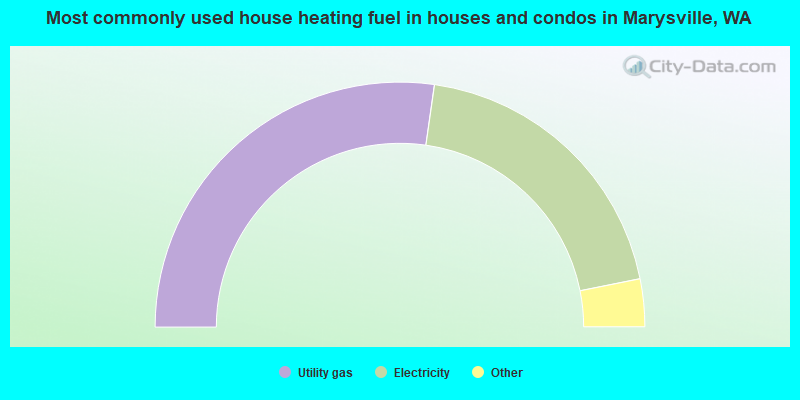
- 54.5%Utility gas
- 39.2%Electricity
- 2.5%Wood
- 2.3%Bottled, tank, or LP gas
- 0.5%No fuel used
- 0.5%Other fuel
- 0.3%Fuel oil, kerosene, etc.
- 0.2%Solar energy
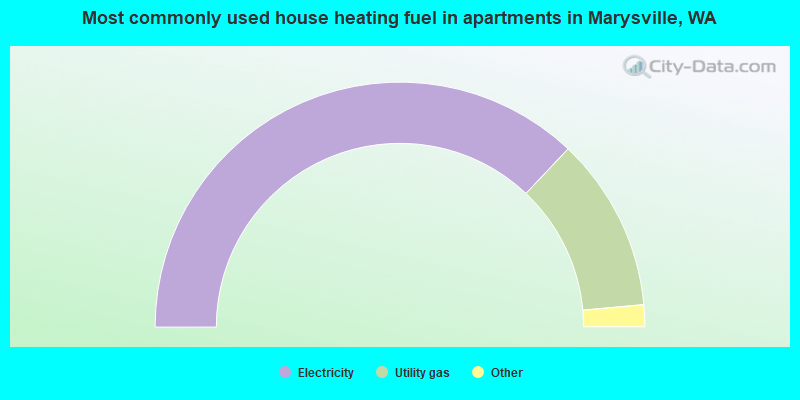
- 74.1%Electricity
- 23.0%Utility gas
- 1.4%Bottled, tank, or LP gas
- 0.8%Fuel oil, kerosene, etc.
- 0.5%Wood
- 0.3%No fuel used
Marysville compared to Washington state average:
- Unemployed percentage significantly below state average.
- Hispanic race population percentage significantly above state average.
- Foreign-born population percentage significantly above state average.
- Length of stay since moving in below state average.
- Number of college students above state average.
Marysville on our top lists:
- #2 on the list of "Top 101 cities with the lowest maximum monthly sunshine amount (population 50,000+)"
- #2 on the list of "Top 101 cities with the lowest average sunshine amount (population 50,000+)"
- #2 on the list of "Top 101 cities with the lowest minimum monthly sunshine amount (population 50,000+)"
- #7 on the list of "Top 101 cities with the lowest average wind speeds (population 50,000+)"
- #12 on the list of "Top 101 cities with the largest percentage population increase from 2000 (population 50,000+)"
- #13 on the list of "Top 101 cities with largest percentage of females in occupations: installation, maintenance, and repair occupations (population 50,000+)"
- #15 on the list of "Top 101 cities with the largest city-data.com crime index per police officer (population 50,000+)"
- #18 on the list of "Top 101 cities with largest percentage population increases in the 1990s) (population 50,000+)"
- #18 on the list of "Top 101 cities with the lowest number of police officers per 1000 residents (population 50,000+)"
- #19 on the list of "Top 101 cities with the largest city-data.com crime index increase from 2002 to 2012 (population 50,000+)"
- #19 on the list of "Top 100 fastest growing cities from 2000 to 2014 (pop. 50,000+)"
- #21 on the list of "Top 100 low-educated but high-earning cities (pop. 50,000+)"
- #25 on the list of "Top 101 cities with largest percentage of males in industries: manufacturing (population 50,000+)"
- #26 on the list of "Top 101 cities with largest percentage of females in occupations: healthcare support occupations (population 50,000+)"
- #26 on the list of "Top 101 cities with the least people having Doctorate degrees (population 50,000+)"
- #30 on the list of "Top 101 cities with largest percentage of males in occupations: installation, maintenance, and repair occupations (population 50,000+)"
- #32 on the list of "Top 101 cities with the highest number of rapes per 100,000 residents, excludes tourist destinations and others with a lot of outsiders visiting based on city industries data (population 50,000+)"
- #32 on the list of "Top 101 cities with the highest average humidity (population 50,000+)"
- #43 on the list of "Top 101 cities with largest percentage of males in occupations: architecture and engineering occupations (population 50,000+)"
- #43 on the list of "Top 101 cities with the lowest number of murders per 100,000 residents (population 50,000+)"
- #24 on the list of "Top 101 counties with the lowest Particulate Matter (PM2.5) Annual air pollution readings in 2012 (µg/m3)"
- #45 on the list of "Top 101 counties with the lowest number of infant deaths per 1000 residents 2007-2013 (pop. 50,000+)"
- #46 on the list of "Top 101 counties with the highest percentage of residents that exercised in the past month"
- #48 on the list of "Top 101 counties with the highest average weight of females"
- #60 on the list of "Top 101 counties with the most Other congregations (pop. 50,000+)"

|
|
Total of 259 patent applications in 2008-2024.