Medford, NY (New York) Houses and Residents
| Medford: | $454,639 |
| New York: | $400,400 |
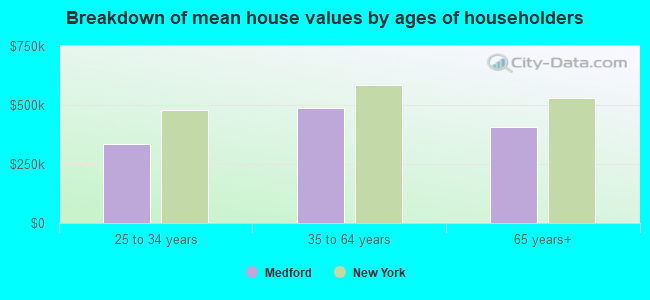
Mean price in 2022:
Detached houses: $462,622
Here: $462,622 State: $476,719 Townhouses or other attached units: $385,171
Here: $385,171 State: $699,270 In 2-unit structures: $361,151
Here: $361,151 State: $713,077 In 3-to-4-unit structures: $173,088
Here: $173,088 State: $764,568 In 5-or-more-unit structures: $268,097
Here: $268,097 State: $912,009 Mobile homes: $473,313
Here: $473,313 State: $88,925
Total population: 24,142 (Urban population: 21,985, Rural population: 0)
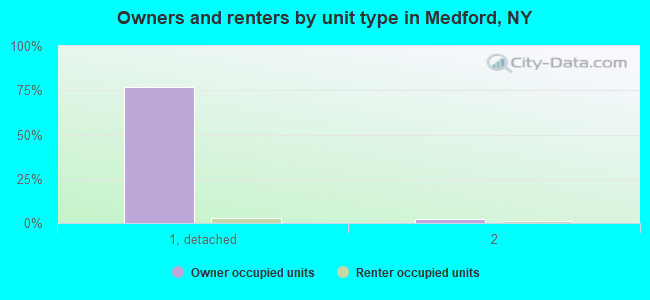
Houses: 8,253 (8,092 occupied: 7,386 owner occupied, 702 renter occupied)
| % of renters here: | 9% |
| State: | 46% |
Housing density: 784 houses/condos per square mile
Median price asked for vacant for-sale houses and condos in 2022 in this county: $940,353.
Median contract rent in 2022: over $2,000 (lower quartile is $1,444, upper quartile is over $2,000)
Median rent asked for vacant for-rent units in 2022: $2,724
Median gross rent in Medford, NY in 2022: over $2,000
Housing units in Medford with a mortgage: 4,649 (473 second mortgage, 0 home equity loan, 327 both second mortgage and home equity loan)
Houses without a mortgage: 138
Median household income for houses/condos with a mortgage: $140,717
Median household income for apartments without a mortgage: $65,907
Median monthly housing costs: $2,270
Compare current foreclosures in Medford, NY:
| Photo | Address | Area | Beds / Baths | Price | Details |
|---|---|---|---|---|---|

|
#1
Falcon Ave
Medford, NY 11763
|
- sq. feet
|
1 baths 3 beds |
$409,900
|
show details |

|
#2
Oswego Ave
Medford, NY 11763
|
1,521 sq. feet
|
2 baths 4 beds |
show details | |

|
#3
Balsam Dr
Medford, NY 11763
|
1,382 sq. feet
|
2 baths 3 beds |
show details | |

|
#4
Gull Ave
Medford, NY 11763
|
1,255 sq. feet
|
1 baths 4 beds |
show details | |

|
#5
Nevada Ave
Medford, NY 11763
|
1,830 sq. feet
|
2 baths 3 beds |
show details | |

|
#6
Chestnut Ave
Medford, NY 11763
|
1,106 sq. feet
|
1 baths 3 beds |
show details | |

|
#7
Mill Ln
Medford, NY 11763
|
- sq. feet
|
2 baths 4 beds |
show details | |

|
#8
Station Rd
Medford, NY 11763
|
- sq. feet
|
- baths - beds |
show details | |

|
#9
Maine Ave
Medford, NY 11763
|
- sq. feet
|
- baths - beds |
show details | |

|
#10
Country Rd
Medford, NY 11763
|
- sq. feet
|
- baths - beds |
show details |
| Photo | Address | Area | Beds / Baths | Price | Details |
|---|---|---|---|---|---|

|
#11
Birchwood Rd
Medford, NY 11763
|
- sq. feet
|
- baths - beds |
show details | |

|
#12
Blue Ridge Dr
Medford, NY 11763
|
- sq. feet
|
- baths - beds |
show details | |

|
#13
Falcon Ave
Medford, NY 11763
|
- sq. feet
|
- baths - beds |
show details | |

|
#14
Pinegrove Ave
Medford, NY 11763
|
- sq. feet
|
- baths - beds |
show details | |

|
#15
Southaven Ave
Medford, NY 11763
|
- sq. feet
|
- baths - beds |
show details | |

|
#16
Newport Ave
Medford, NY 11763
|
- sq. feet
|
- baths - beds |
show details | |

|
#17
Pinegrove Ave
Medford, NY 11763
|
- sq. feet
|
- baths - beds |
show details | |

|
#18
Barbara Ln
Medford, NY 11763
|
- sq. feet
|
- baths - beds |
show details | |

|
#19
Newport Ave
Medford, NY 11763
|
- sq. feet
|
- baths - beds |
show details | |

|
#20
Heather Ave
Medford, NY 11763
|
- sq. feet
|
- baths - beds |
show details |
| Photo | Address | Area | Beds / Baths | Price | Details |
|---|---|---|---|---|---|

|
#21
Jamaica Ave
Medford, NY 11763
|
- sq. feet
|
- baths - beds |
show details | |

|
#22
Eagle Ave
Medford, NY 11763
|
- sq. feet
|
- baths - beds |
show details | |

|
#23
Smith Ln
Medford, NY 11763
|
- sq. feet
|
- baths - beds |
show details | |

|
#24
Blue Ridge Dr
Medford, NY 11763
|
- sq. feet
|
- baths - beds |
show details | |

|
#25
Fordham Ave
Medford, NY 11763
|
- sq. feet
|
- baths - beds |
show details | |

|
#26
Middle Line Ave
Medford, NY 11763
|
- sq. feet
|
- baths - beds |
show details | |

|
#27
Robinson Ave
Medford, NY 11763
|
- sq. feet
|
- baths - beds |
show details | |

|
#28
Devon Ave
Medford, NY 11763
|
- sq. feet
|
- baths - beds |
show details | |

|
#29
Cedar Ln
Medford, NY 11763
|
- sq. feet
|
- baths - beds |
show details | |

|
#30
John Roe Smith Ave
Medford, NY 11763
|
- sq. feet
|
- baths - beds |
show details |
| Photo | Address | Area | Beds / Baths | Price | Details |
|---|---|---|---|---|---|

|
#31
Mount Vernon Ave
Medford, NY 11763
|
- sq. feet
|
- baths - beds |
show details | |

|
#32
Fairmont Ave
Medford, NY 11763
|
- sq. feet
|
- baths - beds |
show details | |

|
#33
Birchwood Rd
Medford, NY 11763
|
- sq. feet
|
- baths - beds |
show details | |

|
#34
Richmond Ave
Medford, NY 11763
|
- sq. feet
|
- baths - beds |
show details | |

|
#35
Sipp Ave
Medford, NY 11763
|
- sq. feet
|
- baths - beds |
show details | |

|
#36
W End Dr
Medford, NY 11763
|
- sq. feet
|
- baths - beds |
show details | |

|
#37
Wilson Ave
Medford, NY 11763
|
- sq. feet
|
- baths - beds |
show details | |

|
#38
Jamaica Ave
Medford, NY 11763
|
- sq. feet
|
- baths - beds |
show details | |

|
#39
N Dunton Ave
Medford, NY 11763
|
- sq. feet
|
- baths - beds |
show details | |

|
#40
Birchwood Rd
Medford, NY 11763
|
- sq. feet
|
- baths - beds |
show details |
| Photo | Address | Area | Beds / Baths | Price | Details |
|---|---|---|---|---|---|

|
Check over 1 million property listings on Foreclosure.com!
|
browse all offers | |||
| Photo | Address | Area | Beds / Baths | Price | Details |
|---|

Latest news about housing in Medford, NY collected exclusively by city-data.com from local newspapers, TV, and radio stations


Median year apartment built: 1978
Household type by relationship:
Households: 24,753- Male householders: 3,999 (641 living alone), Female householders: 4,074 (1,010 living alone)
4,908 spouses (4,811 opposite-sex spouses), 614 unmarried partners, (614 opposite-sex unmarried partners), 7,430 children (7,103 natural, 108 adopted, 219 stepchildren), 486 grandchildren, 342 brothers or sisters, 336 parents, 83 foster children, 995 other relatives, 1,132 non-relatives
- In group quarters: 350
Size of family households: 2,192 2-persons, 1,164 3-persons, 1,524 4-persons, 533 5-persons, 170 6-persons, 380 7-or-more-persons.
Size of nonfamily households: 1,664 1-person, 407 2-persons, 50 3-persons.
3,294 married couples with children.
821 single-parent households (167 men, 654 women).
72.6% of residents of Medford speak English at home.
20.8% of residents speak Spanish at home (59% speak English very well, 20% speak English well, 11% speak English not well, 10% don't speak English at all).
3.5% of residents speak other Indo-European language at home (84% speak English very well, 12% speak English well, 3% speak English not well, 1% don't speak English at all).
2.8% of residents speak Asian or Pacific Island language at home (51% speak English very well, 37% speak English well, 5% speak English not well, 7% don't speak English at all).
0.4% of residents speak other language at home (100% speak English very well).
Foreign born population: 4,635 (18.7%)
(58.0% of them are naturalized citizens)
| Here: | 6.8 |
| State: | 6.3 |
| Here: | 4.5 |
| State: | 3.8 |
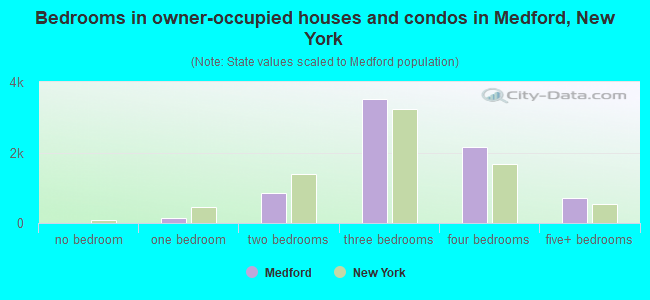
- Bedrooms in owner-occupied houses and condos in Medford, New York
- 13no bedroom
- 1351 bedroom
- 8572 bedrooms
- 3,5113 bedrooms
- 2,1694 bedrooms
- 7015+ bedrooms
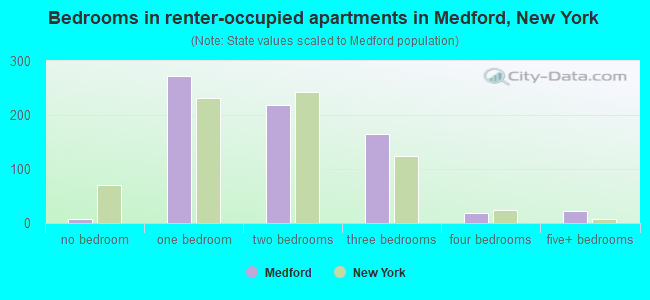
- Bedrooms in renter-occupied apartments in Medford, New York
- 7no bedroom
- 2721 bedroom
- 2192 bedrooms
- 1643 bedrooms
- 194 bedrooms
- 225+ bedrooms
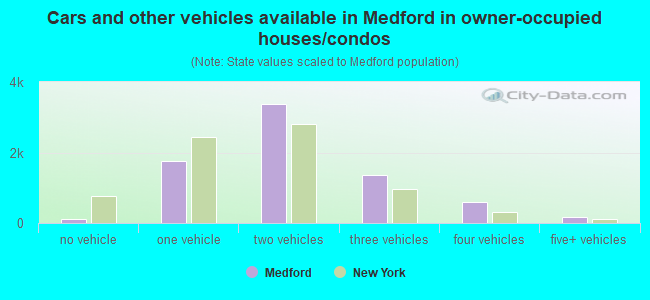
- Cars and other vehicles available in Medford in owner-occupied houses/condos
- 104no vehicle
- 1,7701 vehicle
- 3,3682 vehicles
- 1,3643 vehicles
- 6084 vehicles
- 1715+ vehicles
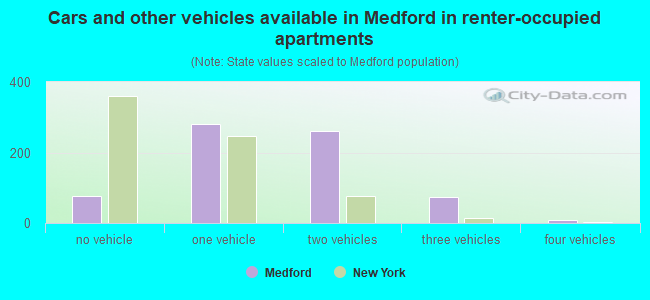
- Cars and other vehicles available in Medford in renter-occupied apartments
- 76no vehicle
- 2821 vehicle
- 2622 vehicles
- 743 vehicles
- 94 vehicles
- 05+ vehicles
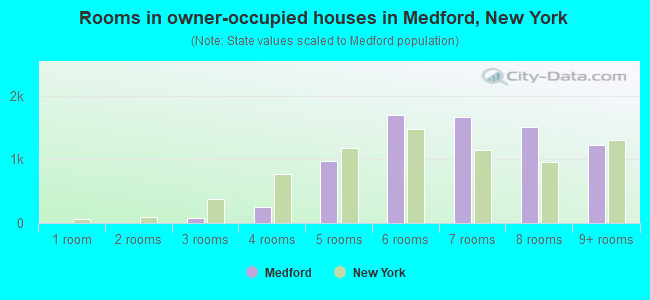
- Rooms in owner-occupied houses in Medford, New York
- 01 room
- 02 rooms
- 753 rooms
- 2534 rooms
- 9785 rooms
- 1,6956 rooms
- 1,6687 rooms
- 1,5008 rooms
- 1,2179+ rooms
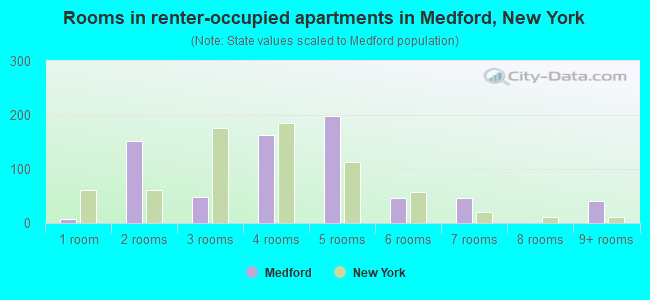
- Rooms in renter-occupied apartments in Medford, New York
- 71 room
- 1512 rooms
- 483 rooms
- 1634 rooms
- 1985 rooms
- 476 rooms
- 477 rooms
- 08 rooms
- 409+ rooms
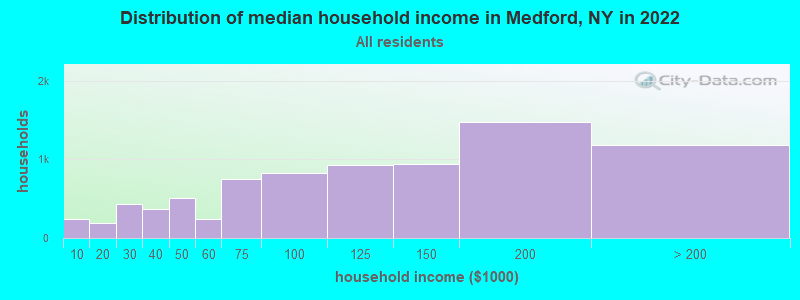
Medford, NY household income distribution

- 242Less than $10,000
- 196$10,000 to $19,999
- 435$20,000 to $29,999
- 365$30,000 to $39,999
- 503$40,000 to $49,999
- 240$50,000 to $59,999
- 750$60,000 to $74,999
- 827$75,000 to $99,999
- 929$100,000 to $124,999
- 934$125,000 to $149,999
- 1,474$150,000 to $199,999
- 1,183$200,000 or more
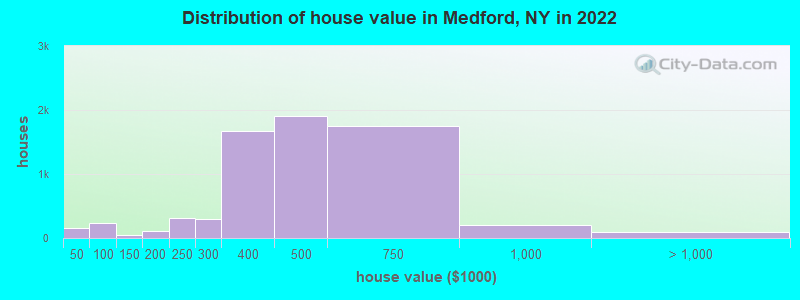
Home value of owner - occupied houses in 2022 in Medford, NY
-
- 45Less than $10,000
- 8$15,000 to $19,999
- 19$35,000 to $39,999
- 80$40,000 to $49,999
- 122$50,000 to $59,999
- 24$60,000 to $69,999
- 49$100,000 to $124,999
- 6$150,000 to $174,999
- 98$175,000 to $199,999
- 312$200,000 to $249,999
- 295$250,000 to $299,999
- 1,668$300,000 to $399,999
- 1,905$400,000 to $499,999
- 1,750$500,000 to $749,999
- 198$750,000 to $999,999
- 63$1,000,000 to $1,499,999
- 27$2,000,000 or more
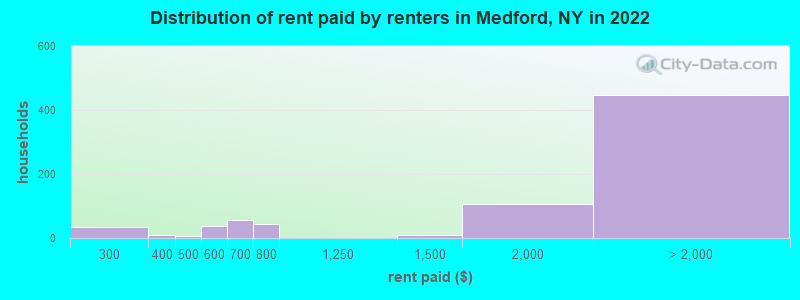
Rent paid by renters in 2022 in Medford, NY
-
- 5$200 to $249
- 27$250 to $299
- 8$300 to $349
- 6$450 to $499
- 29$500 to $549
- 6$550 to $599
- 55$600 to $649
- 45$750 to $799
- 8$1,250 to $1,499
- 106$1,500 to $1,999
- 289$2,000 to $2,499
- 157$2,500 to $2,999
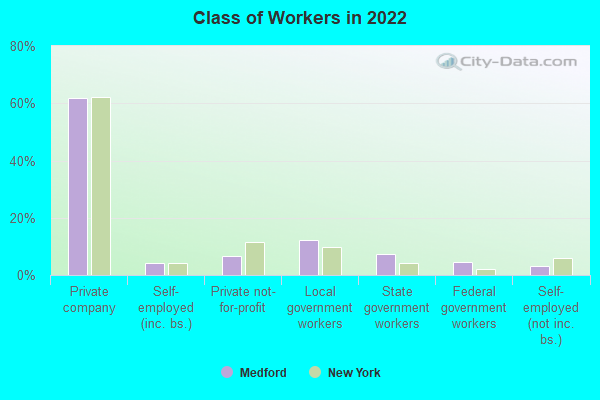
Percentage of workers working in this county: 85.1%
Number of people working at home: 896 (7.8% of all workers)
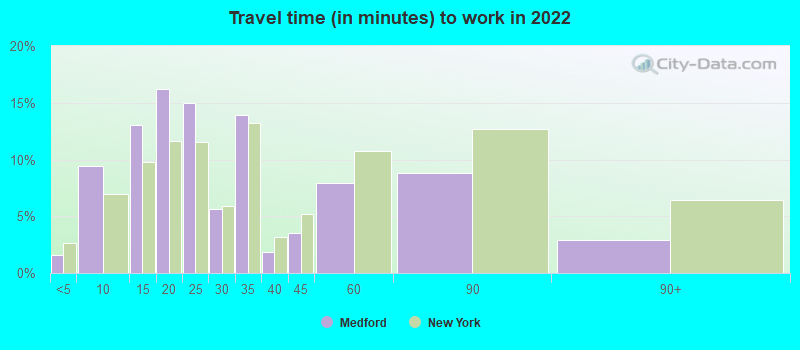
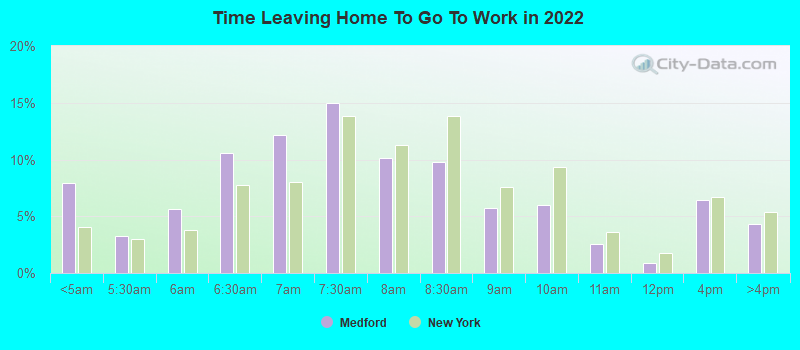
Travel time to work (commute)
- Less than 5 minutes: 207
- 5 to 9 minutes: 658
- 10 to 14 minutes: 1,156
- 15 to 19 minutes: 1,127
- 20 to 24 minutes: 1,373
- 25 to 29 minutes: 690
- 30 to 34 minutes: 2,136
- 35 to 39 minutes: 185
- 40 to 44 minutes: 548
- 45 to 59 minutes: 577
- 60 to 89 minutes: 939
- 90 or more minutes: 830
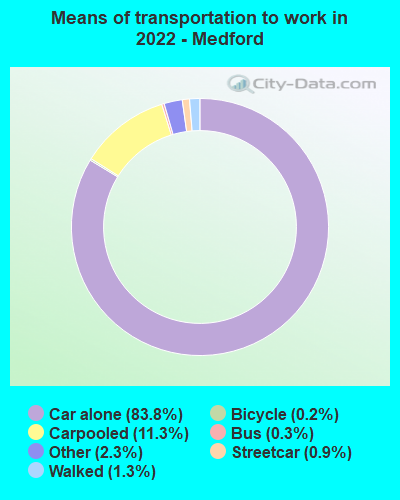
Means of transportation to work:
- Drove a car alone: 7,214 (73.7%)
- Carpooled: 1,112 (11.4%)
- Bus: 20 (0.2%)
- Subway or elevated rail: 81 (0.8%)
- Taxi: 245 (2.5%)
- Bicycle: 12 (0.1%)
- Walked: 123 (1.3%)
- Worked at home: 896 (9.2%)
- Unemployment by race in 2022
- Unemployment rate for White non-Hispanic residents
- 7.4%Males
- 2.5%Females
- Unemployment rate for Black residents
- 5.7%Males
- 3.9%Females
- Unemployment rate for other race residents
- 6.6%Males
- 0.5%Females
- Unemployment rate for two or more race residents
- 6.0%Males
- Unemployment rate for Hispanic or Latino residents
- 2.7%Males
- 0.4%Females
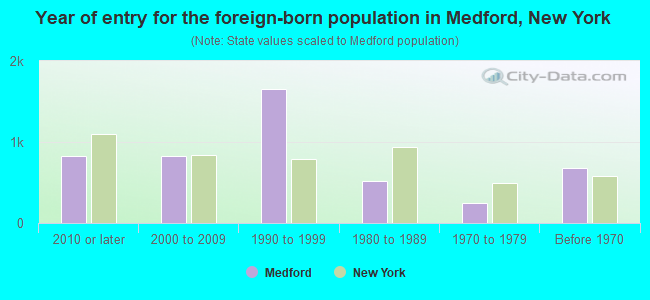
- Year of entry for the foreign-born population in Medford, New York
- 8272010 or later
- 8292000 to 2009
- 1,6581990 to 1999
- 5151980 to 1989
- 2461970 to 1979
- 674Before 1970
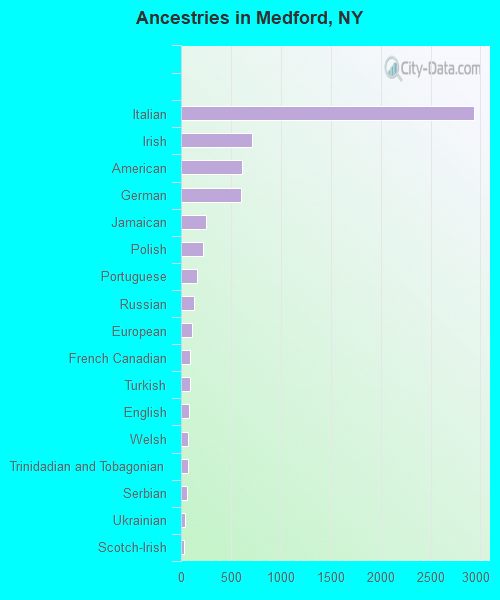
First ancestries reported:
- Italian: 2,939 (24.5%)
- Irish: 710 (5.9%)
- American: 616 (5.1%)
- German: 606 (5.0%)
- Jamaican: 251 (2.1%)
- Polish: 217 (1.8%)
- Portuguese: 157 (1.3%)
- Russian: 129 (1.1%)
- European: 110 (0.9%)
- French Canadian: 95 (0.8%)
- Turkish: 93 (0.8%)
- English: 76 (0.6%)
- Welsh: 74 (0.6%)
- Trinidadian and Tobagonian: 70 (0.6%)
- Serbian: 56 (0.5%)
- Ukrainian: 38 (0.3%)
- Scotch-Irish: 35 (0.3%)
- Austrian: 24 (0.2%)
- Romanian: 23 (0.2%)
- Slovak: 23 (0.2%)
- Hungarian: 22 (0.2%)
- Greek: 21 (0.2%)
- Haitian: 19 (0.2%)
- French: 15 (0.1%)
- Danish: 7 (0.06%)
- African: 1 (0.01%)
Most common places of birth for foreign-born residents (%):
| Medford: | 36.5% (1,560) |
| New York: | 3.9% (177,448) |
| Medford: | 11.2% (479) |
| New York: | 2.5% (111,920) |
| Medford: | 5.2% (222) |
| New York: | 1.2% (55,571) |
| Medford: | 5.0% (213) |
| New York: | 11.1% (501,040) |
| Medford: | 4.7% (199) |
| New York: | 2.4% (108,067) |
| Medford: | 4.0% (171) |
| New York: | 2.0% (91,070) |
| Medford: | 3.0% (130) |
| New York: | 3.5% (158,432) |
| Medford: | 2.7% (116) |
| New York: | 0.2% (10,519) |
| Medford: | 2.6% (113) |
| New York: | 2.8% (126,936) |
| Medford: | 2.4% (102) |
| New York: | 5.0% (227,557) |
| Medford: | 2.2% (94) |
| New York: | 1.4% (65,102) |
| Medford: | 1.9% (82) |
| New York: | 2.0% (91,428) |
Place of birth for U.S.-born residents:
- This state: 18,450
- Other state: 1,122
- Northeast: 448
- Midwest: 187
- South: 342
- West: 130
94.8% of Medford residents lived in the same house 1 years ago.
Out of people who lived in different houses, 43.5% lived in this county.
Out of people who lived in different counties, 74.0% lived in New York.
| Medford: | 94.8% |
| State average: | 89.6% |
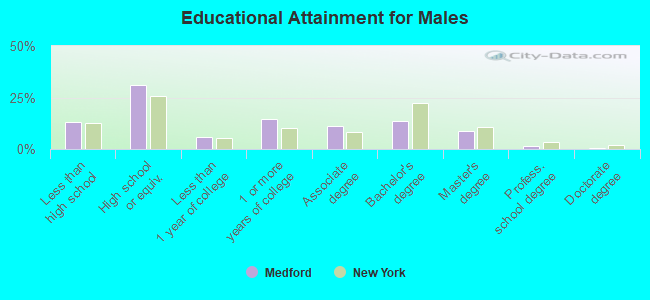
Education attainment for males 25 years and older:
- No schooling: 146
- Nursery to 4th grade: 52
- 5th and 6th grade: 30
- 7th and 8th grade: 157
- 9th grade: 74
- 10th grade: 135
- 11th grade: 290
- 12th grade, no diploma: 299
- High school graduate (or equivalency): 2,775
- Less than 1 year of college: 508
- Some college more than 1 year, no degree: 1,277
- Associate degree: 975
- Bachelor's degree: 1,207
- Master's degree: 781
- Professional school degree: 146
- Doctorate degree: 45
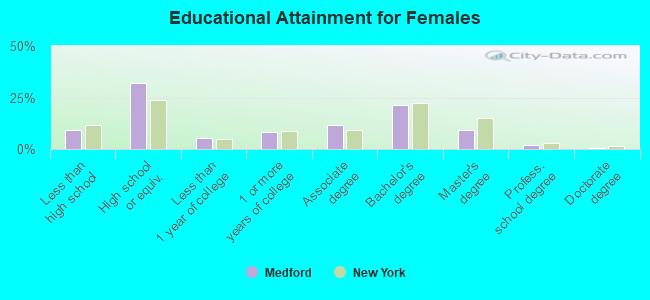
Education attainment for females 25 years and older:
- No schooling: 95
- Nursery to 4th grade: 0
- 5th and 6th grade: 160
- 7th and 8th grade: 204
- 9th grade: 34
- 10th grade: 62
- 11th grade: 146
- 12th grade, no diploma: 89
- High school graduate (or equivalency): 2,794
- Less than 1 year of college: 453
- Some college more than 1 year, no degree: 743
- Associate degree: 1,041
- Bachelor's degree: 1,891
- Master's degree: 820
- Professional school degree: 176
- Doctorate degree: 59


Housing units in structures:
- One, detached: 6,607
- One, attached: 757
- Two: 245
- 3 or 4: 97
- 5 to 9: 154
- 10 to 19: 221
- 20 to 49: 46
- 50 or more: 10
- Mobile homes: 114
Median worth of mobile homes: $425,585
Housing units lacking complete kitchen facilities in 2022: 0.6%
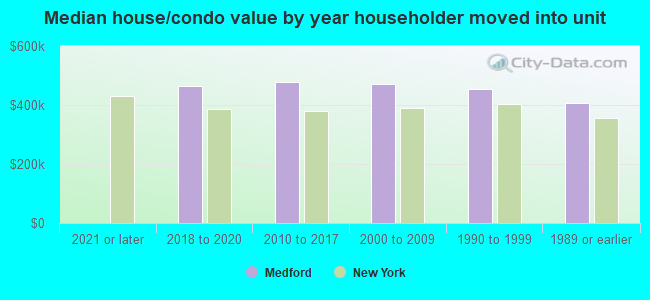
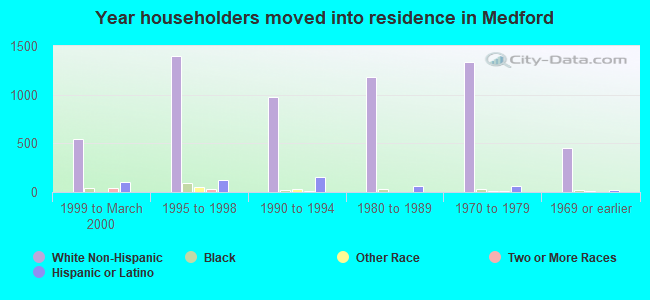
House/condo owner moved in on average 13 years ago
Renter moved in on average 6 years ago
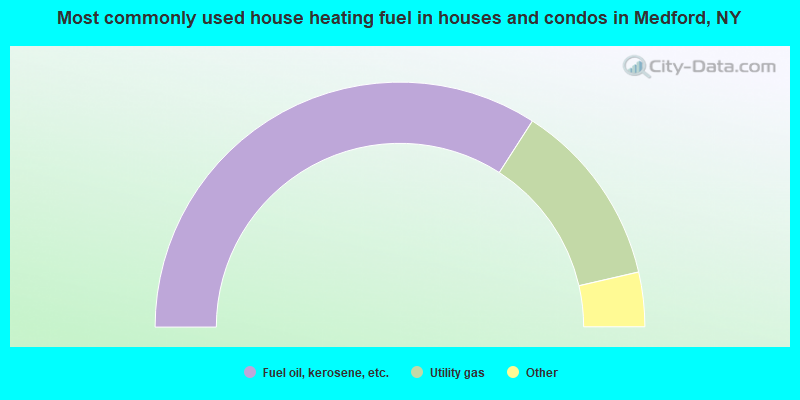
- 68.2%Fuel oil, kerosene, etc.
- 24.6%Utility gas
- 3.2%Bottled, tank, or LP gas
- 1.6%Electricity
- 1.1%Other fuel
- 0.9%Solar energy
- 0.4%Wood
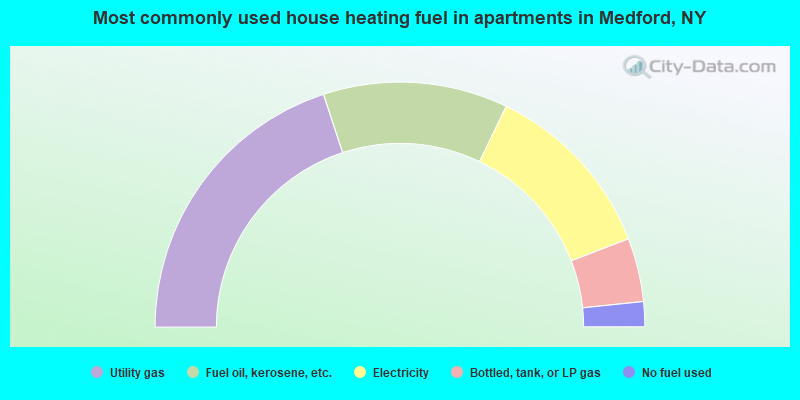
- 39.9%Utility gas
- 24.4%Fuel oil, kerosene, etc.
- 24.0%Electricity
- 8.4%Bottled, tank, or LP gas
- 3.3%No fuel used
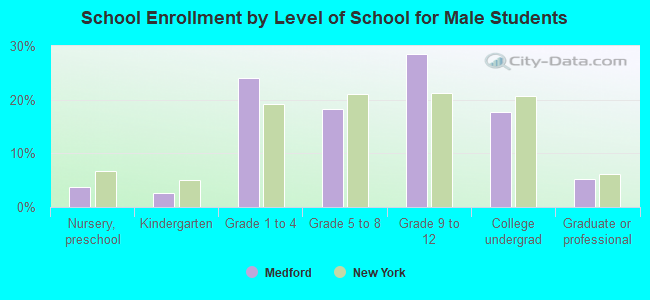
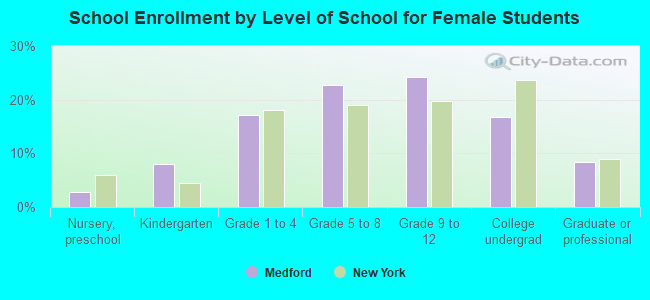
Private vs. public school enrollment:
| Here: | 2.7% |
| New York: | 15.6% |
| Here: | 7.2% |
| New York: | 15.0% |
| Here: | 30.1% |
| New York: | 39.2% |