Merrillville, IN (Indiana) Houses and Residents
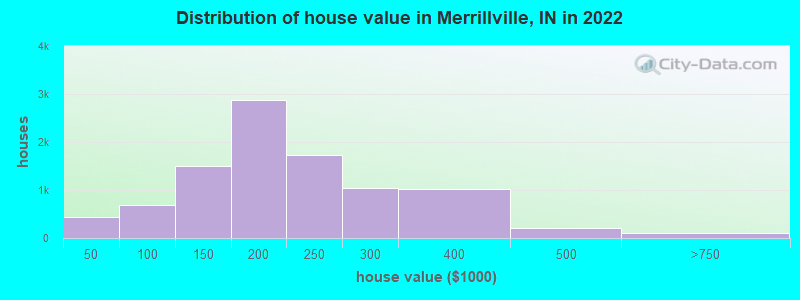
Estimated median house or condo value in 2022: $203,846 (it was $101,300 in 2000 )
Merrillville:
$203,846Indiana:
$208,700
Lower value quartile - upper value quartile: $158,865 - $269,857Mean price in 2022: Detached houses: $203,542 Here:
$203,542State:
$257,916
Townhouses or other attached units: $203,884 Here:
$203,884State:
$224,114
In 2-unit structures: $211,179 Here:
$211,179State:
$175,375
In 3-to-4-unit structures: $152,112 Here:
$152,112State:
$151,116
In 5-or-more-unit structures: $128,814 Here:
$128,814State:
$200,844
Mobile homes: $565,642 Here:
$565,642State:
$67,116
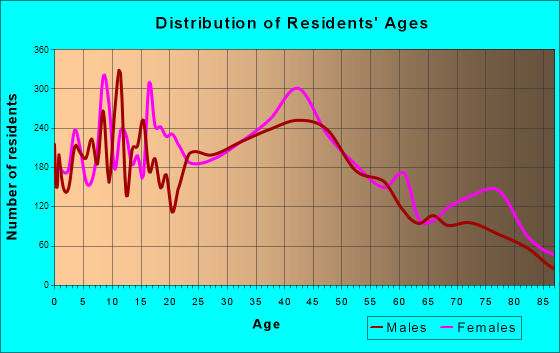
Total population: 35,450 (Urban population: 28,632, Rural population: 2,080 (all nonfarm) )
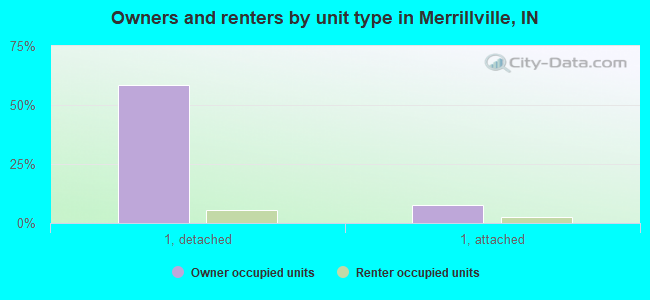
Houses: 16,164 (15,345 occupied: 10,319 owner occupied, 5,040 renter occupied )
% of renters here:
33%State:
29%
Housing density: 486 houses/condos per square mile
Median price asked for vacant for-sale houses and condos in 2022: $960,508.
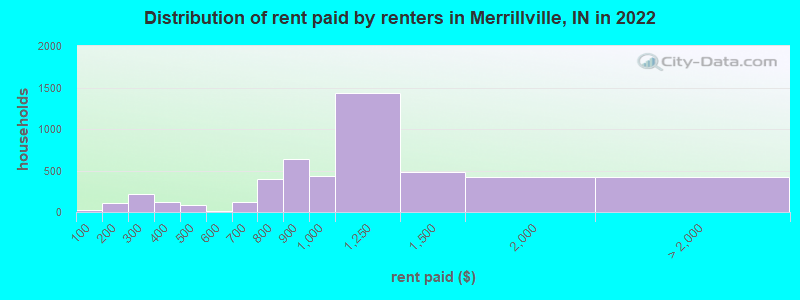
Median contract rent in 2022: $1,029 (lower quartile is $872, upper quartile is $1,215)
Median rent asked for vacant for-rent units in 2022: $800
Median gross rent in Merrillville, IN in 2022: $1,240
Housing units in Merrillville with a mortgage: 6,937 (574 second mortgage, 28 home equity loan, 414 both second mortgage and home equity loan )Houses without a mortgage: 89
Median household income for houses/condos with a mortgage: $88,039
Median household income for apartments without a mortgage: $45,026
Median monthly housing costs: $1,136
Data:
Median house or condo value ($)
Median house or condo value ($ change since 2000)
Median house or condo value ($) - White
Median house or condo value ($) - Black or African American
Median house or condo value ($) - Asian
Median house or condo value ($) - Hispanic or Latino
Median house or condo value ($) - American Indian and Alaska Native
Median house or condo value ($) - Multirace
Median house or condo value ($) - Other Race
Median price asked for mobile homes ($)
Household density (households per square mile)
Mean house or condo value by units in structure - 1, detached ($)
Mean house or condo value by units in structure - 1, attached ($)
Mean house or condo value by units in structure - 2 ($)
Mean house or condo value by units in structure by units in structure - 3 or 4 ($)
Mean house or condo value by units in structure - 5 or more ($)
Mean house or condo value by units in structure - Boat, RV, van, etc. ($)
Mean house or condo value by units in structure - Mobile home ($)
Median contract rent ($)
Median contract rent - Lower quartile ($)
Median contract rent - Upper quartile ($)
Median gross rent ($)
Urban houses (%)
Rural houses (%)
Houses occupied (%)
Houses occupied (% change since 2000)
Houses owner occupied (%)
Houses owner occupied (% change since 2000)
Houses renter occupied (%)
Houses renter occupied (% change since 2000)
Vacant housing units - For rent (%)
Vacant housing units - For rent (% change since 2000)
Vacant housing units - For sale only (%)
Vacant housing units - For sale only (% change since 2000)
Vacant housing units - Rented or sold, not occupied (%)
Vacant housing units - Rented or sold, not occupied (% change since 2000)
Vacant housing units - For seasonal, recreational, or occasional use (%)
Vacant housing units - For seasonal, recreational, or occasional use (% change since 2000)
Vacant housing units - For migrant workers (%)
Vacant housing units - For migrant workers (% change since 2000)
Vacant housing units - Other vacant (%)
Vacant housing units - Other vacant (% change since 2000)
Median monthly housing costs ($)
Median household income for houses/condos with a mortgage ($)
Median household income for houses/condos without a mortgage ($)
Median household income ($)
Median household income ($) - White
Median household income ($) - Black or African American
Median household income ($) - Asian
Median household income ($) - Hispanic or Latino
Median household income ($) - American Indian and Alaska Native
Median household income ($) - Multirace
Median household income ($) - Other Race
Mortgage status - with mortgage (%)
Mortgage status - with second mortgage (%)
Mortgage status - with home equity loan (%)
Mortgage status - with both second mortgage and home equity loan (%)
Mortgage status - without a mortgage (%)
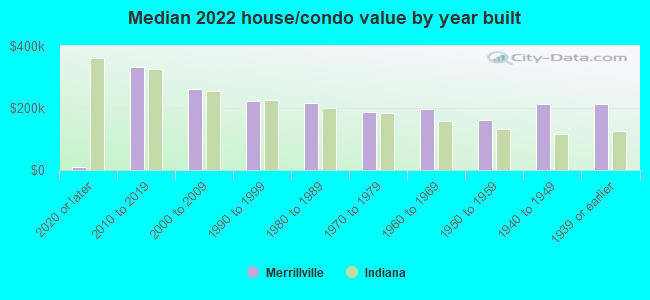
Median year house/condo built
Median year apartment built
Household type by relationship - Male householder living alone (%)
Household type by relationship - Male householder not living alone (%)
Household type by relationship - Female householder living alone (%)
Household type by relationship - Female householder not living alone (%)
Household type by relationship - Opposite-Sex spouse (%)
Household type by relationship - Same-Sex spouse (%)
Household type by relationship - Opposite-Sex unmarried partner (%)
Household type by relationship - Same-Sex unmarried partner (%)
Household type by relationship - In group quarters (%)
Size of family households - 2-person household (%)
Size of family households - 3-person household (%)
Size of family households - 4-person household (%)
Size of family households - 5-person household (%)
Size of family households - 6-person household (%)
Size of family households - 7-or-more-person household (%)
Size of nonfamily households - 1-person household (%)
Size of nonfamily households - 2-person household (%)
Size of nonfamily households - 3-person household (%)
Size of nonfamily households - 4-person household (%)
Size of nonfamily households - 5-person household (%)
Size of nonfamily households - 6-person household (%)
Size of nonfamily households - 7-or-moreperson household (%)
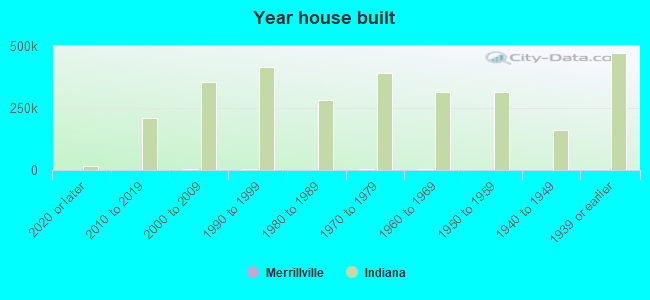
Year house built - Built 2010 or later (%)
Year house built - Built 2000 to 2009 (%)
Year house built - Built 1990 to 1999 (%)
Year house built - Built 1980 to 1989 (%)
Year house built - Built 1970 to 1979 (%)
Year house built - Built 1960 to 1969 (%)
Year house built - Built 1950 to 1959 (%)
Year house built - Built 1940 to 1949 (%)
Year house built - Built 1939 or earlier (%)
Median number of rooms in houses and condos
Median number of rooms in apartments
Median number of bedrooms in owner occupied houses
Mean number of bedrooms in owner occupied houses
Median number of bedrooms in renter occupied houses
Mean number of bedrooms in renter occupied houses
Median number of vehichles in owner occupied houses
Mean number of vehichles in owner occupied houses
Median number of vehichles in renter occupied houses
Mean number of vehichles in renter occupied houses
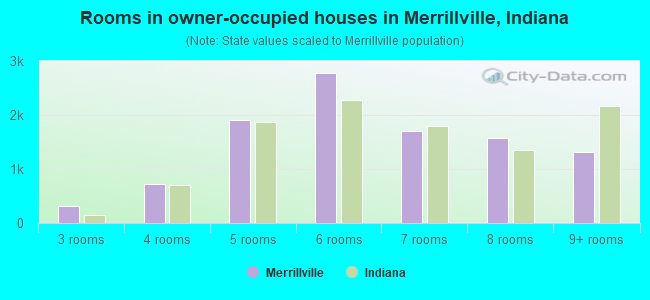
Rooms in owner-occupied houses - 1 room (%)
Rooms in owner-occupied houses - 2 rooms (%)
Rooms in owner-occupied houses - 3 rooms (%)
Rooms in owner-occupied houses - 4 rooms (%)
Rooms in owner-occupied houses - 5 rooms (%)
Rooms in owner-occupied houses - 6 rooms (%)
Rooms in owner-occupied houses - 7 rooms (%)
Rooms in owner-occupied houses - 8 rooms (%)
Rooms in owner-occupied houses - 9+ rooms (%)
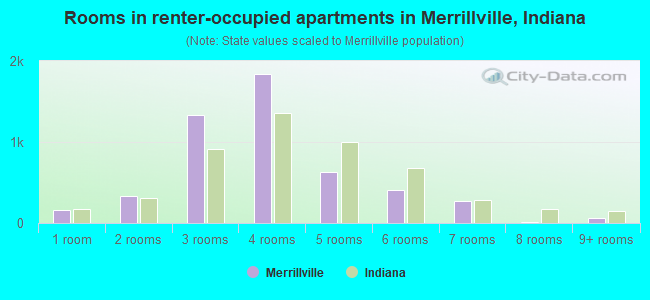
Rooms in renter-occupied houses - 1 room (%)
Rooms in renter-occupied houses - 2 rooms (%)
Rooms in renter-occupied houses - 3 rooms (%)
Rooms in renter-occupied houses - 4 rooms (%)
Rooms in renter-occupied houses - 5 rooms (%)
Rooms in renter-occupied houses - 6 rooms (%)
Rooms in renter-occupied houses - 7 rooms (%)
Rooms in renter-occupied houses - 8 rooms (%)
Rooms in renter-occupied houses - 9+ rooms (%)
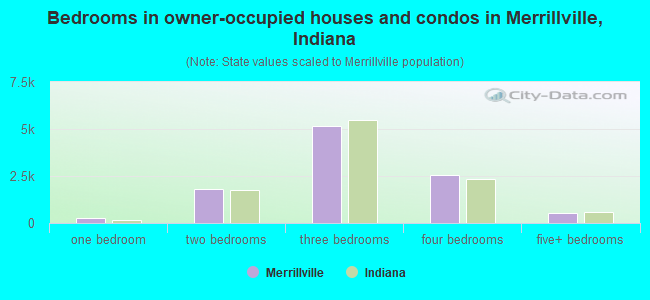
Bedrooms in owner-occupied houses - no bedrooms (%)
Bedrooms in owner-occupied houses - 1 bedroom (%)
Bedrooms in owner-occupied houses - 2 bedrooms (%)
Bedrooms in owner-occupied houses - 3 bedrooms (%)
Bedrooms in owner-occupied houses - 4 bedrooms (%)
Bedrooms in owner-occupied houses - 5+ bedrooms (%)
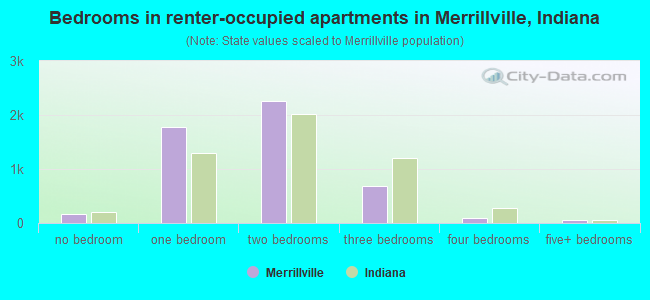
Bedrooms in renter-occupied houses - no bedrooms (%)
Bedrooms in renter-occupied houses - 1 bedroom (%)
Bedrooms in renter-occupied houses - 2 bedrooms (%)
Bedrooms in renter-occupied houses - 3 bedrooms (%)
Bedrooms in renter-occupied houses - 4 bedrooms (%)
Bedrooms in renter-occupied houses - 5+ bedrooms (%)
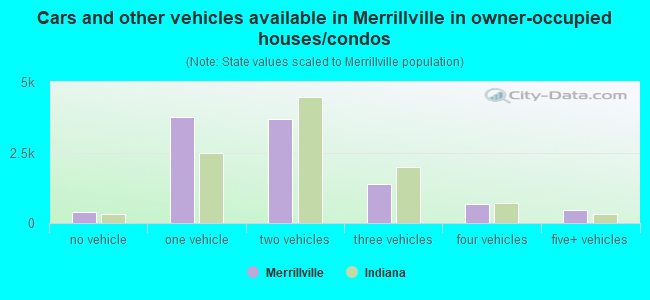
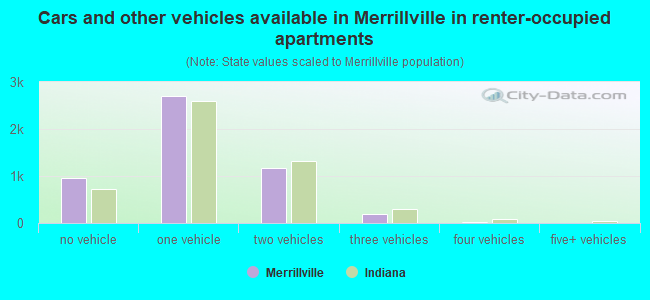
Vehicles available in owner-occupied houses - no vehicle available (%)
Vehicles available in owner-occupied houses - 1 vehicle available(%)
Vehicles available in owner-occupied houses - 2 Vehicles available (%)
Vehicles available in owner-occupied houses - 3 Vehicles available (%)
Vehicles available in owner-occupied houses - 4 Vehicles available (%)
Vehicles available in owner-occupied houses - 5+ Vehicles available (%)
Vehicles available in renter-occupied houses - no vehicle available (%)
Vehicles available in renter-occupied houses - 1 vehicle available (%)
Vehicles available in renter-occupied houses - 2 Vehicles available (%)
Vehicles available in renter-occupied houses - 3 Vehicles available (%)
Vehicles available in renter-occupied houses - 4 Vehicles available (%)
Vehicles available in renter-occupied houses - 5+ Vehicles available (%)
Housing units in structures - 1, detached (%)
Housing units in structures - 1, attached (%)
Housing units in structures - 2 (%)
Housing units in structures - 3 or 4 (%)
Housing units in structures - 5 to 9 (%)
Housing units in structures - 10 to 19 (%)
Housing units in structures - 20 to 49 (%)
Housing units in structures - 50 or more (%)
Housing units in structures - Mobile home (%)
Housing units in structures - Boat, RV, van, etc. (%)
Housing units in structures - Owners - 1, detached (%)
Housing units in structures - Owners - 1, attached (%)
Housing units in structures - Owners - 2 (%)
Housing units in structures - Owners - 3 or 4 (%)
Housing units in structures - Owners - 5 to 9 (%)
Housing units in structures - Owners - 10 to 19 (%)
Housing units in structures - Owners - 20 to 49 (%)
Housing units in structures - Owners - 50 or more (%)
Housing units in structures - Owners - Mobile home (%)
Housing units in structures - Owners - Boat, RV, van, etc. (%)
Housing units in structures - Renters - 1, detached (%)
Housing units in structures - Renters - 1, attached (%)
Housing units in structures - Renters - 2 (%)
Housing units in structures - Renters - 3 or 4 (%)
Housing units in structures - Renters - 5 to 9 (%)
Housing units in structures - Renters - 10 to 19 (%)
Housing units in structures - Renters - 20 to 49 (%)
Housing units in structures - Renters - 50 or more (%)
Housing units in structures - Renters - Mobile home (%)
Housing units in structures - Renters - Boat, RV, van, etc. (%)
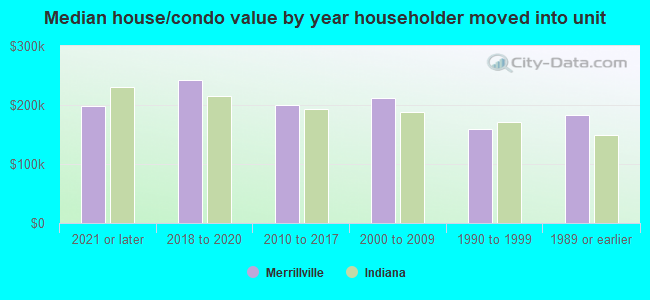
House/condo owner moved in on average (years ago)
Renter moved in on average (years ago)
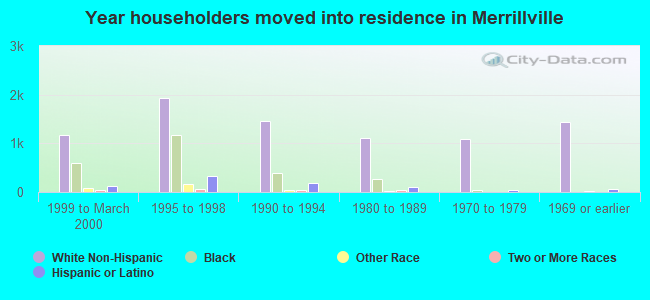
Year householder moved into unit - Moved in 1999 to March 2000 (%)
Year householder moved into unit - Moved in 1999 to March 2000 (%) - White
Year householder moved into unit - Moved in 1999 to March 2000 (%) - Black or African American
Year householder moved into unit - Moved in 1999 to March 2000 (%) - Asian
Year householder moved into unit - Moved in 1999 to March 2000 (%) - Hispanic or Latino
Year householder moved into unit - Moved in 1999 to March 2000 (%) - American Indian and Alaska Native
Year householder moved into unit - Moved in 1999 to March 2000 (%) - Multirace
Year householder moved into unit - Moved in 1999 to March 2000 (%) - Other Race
Year householder moved into unit - Moved in 1995 to 1998 (%)
Year householder moved into unit - Moved in 1995 to 1998 (%) - White
Year householder moved into unit - Moved in 1995 to 1998 (%) - Black or African American
Year householder moved into unit - Moved in 1995 to 1998 (%) - Asian
Year householder moved into unit - Moved in 1995 to 1998 (%) - Hispanic or Latino
Year householder moved into unit - Moved in 1995 to 1998 (%) - American Indian and Alaska Native
Year householder moved into unit - Moved in 1995 to 1998 (%) - Multirace
Year householder moved into unit - Moved in 1995 to 1998 (%) - Other Race
Year householder moved into unit - Moved in 1990 to 1994 (%)
Year householder moved into unit - Moved in 1990 to 1994 (%) - White
Year householder moved into unit - Moved in 1990 to 1994 (%) - Black or African American
Year householder moved into unit - Moved in 1990 to 1994 (%) - Asian
Year householder moved into unit - Moved in 1990 to 1994 (%) - Hispanic or Latino
Year householder moved into unit - Moved in 1990 to 1994 (%) - American Indian and Alaska Native
Year householder moved into unit - Moved in 1990 to 1994 (%) - Multirace
Year householder moved into unit - Moved in 1990 to 1994 (%) - Other Race
Year householder moved into unit - Moved in 1980 to 1989 (%)
Year householder moved into unit - Moved in 1980 to 1989 (%) - White
Year householder moved into unit - Moved in 1980 to 1989 (%) - Black or African American
Year householder moved into unit - Moved in 1980 to 1989 (%) - Asian
Year householder moved into unit - Moved in 1980 to 1989 (%) - Hispanic or Latino
Year householder moved into unit - Moved in 1980 to 1989 (%) - American Indian and Alaska Native
Year householder moved into unit - Moved in 1980 to 1989 (%) - Multirace
Year householder moved into unit - Moved in 1980 to 1989 (%) - Other Race
Year householder moved into unit - Moved in 1970 to 1979 (%)
Year householder moved into unit - Moved in 1970 to 1979 (%) - White
Year householder moved into unit - Moved in 1970 to 1979 (%) - Black or African American
Year householder moved into unit - Moved in 1970 to 1979 (%) - Asian
Year householder moved into unit - Moved in 1970 to 1979 (%) - Hispanic or Latino
Year householder moved into unit - Moved in 1970 to 1979 (%) - American Indian and Alaska Native
Year householder moved into unit - Moved in 1970 to 1979 (%) - Multirace
Year householder moved into unit - Moved in 1970 to 1979 (%) - Other Race
Year householder moved into unit - Moved in 1969 or earlier (%)
Year householder moved into unit - Moved in 1969 or earlier (%) - White
Year householder moved into unit - Moved in 1969 or earlier (%) - Black or African American
Year householder moved into unit - Moved in 1969 or earlier (%) - Asian
Year householder moved into unit - Moved in 1969 or earlier (%) - Hispanic or Latino
Year householder moved into unit - Moved in 1969 or earlier (%) - American Indian and Alaska Native
Year householder moved into unit - Moved in 1969 or earlier (%) - Multirace
Year householder moved into unit - Moved in 1969 or earlier (%) - Other Race
Housing units lacking complete plumbing facilities (%)
Housing units lacking complete kitchen facilities (%)
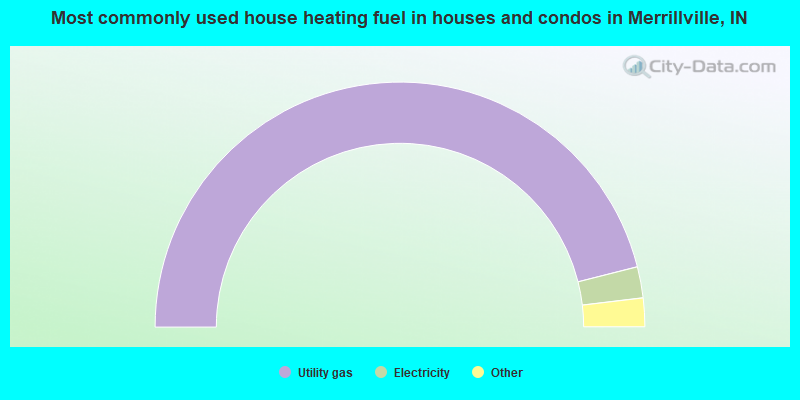
House heating fuel used in houses and condos - Utility gas (%)
House heating fuel used in houses and condos - Bottled, tank, or LP gas (%)
House heating fuel used in houses and condos - Electricity (%)
House heating fuel used in houses and condos - Fuel oil, kerosene, etc. (%)
House heating fuel used in houses and condos - Coal or coke (%)
House heating fuel used in houses and condos - Wood (%)
House heating fuel used in houses and condos - Solar energy (%)
House heating fuel used in houses and condos - Other fuel (%)
House heating fuel used in houses and condos - No fuel used (%)
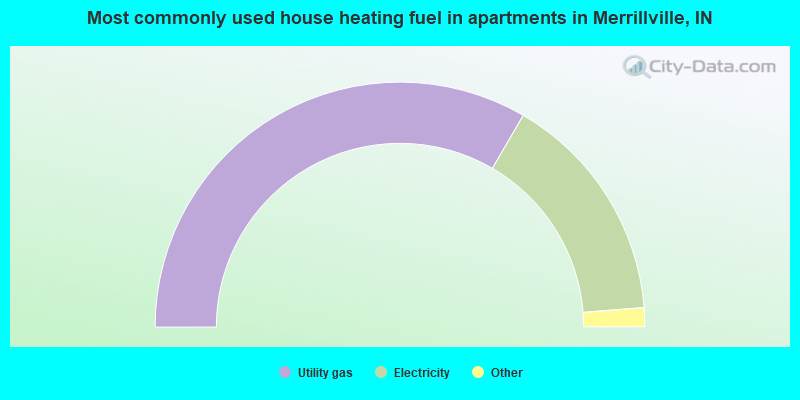
House heating fuel used in apartments - Utility gas (%)
House heating fuel used in apartments - Bottled, tank, or LP gas (%)
House heating fuel used in apartments - Electricity (%)
House heating fuel used in apartments - Fuel oil, kerosene, etc. (%)
House heating fuel used in apartments - Coal or coke (%)
House heating fuel used in apartments - Wood (%)
House heating fuel used in apartments - Solar energy (%)
House heating fuel used in apartments - Other fuel (%)
House heating fuel used in apartments - No fuel used (%)
Latest news about housing in Merrillville, IN collected exclusively by city-data.com from local newspapers, TV, and radio stations
Median year house/condo built: 1974Median year apartment built: 1988Household type by relationship:
Households: 36,360
Male householders: 6,968 (2,592 living alone ), Female householders: 8,268 (3,433 living alone )4,912 spouses (4,886 opposite-sex spouses ), 917 unmarried partners , (856 opposite-sex unmarried partners ), 11,901 children (10,816 natural , 251 adopted , 834 stepchildren ), 1,074 grandchildren , 218 brothers or sisters , 479 parents , 0 foster children , 520 other relatives , 613 non-relatives In group quarters: 483
Size of family households: 3,412 2-persons , 2,428 3-persons , 1,200 4-persons , 917 5-persons , 298 6-persons , 249 7-or-more-persons .
Size of nonfamily households: 6,175 1-person , 627 2-persons , 104 3-persons .
4,149 married couples with children. single-parent households (650 men , 2,108 women ).
86.0% of residents of Merrillville speak English at home. of residents speak Spanish at home (89% speak English very well , 6% speak English well , 2% speak English not well , 2% don't speak English at all ).of residents speak other Indo-European language at home (82% speak English very well , 10% speak English well , 7% speak English not well , 1% don't speak English at all ).of residents speak Asian or Pacific Island language at home (28% speak English very well , 72% speak English well ).of residents speak other language at home (84% speak English very well , 16% speak English not well ).
Foreign born population: 2,426 (6.7%)of them are naturalized citizens )
Median number of rooms in houses and condos:
Median number of rooms in apartments
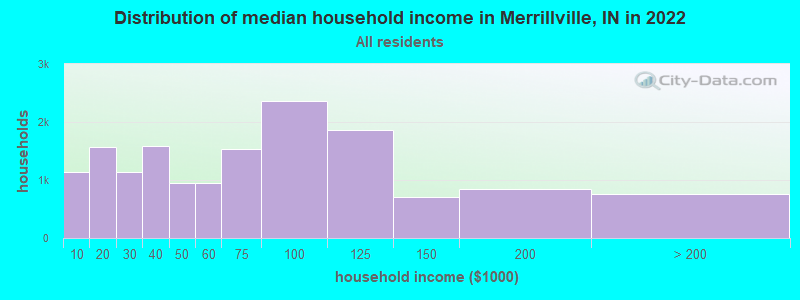
Merrillville, IN household income distribution 1,133 Less than $10,0001,568 $10,000 to $19,9991,130 $20,000 to $29,9991,593 $30,000 to $39,999956 $40,000 to $49,999949 $50,000 to $59,9991,530 $60,000 to $74,9992,361 $75,000 to $99,9991,869 $100,000 to $124,999707 $125,000 to $149,999844 $150,000 to $199,999761 $200,000 or more
Home value of owner - occupied houses in 2022 in Merrillville, IN 161 Less than $10,00036 $10,000 to $14,9997 $15,000 to $19,99911 $20,000 to $24,99932 $25,000 to $29,999168 $30,000 to $34,99918 $40,000 to $49,99976 $50,000 to $59,99951 $60,000 to $69,99973 $70,000 to $79,999246 $80,000 to $89,999213 $90,000 to $99,999532 $100,000 to $124,999978 $125,000 to $149,9991,617 $150,000 to $174,9991,257 $175,000 to $199,9991,732 $200,000 to $249,9991,034 $250,000 to $299,9991,012 $300,000 to $399,999199 $400,000 to $499,99967 $500,000 to $749,99928 $1,000,000 to $1,499,999Rent paid by renters in 2022 in Merrillville, IN 20 Less than $10063 $100 to $14940 $150 to $199123 $200 to $24989 $250 to $29985 $300 to $34938 $350 to $39962 $400 to $44916 $450 to $49913 $550 to $59949 $600 to $64965 $650 to $699151 $700 to $749244 $750 to $799635 $800 to $899439 $900 to $9991,430 $1,000 to $1,249486 $1,250 to $1,499416 $1,500 to $1,999168 $2,000 to $2,499256 No cash rent
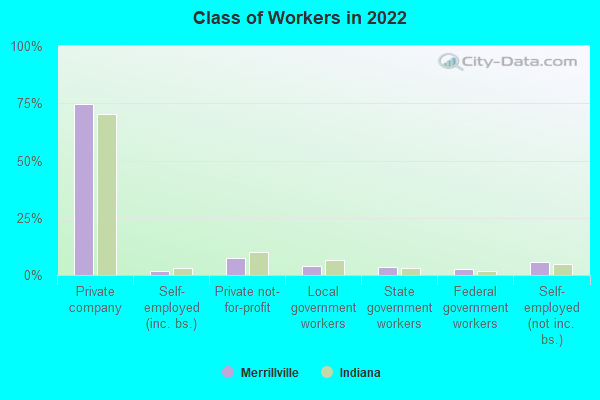
Percentage of workers working in this county: 73.7%Number of people working at home: 1,649 (9.9% of all workers )
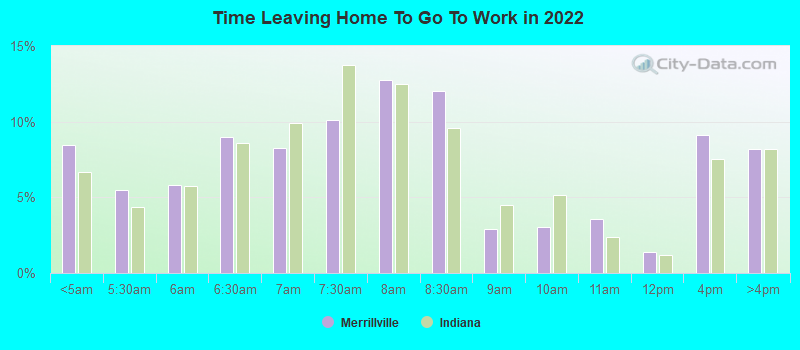
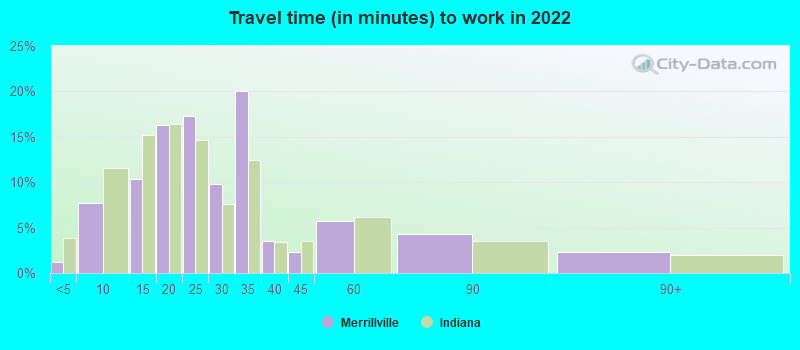
Travel time to work (commute)
Less than 5 minutes: 2155 to 9 minutes: 1,01010 to 14 minutes: 1,39215 to 19 minutes: 2,42520 to 24 minutes: 2,00425 to 29 minutes: 1,19830 to 34 minutes: 2,48435 to 39 minutes: 26240 to 44 minutes: 79245 to 59 minutes: 1,24460 to 89 minutes: 1,32890 or more minutes: 564
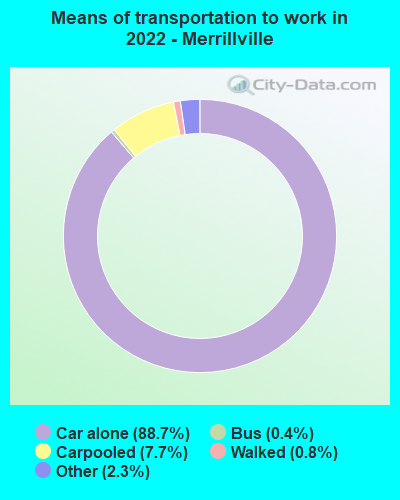
Means of transportation to work:
Drove a car alone: 19,331 (80.0%)Carpooled: 1,993 (8.3%)Bus : 97 (0.4%)Long-distance train or commuter rail : 6 (0.0%)Taxi: 494 (2.0%)Bicycle: 41 (0.2%)Walked: 188 (0.8%)Worked at home: 1,649 (6.8%)
Unemployment by race in 2022
Unemployment rate for White non-Hispanic residents 1.8% Males2.1% FemalesUnemployment rate for Black residents 11.1% Males6.7% FemalesUnemployment rate for other race residents 13.4% MalesUnemployment rate for two or more race residents 6.2% Males16.1% FemalesUnemployment rate for Hispanic or Latino residents 6.6% Males6.0% Females
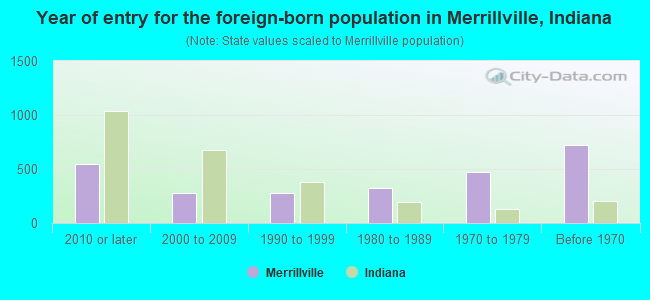
Year of entry for the foreign-born population in Merrillville, Indiana
543 2010 or later 278 2000 to 2009 277 1990 to 1999 325 1980 to 1989 473 1970 to 1979 725 Before 1970
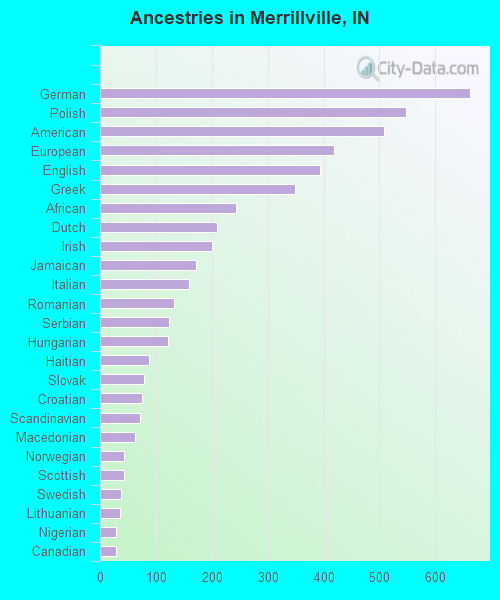
First ancestries reported:
German: 663 (3.0%)
Polish: 548 (2.5%)
American: 509 (2.3%)
European: 418 (1.9%)
English: 393 (1.8%)
Greek: 349 (1.6%)
African: 243 (1.1%)
Dutch: 210 (0.9%)
Irish: 201 (0.9%)
Jamaican: 171 (0.8%)
Italian: 160 (0.7%)
Romanian: 132 (0.6%)
Serbian: 124 (0.6%)
Hungarian: 121 (0.5%)
Haitian: 88 (0.4%)
Slovak: 79 (0.4%)
Croatian: 75 (0.3%)
Scandinavian: 71 (0.3%)
Macedonian: 62 (0.3%)
Norwegian: 43 (0.2%)
Scottish: 43 (0.2%)
Swedish: 37 (0.2%)
Lithuanian: 35 (0.2%)
Nigerian: 29 (0.1%)
Canadian: 28 (0.1%)
Russian: 21 (0.09%)
Ukrainian: 19 (0.09%)
Lebanese: 16 (0.07%)
British: 16 (0.07%)
Somali: 12 (0.05%)
Scotch-Irish: 9 (0.04%)
French: 6 (0.03%)
Ethiopian: 6 (0.03%)
Yugoslavian: 6 (0.03%)
West Indian: 2 (0.01%) Most common places of birth for foreign-born residents (%): Mexico Merrillville:
32.7% (820)Indiana:
27.0% (101,996)
Kuwait Merrillville:
10.7% (269)Indiana:
0.2% (614)
Jamaica Merrillville:
6.6% (165)Indiana:
0.5% (1,808)
Romania Merrillville:
5.2% (129)Indiana:
0.4% (1,537)
Jordan Merrillville:
5.1% (128)Indiana:
0.4% (1,545)
India Merrillville:
4.7% (118)Indiana:
8.5% (32,127)
Philippines Merrillville:
4.0% (101)Indiana:
3.1% (11,851)
Guatemala Merrillville:
3.5% (88)Indiana:
2.3% (8,656)
Haiti Merrillville:
2.7% (68)Indiana:
1.2% (4,484)
Taiwan Merrillville:
2.7% (67)Indiana:
0.6% (2,272)
North Macedonia (Macedonia) Merrillville:
2.7% (67)Indiana:
0.3% (1,056)
Greece Merrillville:
2.4% (61)Indiana:
0.3% (1,317)
Other Eastern Africa Merrillville:
2.4% (59)Indiana:
0.4% (1,469)
Bosnia and Herzegovina Merrillville:
2.0% (49)Indiana:
0.3% (1,277)
Place of birth for U.S.-born residents:
This state: 19,438Other state: 14,349Northeast: 546Midwest: 10,733South: 2,446West: 487 90.8% of Merrillville residents lived in the same house 1 years ago.
Out of people who lived in different houses, 45.7% lived in this county.
Out of people who lived in different counties, 18.0% lived in Indiana.
Merrillville:
90.8%State average:
87.1%
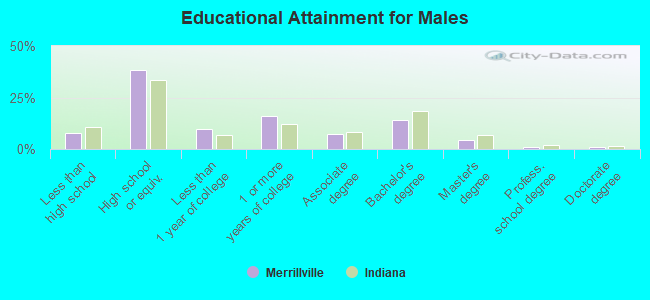
Education attainment for males 25 years and older:
No schooling: 120Nursery to 4th grade: 295th and 6th grade: 1017th and 8th grade: 559th grade: 11610th grade: 9611th grade: 16712th grade, no diploma: 204High school graduate (or equivalency): 4,265Less than 1 year of college: 1,085Some college more than 1 year, no degree: 1,775Associate degree: 803Bachelor's degree: 1,586Master's degree: 483Professional school degree: 122Doctorate degree: 88
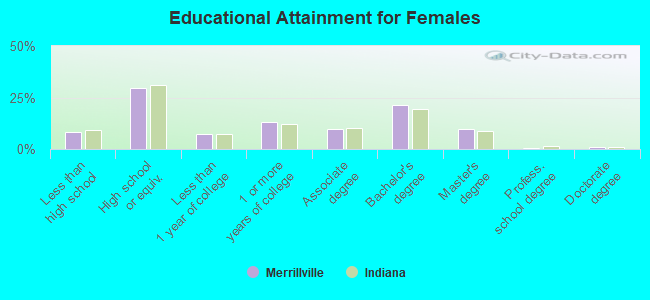
Education attainment for females 25 years and older:
No schooling: 100Nursery to 4th grade: 95th and 6th grade: 1567th and 8th grade: 3179th grade: 3910th grade: 12811th grade: 26612th grade, no diploma: 123High school graduate (or equivalency): 4,017Less than 1 year of college: 964Some college more than 1 year, no degree: 1,802Associate degree: 1,340Bachelor's degree: 2,884Master's degree: 1,346Professional school degree: 53Doctorate degree: 112
Housing units in structures:
One, detached: 9,792One, attached: 1,225Two: 1503 or 4: 4445 to 9: 41910 to 19: 1,97820 to 49: 62350 or more: 1,248Mobile homes: 280Median worth of mobile homes: $23,620
Housing units lacking complete plumbing facilities in 2022: 0.6%Housing units lacking complete kitchen facilities in 2022: 2.2%House/condo owner moved in on average 12 years ago
Renter moved in on average 3 years ago
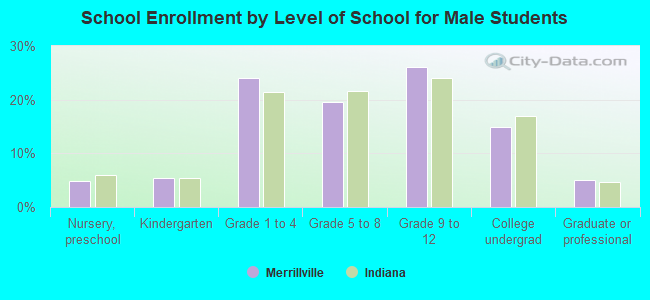
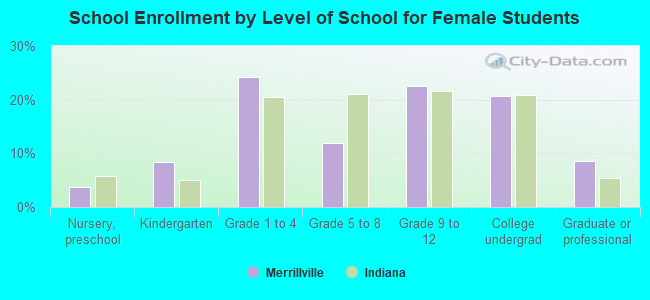
Private vs. public school enrollment:
Students in private schools in grades 1 to 8 (elementary and middle school): 163 Students in private schools in grades 9 to 12 (high school): 218 Students in private undergraduate colleges: 150