Housing density: 275 houses/condos per square mile
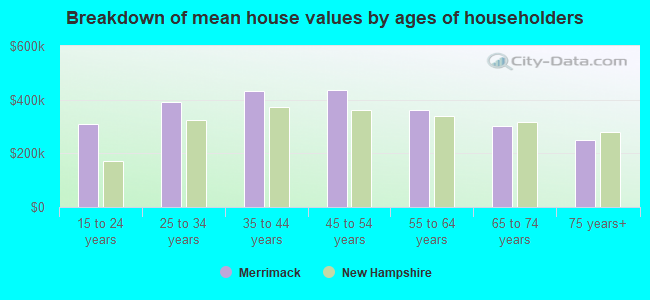
Median price asked for vacant for-sale houses and condos in 2022 in this county: $219,786.
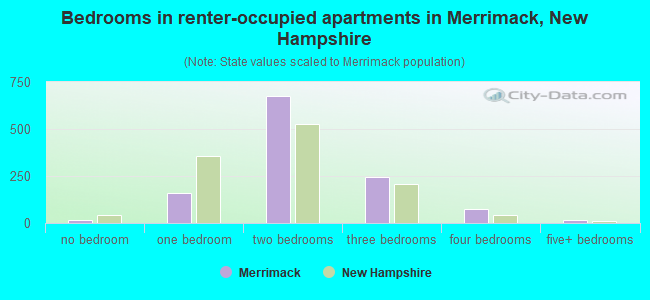
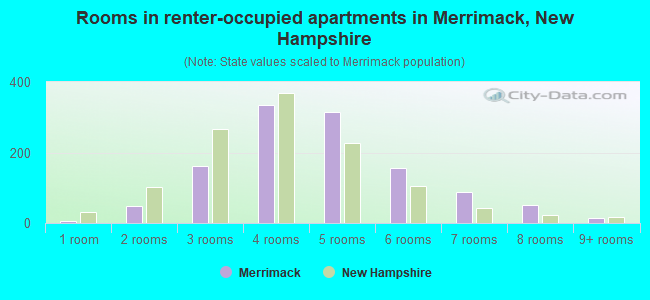
Median contract rent in 2022: $1,649 (lower quartile is $1,392, upper quartile is over $2,000)
Median rent asked for vacant for-rent units in 2022: $1,561
Median gross rent in Merrimack, NH in 2022: $1,924
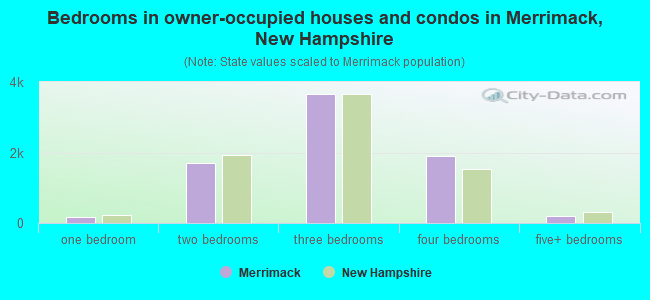
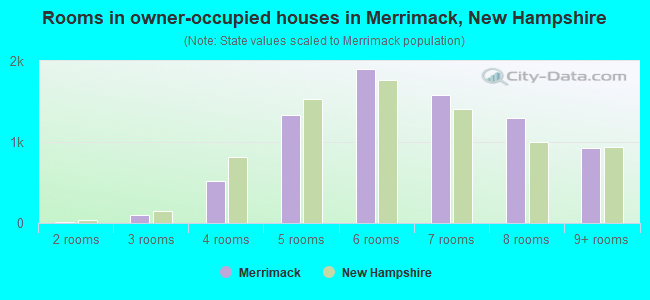
Housing units in Merrimack with a mortgage: 5,853 (410 second mortgage, 823 home equity loan, 8 both second mortgage and home equity loan) Houses without a mortgage: 823
In family households: 326,724 (73,081 male householders, 30,878 female householders)
80,219 spouses, 116,046 children (108,604 natural, 2,355 adopted, 5,087 stepchildren), 5,202 grandchildren, 2,916 brothers or sisters, 3,400 parents, foster children, 2,901 other relatives, 9,588 non-relatives
In nonfamily households: 66,238 (25,502 male householders (18,551 living alone)), 26,005 female householders (20,836 living alone)), 14,731 nonrelatives
In group quarters: 7,759 (3,560 institutionalized population)
74,304 married couples with children.
19,641 single-parent households (5,030 men, 14,611 women).
93.7% of residents of Merrimack speak English at home.
0.6% of residents speak Spanish at home (88% speak English very well, 12% speak English not well).
4.1% of residents speak other Indo-European language at home (81% speak English very well, 12% speak English well, 8% speak English not well).
1.3% of residents speak Asian or Pacific Island language at home (65% speak English very well, 30% speak English well, 2% speak English not well, 2% don't speak English at all).
0.3% of residents speak other language at home (82% speak English very well, 18% speak English well).
Foreign born population: 2,117 (7.5%)
(71.3% of them are naturalized citizens)
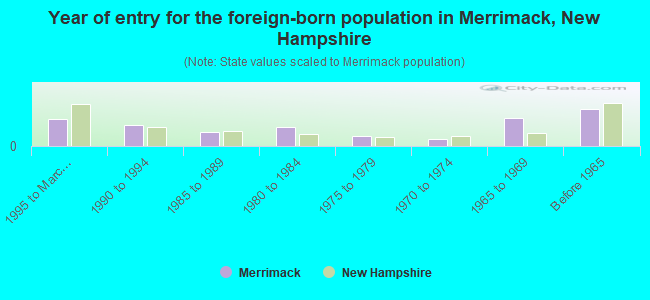
Year of entry for the foreign-born population in Merrimack, New Hampshire
2101995 to March 2000
1621990 to 1994
1081985 to 1989
1441980 to 1984
791975 to 1979
551970 to 1974
2141965 to 1969
287Before 1965
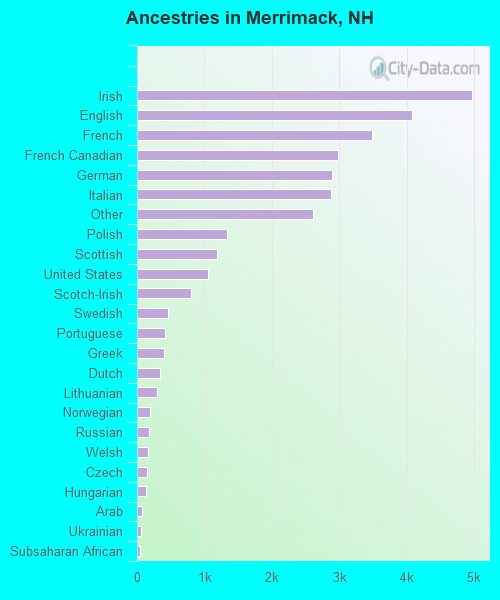
First ancestries reported:
Irish: 4,974 (15.9%)
English: 4,083 (13.0%)
French: 3,481 (11.1%)
French Canadian: 2,982 (9.5%)
German: 2,894 (9.2%)
Italian: 2,874 (9.2%)
Other: 2,614 (8.4%)
Polish: 1,328 (4.2%)
Scottish: 1,184 (3.8%)
United States: 1,051 (3.4%)
Scotch-Irish: 805 (2.6%)
Swedish: 455 (1.5%)
Portuguese: 419 (1.3%)
Greek: 408 (1.3%)
Dutch: 342 (1.1%)
Lithuanian: 298 (1.0%)
Norwegian: 193 (0.6%)
Russian: 173 (0.6%)
Welsh: 162 (0.5%)
Czech: 141 (0.5%)
Hungarian: 133 (0.4%)
Arab: 75 (0.2%)
Ukrainian: 63 (0.2%)
Subsaharan African: 49 (0.2%)
Danish: 37 (0.1%)
West Indian: 31 (0.10%)
Swiss: 30 (0.10%)
Slovak: 18 (0.06%)
Most common places of birth for foreign-born residents (%):
Canada
Merrimack:
30.2% (380)
New Hampshire:
22.9% (12,397)
Germany
Merrimack:
6.5% (82)
New Hampshire:
4.9% (2,670)
China, excluding Hong Kong and Taiwan
Merrimack:
6.4% (80)
New Hampshire:
3.4% (1,828)
India
Merrimack:
5.9% (74)
New Hampshire:
4.7% (2,530)
United Kingdom
Merrimack:
5.8% (73)
New Hampshire:
8.1% (4,396)
Korea
Merrimack:
4.0% (50)
New Hampshire:
2.9% (1,582)
Taiwan
Merrimack:
3.6% (45)
New Hampshire:
0.9% (464)
Japan
Merrimack:
3.3% (41)
New Hampshire:
1.3% (706)
Vietnam
Merrimack:
3.0% (38)
New Hampshire:
2.7% (1,440)
Greece
Merrimack:
2.7% (34)
New Hampshire:
2.3% (1,261)
Ireland
Merrimack:
2.2% (28)
New Hampshire:
1.5% (837)
Italy
Merrimack:
2.1% (26)
New Hampshire:
1.5% (813)
Poland
Merrimack:
2.1% (26)
New Hampshire:
1.7% (931)
Argentina
Merrimack:
2.1% (26)
New Hampshire:
0.3% (168)
Brazil
Merrimack:
2.1% (26)
New Hampshire:
2.0% (1,103)
Netherlands
Merrimack:
2.0% (25)
New Hampshire:
0.9% (471)
Malaysia
Merrimack:
1.8% (23)
New Hampshire:
0.2% (89)
Place of birth for U.S.-born residents:
This state: 10,063
Other state: 13,665
Northeast: 10,606
Midwest: 1,073
South: 1,429
West: 557
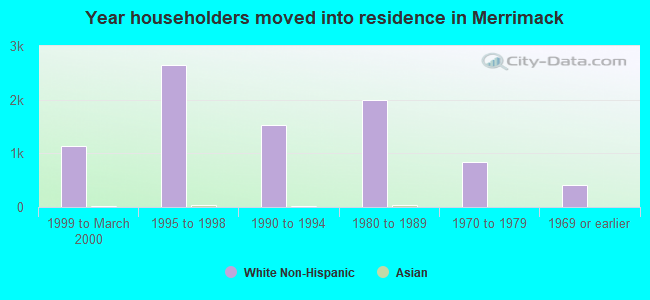
58% of Merrimack residents lived in the same house 5 years ago. Out of people who lived in different houses, 64% lived in this county. Out of people who lived in different counties, 17% lived in New Hampshire.
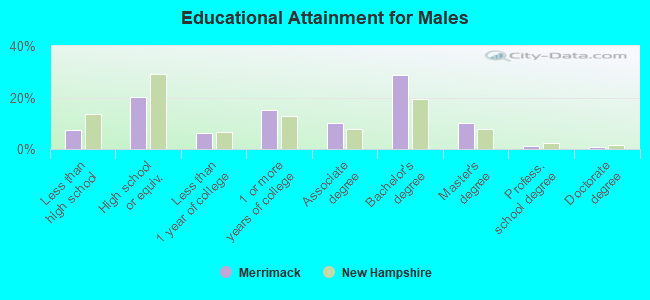
Education attainment for males 25 years and older:
No schooling: 31
Nursery to 4th grade: 12
5th and 6th grade: 20
7th and 8th grade: 67
9th grade: 97
10th grade: 129
11th grade: 82
12th grade, no diploma: 154
High school graduate (or equivalency): 1,634
Less than 1 year of college: 488
Some college more than 1 year, no degree: 1,221
Associate degree: 799
Bachelor's degree: 2,319
Master's degree: 818
Professional school degree: 86
Doctorate degree: 74
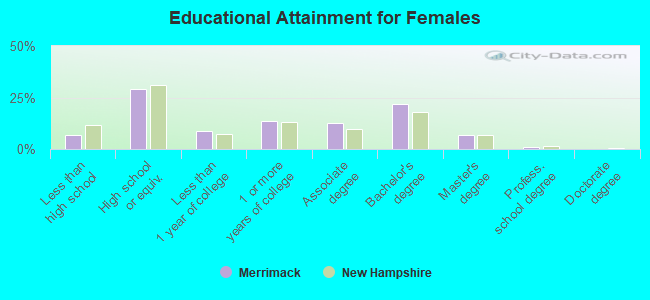
Education attainment for females 25 years and older:
No schooling: 9
Nursery to 4th grade: 0
5th and 6th grade: 22
7th and 8th grade: 63
9th grade: 124
10th grade: 72
11th grade: 121
12th grade, no diploma: 160
High school graduate (or equivalency): 2,450
Less than 1 year of college: 749
Some college more than 1 year, no degree: 1,139
Associate degree: 1,052
Bachelor's degree: 1,835
Master's degree: 553
Professional school degree: 73
Doctorate degree: 8
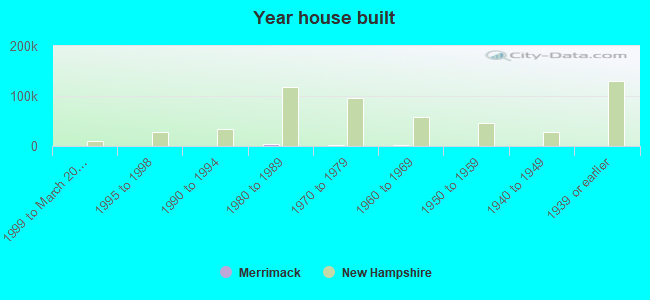
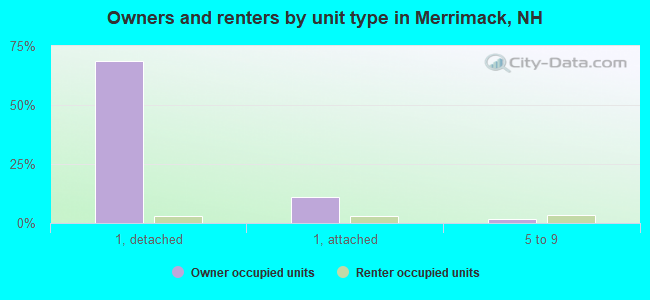
Housing units in structures:
One, detached: 6,397
One, attached: 1,256
Two: 96
3 or 4: 184
5 to 9: 451
10 to 19: 148
20 to 49: 187
50 or more: 32
Mobile homes: 208
Median worth of mobile homes: $88,423
Housing units lacking complete plumbing facilities: 0.2%
Housing units lacking complete kitchen facilities: 0.2%