Michigan City, IN (Indiana) Houses and Residents
| Michigan City: | $126,679 |
| Indiana: | $208,700 |
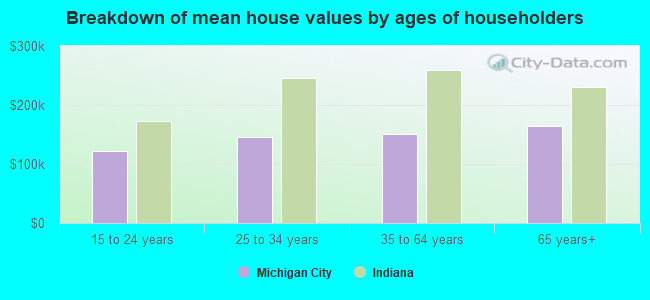
Mean price in 2022:
Detached houses: $167,225
Here: $167,225 State: $257,916 Townhouses or other attached units: $176,471
Here: $176,471 State: $224,114 In 2-unit structures: $272,161
Here: $272,161 State: $175,375 In 3-to-4-unit structures: $120,891
Here: $120,891 State: $151,116 In 5-or-more-unit structures: $226,673
Here: $226,673 State: $200,844 Mobile homes: $40,644
Here: $40,644 State: $67,116
Total population: 31,487 (All urban)
Houses: 14,898 (12,449 occupied: 7,351 owner occupied, 5,050 renter occupied)
| % of renters here: | 41% |
| State: | 29% |
Housing density: 760 houses/condos per square mile
Median price asked for vacant for-sale houses and condos in 2022: $402,734.
Median contract rent in 2022: $725 (lower quartile is $553, upper quartile is $828)
Median rent asked for vacant for-rent units in 2022: $721
Median gross rent in Michigan City, IN in 2022: $841
Housing units in Michigan City with a mortgage: 3,951 (396 second mortgage, 38 home equity loan, 332 both second mortgage and home equity loan)
Houses without a mortgage: 113
Median household income for houses/condos with a mortgage: $71,693
Median household income for apartments without a mortgage: $49,231
Median monthly housing costs: $789
Compare current foreclosures in Michigan City, IN:
| Photo | Address | Area | Beds / Baths | Price | Details |
|---|---|---|---|---|---|

|
#1
W Coolspring Ave
Michigan City, IN 46360
|
720 sq. feet
|
1 baths 2 beds |
$144,500
|
show details |

|
#2
S Carroll Ave
Michigan City, IN 46360
|
910 sq. feet
|
1 baths 2 beds |
show details | |

|
#3
Bies St
Michigan City, IN 46360
|
512 sq. feet
|
1 baths 2 beds |
show details | |

|
#4
Holliday St
Michigan City, IN 46360
|
1,867 sq. feet
|
2 baths 3 beds |
show details | |

|
#5
Manhattan St
Michigan City, IN 46360
|
2,207 sq. feet
|
2 baths 3 beds |
show details | |

|
#6
Ohio St
Michigan City, IN 46360
|
984 sq. feet
|
1 baths 3 beds |
show details | |

|
#7
Meadow Blvd
Michigan City, IN 46360
|
1,452 sq. feet
|
1 baths 3 beds |
show details | |

|
#8
Fir St
Michigan City, IN 46360
|
1,400 sq. feet
|
1 baths 3 beds |
show details | |

|
#9
Cleveland Ave
Michigan City, IN 46360
|
1,469 sq. feet
|
1 baths 3 beds |
show details | |

|
#10
Yanke Rd
Michigan City, IN 46360
|
1,196 sq. feet
|
1 baths 2 beds |
show details |
| Photo | Address | Area | Beds / Baths | Price | Details |
|---|---|---|---|---|---|

|
#11
W 625 N
Michigan City, IN 46360
|
1,812 sq. feet
|
2 baths 3 beds |
show details | |

|
#12
Division Ln
Michigan City, IN 46360
|
1,404 sq. feet
|
2 baths 3 beds |
show details | |

|
#13
S Ashland Ave
Michigan City, IN 46360
|
1,176 sq. feet
|
1 baths 3 beds |
show details | |

|
#14
S Calumet Ave
Michigan City, IN 46360
|
1,224 sq. feet
|
1 baths 3 beds |
show details | |

|
#15
Chestnut St
Michigan City, IN 46360
|
1,998 sq. feet
|
1 baths 3 beds |
show details | |

|
#16
Meadow Blvd
Michigan City, IN 46360
|
1,320 sq. feet
|
1 baths 3 beds |
show details | |

|
#17
Clover Ln
Michigan City, IN 46360
|
1,280 sq. feet
|
1 baths 3 beds |
show details | |

|
#18
Walker St
Michigan City, IN 46360
|
1,152 sq. feet
|
2 baths 5 beds |
show details | |

|
#19
N Us Highway 421
Michigan City, IN 46360
|
1,898 sq. feet
|
1 baths 3 beds |
show details | |

|
#20
Maine Ave
Michigan City, IN 46360
|
1,998 sq. feet
|
2 baths 4 beds |
show details |
| Photo | Address | Area | Beds / Baths | Price | Details |
|---|---|---|---|---|---|

|
#21
Pine St
Michigan City, IN 46360
|
1,450 sq. feet
|
1 baths 3 beds |
show details | |

|
#22
Trail St
Michigan City, IN 46360
|
1,118 sq. feet
|
1 baths 3 beds |
show details | |

|
#23
N 300 W
Michigan City, IN 46360
|
1,098 sq. feet
|
1 baths 2 beds |
show details | |

|
#24
Faulknor St
Michigan City, IN 46360
|
1,876 sq. feet
|
1 baths 3 beds |
show details | |

|
#25
Elston St
Michigan City, IN 46360
|
1,120 sq. feet
|
1 baths 3 beds |
show details | |

|
#26
Claire Ct
Michigan City, IN 46360
|
2,448 sq. feet
|
2 baths 4 beds |
show details | |

|
#27
Henry St
Michigan City, IN 46360
|
884 sq. feet
|
1 baths 3 beds |
show details | |

|
#28
Southwood Dr
Michigan City, IN 46360
|
1,189 sq. feet
|
1 baths 3 beds |
show details | |

|
#29
Clover Ln
Michigan City, IN 46360
|
1,800 sq. feet
|
2 baths 5 beds |
show details | |

|
#30
Wrobel Ave
Michigan City, IN 46360
|
777 sq. feet
|
1 baths 3 beds |
show details |
| Photo | Address | Area | Beds / Baths | Price | Details |
|---|---|---|---|---|---|

|
#31
Vail St
Michigan City, IN 46360
|
1,998 sq. feet
|
2 baths 4 beds |
show details | |

|
#32
Ohio St
Michigan City, IN 46360
|
925 sq. feet
|
1 baths 3 beds |
show details | |

|
#33
Sunnyside Dr
Michigan City, IN 46360
|
1,218 sq. feet
|
1 baths 4 beds |
show details | |

|
#34
Dorchester Rd
Michigan City, IN 46360
|
1,680 sq. feet
|
1 baths 4 beds |
show details | |

|
#35
Chestnut St
Michigan City, IN 46360
|
918 sq. feet
|
1 baths 3 beds |
show details | |

|
#36
Green St
Michigan City, IN 46360
|
1,484 sq. feet
|
2 baths 3 beds |
show details | |

|
#37
Southwood Dr
Michigan City, IN 46360
|
1,001 sq. feet
|
1 baths 3 beds |
show details | |

|
#38
Springland Ave
Michigan City, IN 46360
|
5,691 sq. feet
|
4 baths 3 beds |
show details | |

|
#39
Lexington Rd
Michigan City, IN 46360
|
1,728 sq. feet
|
1 baths 4 beds |
show details | |

|
#40
Karwick Glen Dr
Michigan City, IN 46360
|
1,660 sq. feet
|
2 baths 3 beds |
show details |
| Photo | Address | Area | Beds / Baths | Price | Details |
|---|---|---|---|---|---|

|
#41
N 525 W
Michigan City, IN 46360
|
720 sq. feet
|
1 baths 3 beds |
show details | |

|
#42
Hawthorne Dr
Michigan City, IN 46360
|
1,998 sq. feet
|
1 baths 3 beds |
show details | |

|
#43
Greentree Dr
Michigan City, IN 46360
|
950 sq. feet
|
1 baths 3 beds |
show details | |

|
#44
Manhattan St
Michigan City, IN 46360
|
1,672 sq. feet
|
1 baths - beds |
show details | |

|
#45
Cedar St
Michigan City, IN 46360
|
1,432 sq. feet
|
1 baths - beds |
show details | |

|
#46
E Barker Ave
Michigan City, IN 46360
|
864 sq. feet
|
1 baths - beds |
show details | |

|
#47
Fir St
Michigan City, IN 46360
|
1,120 sq. feet
|
1 baths - beds |
show details | |

|
#48
Helen St
Michigan City, IN 46360
|
1,280 sq. feet
|
1 baths - beds |
show details | |

|
#49
Wabash St
Michigan City, IN 46360
|
1,942 sq. feet
|
1 baths - beds |
show details | |

|
Check over 1 million property listings on Foreclosure.com!
|
browse all offers | |||


 | Portage Homes for Sale? (9 replies) |
| Current Pulse of the NWI Housing Market (22 replies) |
| The rise of Northwest Indiana in the Chicagoland area (87 replies) |
| Best place to raise kids in NWI (best schools, low crime, nice homes) (19 replies) |
| Michigan City, In. Development Thread... (39 replies) |
| Shared Office Space or Desk Rental in Michigan City (4 replies) |

Median year apartment built: 1974
Household type by relationship:
Households: 31,829- Male householders: 5,353 (2,032 living alone), Female householders: 6,995 (2,759 living alone)
3,787 spouses (3,725 opposite-sex spouses), 1,266 unmarried partners, (1,240 opposite-sex unmarried partners), 8,497 children (7,628 natural, 489 adopted, 380 stepchildren), 1,284 grandchildren, 154 brothers or sisters, 157 parents, 8 foster children, 747 other relatives, 803 non-relatives
- In group quarters: 2,772
Size of family households: 3,313 2-persons, 1,146 3-persons, 1,017 4-persons, 652 5-persons, 336 6-persons, 85 7-or-more-persons.
Size of nonfamily households: 4,737 1-person, 861 2-persons, 30 3-persons, 15 4-persons, 12 5-persons, 59 6-persons.
1,937 married couples with children.
3,592 single-parent households (622 men, 2,970 women).
95.3% of residents of Michigan City speak English at home.
2.1% of residents speak Spanish at home (78% speak English very well, 15% speak English well, 7% speak English not well).
1.0% of residents speak other Indo-European language at home (91% speak English very well, 9% speak English well).
0.6% of residents speak Asian or Pacific Island language at home (56% speak English very well, 37% speak English well, 7% speak English not well).
0.4% of residents speak other language at home (73% speak English very well, 21% speak English well, 7% speak English not well).
Foreign born population: 787 (2.5%)
(75.9% of them are naturalized citizens)
| Here: | 5.9 |
| State: | 6.6 |
| Here: | 4.3 |
| State: | 4.3 |
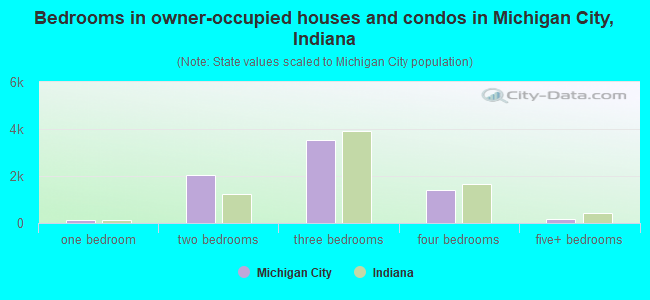
- Bedrooms in owner-occupied houses and condos in Michigan City, Indiana
- 25no bedroom
- 1351 bedroom
- 2,0522 bedrooms
- 3,5373 bedrooms
- 1,4164 bedrooms
- 1865+ bedrooms
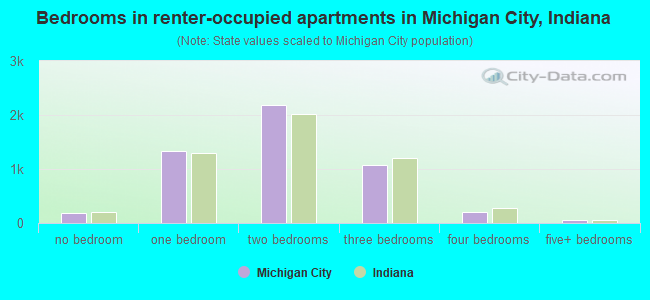
- Bedrooms in renter-occupied apartments in Michigan City, Indiana
- 182no bedroom
- 1,3411 bedroom
- 2,1792 bedrooms
- 1,0763 bedrooms
- 2114 bedrooms
- 615+ bedrooms
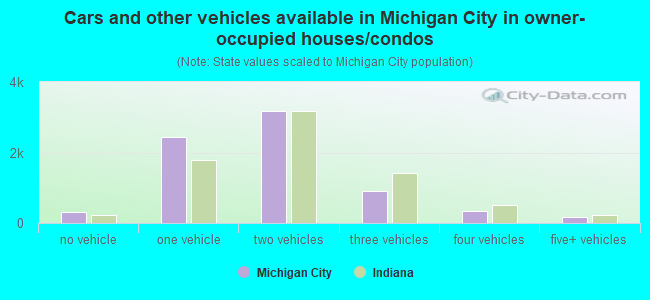
- Cars and other vehicles available in Michigan City in owner-occupied houses/condos
- 323no vehicle
- 2,4511 vehicle
- 3,1802 vehicles
- 8993 vehicles
- 3314 vehicles
- 1685+ vehicles
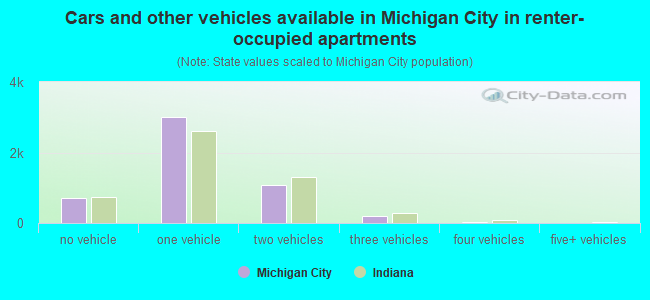
- Cars and other vehicles available in Michigan City in renter-occupied apartments
- 710no vehicle
- 3,0181 vehicle
- 1,0922 vehicles
- 1853 vehicles
- 374 vehicles
- 85+ vehicles
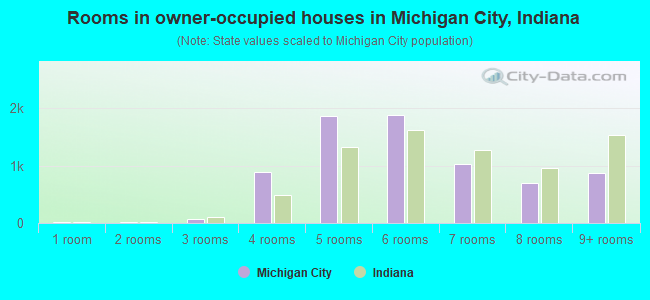
- Rooms in owner-occupied houses in Michigan City, Indiana
- 251 room
- 142 rooms
- 783 rooms
- 8934 rooms
- 1,8625 rooms
- 1,8826 rooms
- 1,0317 rooms
- 6908 rooms
- 8779+ rooms
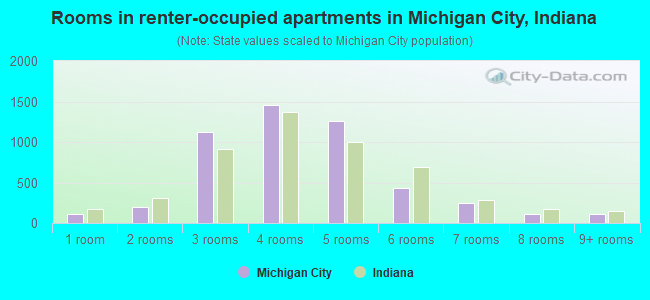
- Rooms in renter-occupied apartments in Michigan City, Indiana
- 1101 room
- 2002 rooms
- 1,1283 rooms
- 1,4604 rooms
- 1,2575 rooms
- 4376 rooms
- 2477 rooms
- 1068 rooms
- 1059+ rooms
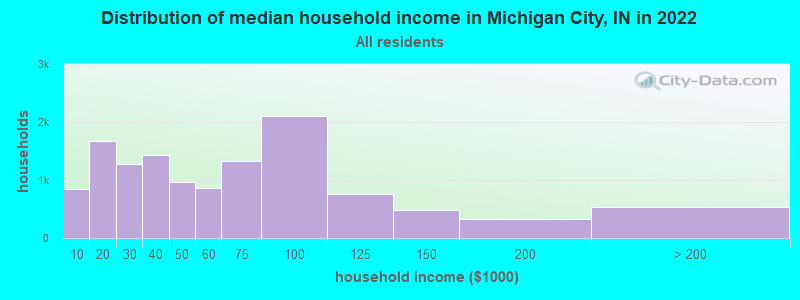
Michigan City, IN household income distribution

- 849Less than $10,000
- 1,675$10,000 to $19,999
- 1,284$20,000 to $29,999
- 1,433$30,000 to $39,999
- 964$40,000 to $49,999
- 860$50,000 to $59,999
- 1,328$60,000 to $74,999
- 2,103$75,000 to $99,999
- 751$100,000 to $124,999
- 483$125,000 to $149,999
- 322$150,000 to $199,999
- 540$200,000 or more
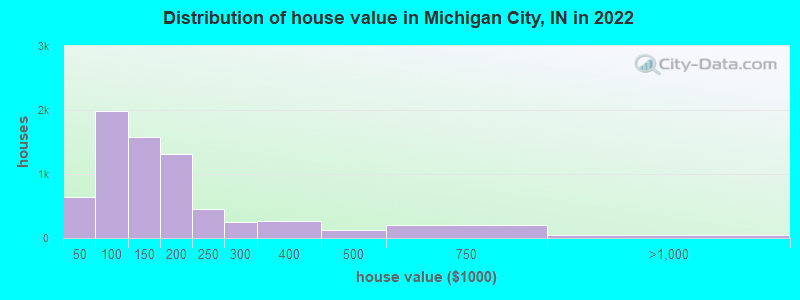
Home value of owner - occupied houses in 2022 in Michigan City, IN
-
- 319Less than $10,000
- 61$10,000 to $14,999
- 62$15,000 to $19,999
- 9$20,000 to $24,999
- 58$30,000 to $34,999
- 37$35,000 to $39,999
- 100$40,000 to $49,999
- 126$50,000 to $59,999
- 227$60,000 to $69,999
- 396$70,000 to $79,999
- 666$80,000 to $89,999
- 464$90,000 to $99,999
- 968$100,000 to $124,999
- 609$125,000 to $149,999
- 924$150,000 to $174,999
- 380$175,000 to $199,999
- 454$200,000 to $249,999
- 252$250,000 to $299,999
- 258$300,000 to $399,999
- 132$400,000 to $499,999
- 196$500,000 to $749,999
- 30$750,000 to $999,999
- 23$1,000,000 to $1,499,999
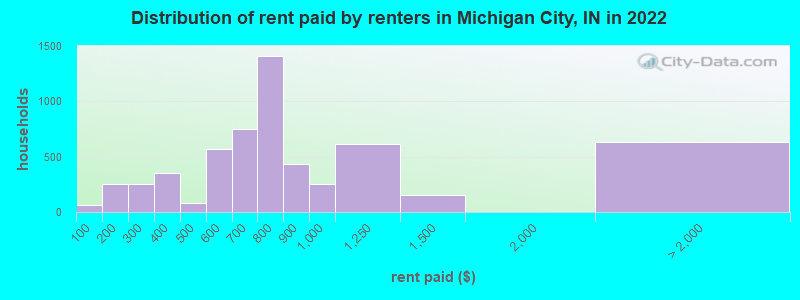
Rent paid by renters in 2022 in Michigan City, IN
-
- 58Less than $100
- 154$100 to $149
- 100$150 to $199
- 170$200 to $249
- 79$250 to $299
- 146$300 to $349
- 206$350 to $399
- 11$400 to $449
- 69$450 to $499
- 328$500 to $549
- 238$550 to $599
- 197$600 to $649
- 557$650 to $699
- 396$700 to $749
- 1,011$750 to $799
- 436$800 to $899
- 253$900 to $999
- 611$1,000 to $1,249
- 155$1,250 to $1,499
- 19$2,000 to $2,499
- 611No cash rent
Percentage of workers working in this county: 73.3%
Number of people working at home: 949 (7.3% of all workers)
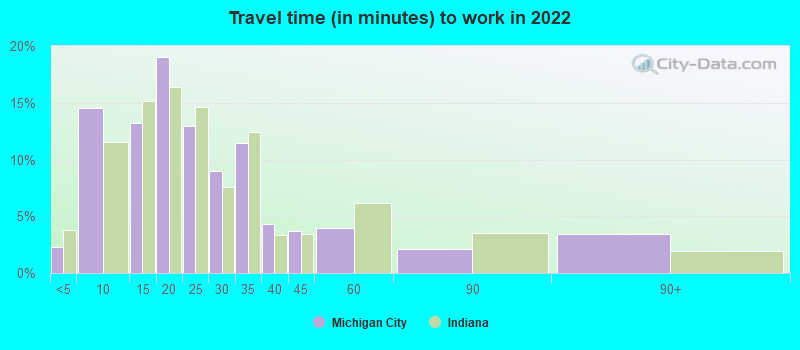
Travel time to work (commute)
- Less than 5 minutes: 372
- 5 to 9 minutes: 2,135
- 10 to 14 minutes: 1,739
- 15 to 19 minutes: 2,035
- 20 to 24 minutes: 1,215
- 25 to 29 minutes: 965
- 30 to 34 minutes: 1,241
- 35 to 39 minutes: 359
- 40 to 44 minutes: 181
- 45 to 59 minutes: 234
- 60 to 89 minutes: 502
- 90 or more minutes: 433
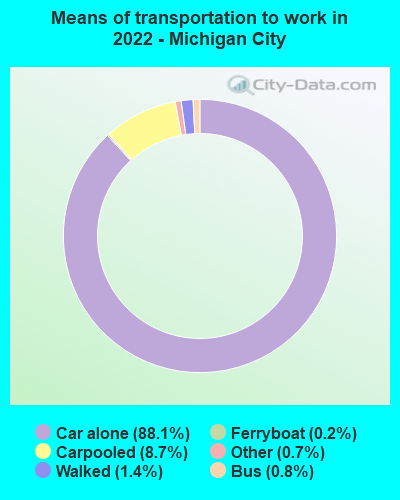
Means of transportation to work:
- Drove a car alone: 13,343 (80.9%)
- Carpooled: 1,453 (8.8%)
- Bus: 120 (0.7%)
- Long-distance train or commuter rail: 2 (0.0%)
- Ferryboat: 39 (0.2%)
- Taxi: 130 (0.8%)
- Bicycle: 11 (0.1%)
- Walked: 214 (1.3%)
- Worked at home: 949 (5.8%)
- Unemployment by race in 2022
- Unemployment rate for White non-Hispanic residents
- 3.6%Males
- 7.7%Females
- Unemployment rate for Black residents
- 12.4%Males
- 19.0%Females
- Unemployment rate for other race residents
- 14.2%Males
- Unemployment rate for two or more race residents
- 1.5%Males
- 19.1%Females
- Unemployment rate for Hispanic or Latino residents
- 9.1%Males
- 11.0%Females
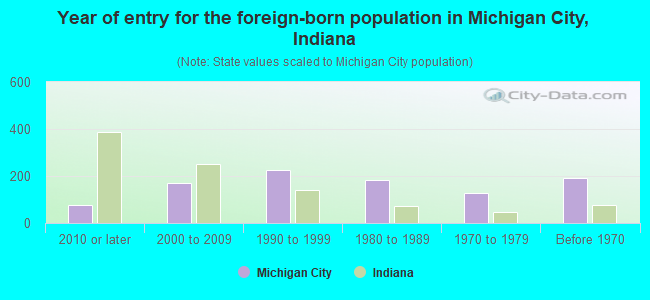
- Year of entry for the foreign-born population in Michigan City, Indiana
- 782010 or later
- 1722000 to 2009
- 2261990 to 1999
- 1851980 to 1989
- 1281970 to 1979
- 190Before 1970
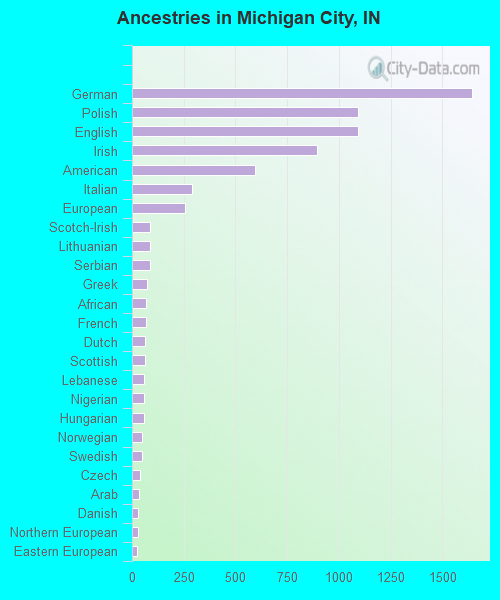
First ancestries reported:
- German: 1,643 (11.4%)
- Polish: 1,093 (7.6%)
- English: 1,093 (7.6%)
- Irish: 892 (6.2%)
- American: 592 (4.1%)
- Italian: 290 (2.0%)
- European: 256 (1.8%)
- Scotch-Irish: 88 (0.6%)
- Lithuanian: 86 (0.6%)
- Serbian: 85 (0.6%)
- Greek: 74 (0.5%)
- African: 66 (0.5%)
- French: 66 (0.5%)
- Dutch: 65 (0.5%)
- Scottish: 62 (0.4%)
- Lebanese: 59 (0.4%)
- Nigerian: 58 (0.4%)
- Hungarian: 56 (0.4%)
- Norwegian: 49 (0.3%)
- Swedish: 47 (0.3%)
- Czech: 40 (0.3%)
- Arab: 32 (0.2%)
- Danish: 30 (0.2%)
- Northern European: 27 (0.2%)
- Eastern European: 26 (0.2%)
- Croatian: 21 (0.1%)
- Russian: 20 (0.1%)
- Scandinavian: 18 (0.1%)
- Slovak: 11 (0.08%)
- Czechoslovakian: 10 (0.07%)
- French Canadian: 8 (0.06%)
- Luxembourger: 7 (0.05%)
- Austrian: 7 (0.05%)
- British: 6 (0.04%)
- Belizean: 6 (0.04%)
- Welsh: 5 (0.03%)
- Slavic: 4 (0.03%)
- Assyrian: 4 (0.03%)
- Moroccan: 2 (0.01%)
Most common places of birth for foreign-born residents (%):
| Michigan City: | 29.3% (238) |
| Indiana: | 27.0% (101,996) |
| Michigan City: | 10.1% (82) |
| Indiana: | 0.3% (977) |
| Michigan City: | 8.1% (66) |
| Indiana: | 0.2% (751) |
| Michigan City: | 8.1% (66) |
| Indiana: | 3.1% (11,851) |
| Michigan City: | 6.4% (52) |
| Indiana: | 1.7% (6,439) |
| Michigan City: | 5.8% (47) |
| Indiana: | 3.3% (12,337) |
| Michigan City: | 5.3% (43) |
| Indiana: | 2.0% (7,653) |
| Michigan City: | 5.2% (42) |
| Indiana: | 2.3% (8,656) |
| Michigan City: | 2.7% (22) |
| Indiana: | 0.2% (705) |
| Michigan City: | 2.6% (21) |
| Indiana: | 0.4% (1,406) |
Place of birth for U.S.-born residents:
- This state: 21,888
- Other state: 8,906
- Northeast: 693
- Midwest: 5,873
- South: 1,631
- West: 665
80.8% of Michigan City residents lived in the same house 1 years ago.
Out of people who lived in different houses, 30.4% lived in this county.
Out of people who lived in different counties, 53.8% lived in Indiana.
| Michigan City: | 80.8% |
| State average: | 87.1% |
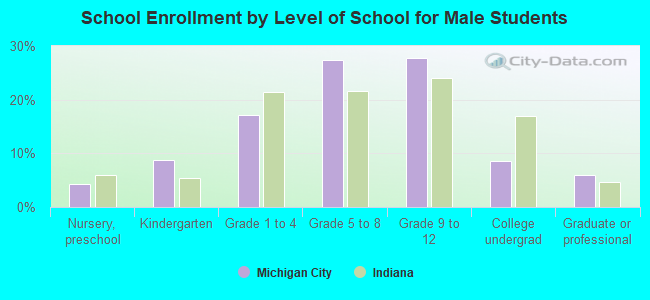
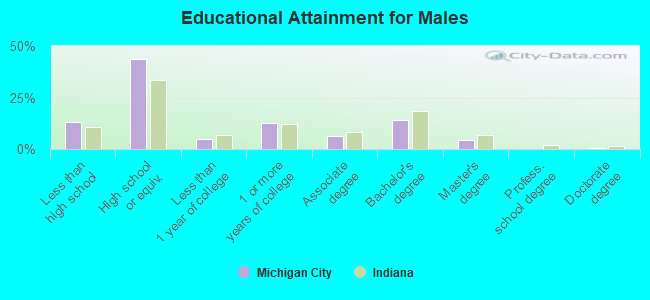
Education attainment for males 25 years and older:
- No schooling: 84
- Nursery to 4th grade: 5
- 5th and 6th grade: 186
- 7th and 8th grade: 294
- 9th grade: 59
- 10th grade: 223
- 11th grade: 193
- 12th grade, no diploma: 422
- High school graduate (or equivalency): 4,835
- Less than 1 year of college: 553
- Some college more than 1 year, no degree: 1,389
- Associate degree: 717
- Bachelor's degree: 1,547
- Master's degree: 491
- Professional school degree: 19
- Doctorate degree: 41
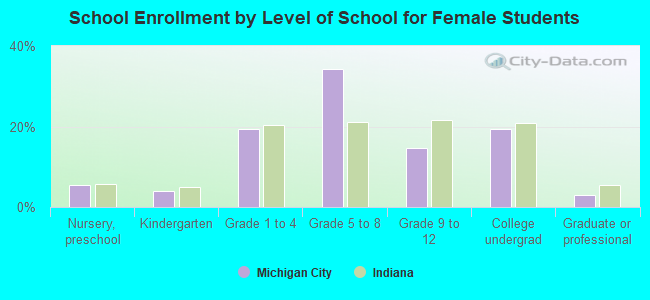
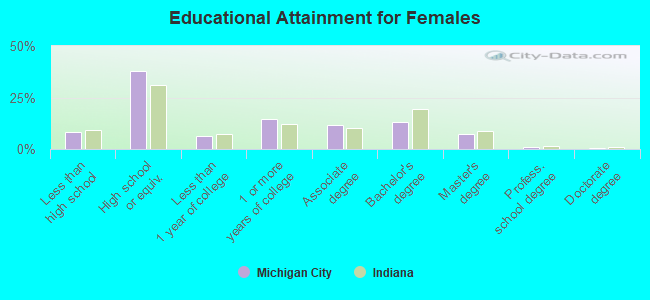
Education attainment for females 25 years and older:
- No schooling: 57
- Nursery to 4th grade: 14
- 5th and 6th grade: 57
- 7th and 8th grade: 54
- 9th grade: 45
- 10th grade: 155
- 11th grade: 179
- 12th grade, no diploma: 292
- High school graduate (or equivalency): 3,999
- Less than 1 year of college: 685
- Some college more than 1 year, no degree: 1,517
- Associate degree: 1,218
- Bachelor's degree: 1,375
- Master's degree: 770
- Professional school degree: 89
- Doctorate degree: 68
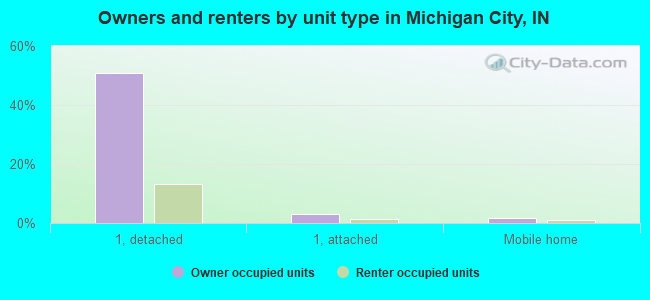
Housing units in structures:
- One, detached: 9,944
- One, attached: 420
- Two: 889
- 3 or 4: 713
- 5 to 9: 663
- 10 to 19: 784
- 20 to 49: 952
- 50 or more: 174
- Mobile homes: 356
Median worth of mobile homes: $11,413
Housing units lacking complete kitchen facilities in 2022: 3.8%
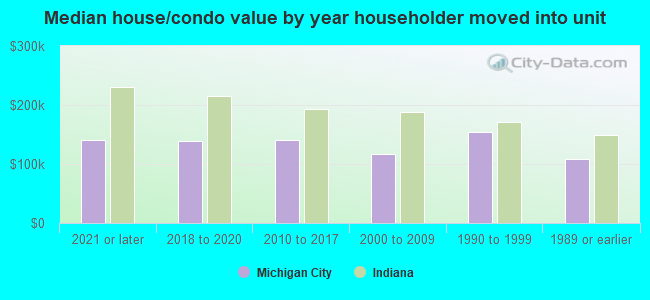
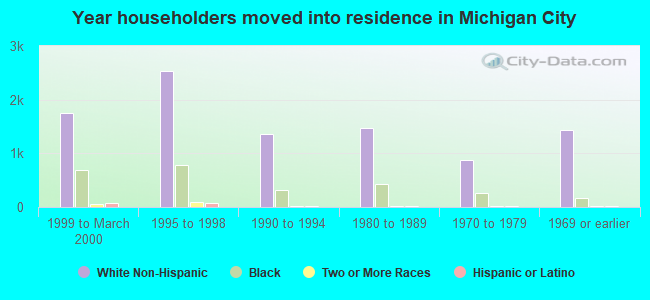
House/condo owner moved in on average 14 years ago
Renter moved in on average 5 years ago
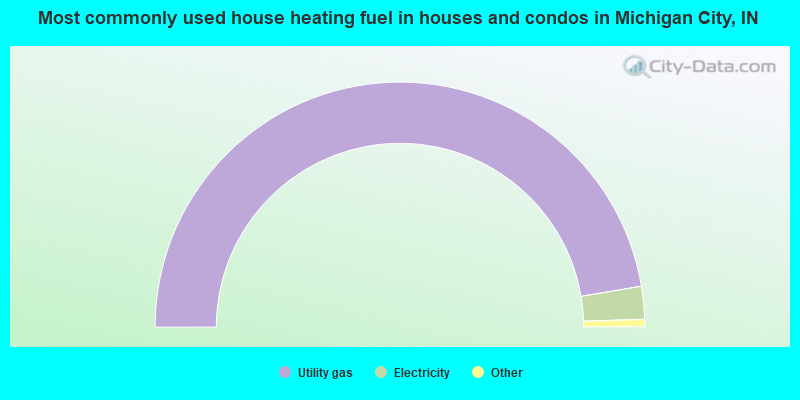
- 94.7%Utility gas
- 4.3%Electricity
- 0.5%Bottled, tank, or LP gas
- 0.2%Fuel oil, kerosene, etc.
- 0.2%No fuel used
- 0.1%Wood
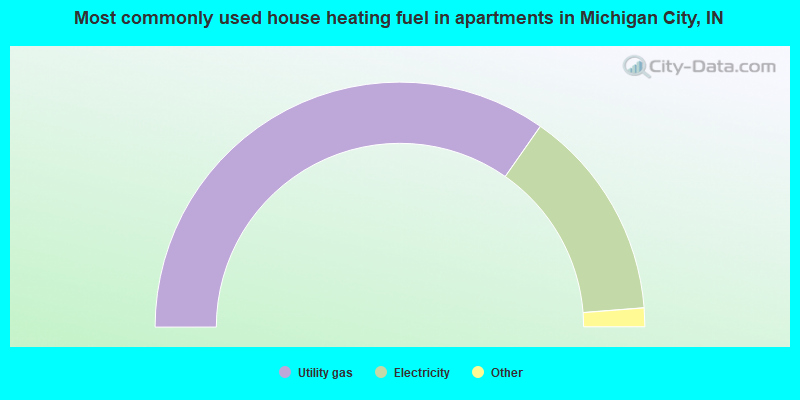
- 69.5%Utility gas
- 28.1%Electricity
- 1.2%Fuel oil, kerosene, etc.
- 0.7%No fuel used
- 0.5%Bottled, tank, or LP gas
Private vs. public school enrollment:
| Here: | 6.5% |
| Indiana: | 14.9% |
| Here: | 3.9% |
| Indiana: | 11.4% |
| Here: | 11.8% |
| Indiana: | 22.3% |