Millbury, MA (Massachusetts) Houses and Residents
| Millbury: | $395,457 |
| Massachusetts: | $534,700 |
Total population: 13,261 (Urban population: 12,164, Rural population: 620 (19 farm, 601 nonfarm))
Houses: 5,109 (4,927 occupied: 3,523 owner occupied, 1,404 renter occupied)
| % of renters here: | 28% |
| State: | 38% |
Housing density: 325 houses/condos per square mile
Median price asked for vacant for-sale houses and condos in 2022 in this county: $182,682.
Median contract rent in 2022: $1,144 (lower quartile is $874, upper quartile is $1,493)
Median rent asked for vacant for-rent units in 2022: $1,060
Median gross rent in Millbury, MA in 2022: $1,375
Housing units in Millbury with a mortgage: 2,184 (192 second mortgage, 322 home equity loan, 0 both second mortgage and home equity loan)
Houses without a mortgage: 852
Compare current foreclosures near Millbury, MA:
| Photo | Address | Area | Beds / Baths | Price | Details |
|---|---|---|---|---|---|

|
#1
Lakeview Rd
Millbury, MA 01527
|
1,523 sq. feet
|
2 baths 3 beds |
show details | |

|
#2
W Main St
Millbury, MA 01527
|
750 sq. feet
|
1 baths 4 beds |
show details | |

|
#3
Riverlin St
Millbury, MA 01527
|
1,162 sq. feet
|
2 baths 2 beds |
show details | |

|
#4
Greenwood St
Millbury, MA 01527
|
1,429 sq. feet
|
1 baths 3 beds |
show details | |

|
#5
Mccracken Rd
Millbury, MA 01527
|
2,642 sq. feet
|
3 baths 3 beds |
show details | |

|
#6
Grafton St
Millbury, MA 01527
|
1,165 sq. feet
|
1 baths 2 beds |
show details | |

|
#7
Maple Ln
Millbury, MA 01527
|
2,432 sq. feet
|
2 baths 5 beds |
show details | |

|
#8
Cedar Ave
Millbury, MA 01527
|
2,344 sq. feet
|
2 baths 4 beds |
show details | |

|
#9
Martin St
Millbury, MA 01527
|
1,806 sq. feet
|
1 baths 3 beds |
show details | |

|
#10
Marion Ave
Millbury, MA 01527
|
852 sq. feet
|
1 baths 2 beds |
show details |
| Photo | Address | Area | Beds / Baths | Price | Details |
|---|---|---|---|---|---|

|
#11
Oakes St
Millbury, MA 01527
|
1,312 sq. feet
|
1 baths 2 beds |
show details | |

|
#12
Carousel Dr
Millbury, MA 01527
|
1,302 sq. feet
|
- baths 3 beds |
show details | |

|
#13
Cobblestone Village Way, Apt 10
Millbury, MA 01527
|
- sq. feet
|
- baths - beds |
show details | |

|
#14
Grafton St
Millbury, MA 01527
|
- sq. feet
|
- baths - beds |
show details | |

|
#15
Miles St
Millbury, MA 01527
|
- sq. feet
|
- baths - beds |
show details | |

|
#16
Millbury Ave
Millbury, MA 01527
|
2,470 sq. feet
|
- baths - beds |
show details | |

|
#17
Millbury Ave, Apt 301a
Millbury, MA 01527
|
- sq. feet
|
- baths - beds |
show details | |

|
#18
N Brookfield Rd
Oakham, MA 01068
|
1,078 sq. feet
|
1 baths 2 beds |
$439,900
|
show details |

|
#19
Mount Pleasant Rd
Harrisville, RI 02830
|
1,232 sq. feet
|
1 baths 3 beds |
$449,900
|
show details |

|
#20
Clarence Dr
Oxford, MA 01540
|
3,010 sq. feet
|
3 baths 5 beds |
$569,900
|
show details |
| Photo | Address | Area | Beds / Baths | Price | Details |
|---|---|---|---|---|---|

|
#21
Treadwell Ter
Spencer, MA 01562
|
960 sq. feet
|
1 baths 3 beds |
show details | |

|
#22
-42 N Main St
Whitinsville, MA 01588
|
2,318 sq. feet
|
4 baths 6 beds |
show details | |

|
#23
Goodnow Ln
Framingham, MA 01702
|
2,342 sq. feet
|
2 baths 4 beds |
show details | |

|
#24
Redfield Rd
Cherry Valley, MA 01611
|
1,412 sq. feet
|
1 baths 3 beds |
show details | |

|
#25
Pocasset Ave
Worcester, MA 01606
|
2,090 sq. feet
|
3 baths 3 beds |
show details | |

|
#26
Kenberma Rd
Worcester, MA 01604
|
- sq. feet
|
2 baths 3 beds |
show details | |

|
#27
Southbridge Rd Unit 104
Charlton, MA 01507
|
1,266 sq. feet
|
2 baths 2 beds |
show details | |

|
#28
Loxwood St
Worcester, MA 01604
|
1,001 sq. feet
|
1 baths 2 beds |
show details | |

|
#29
Pine St
Dudley, MA 01571
|
1,414 sq. feet
|
2 baths 4 beds |
show details | |

|
#30
Everett Cir
Hopkinton, MA 01748
|
5,180 sq. feet
|
3 baths 4 beds |
show details |
| Photo | Address | Area | Beds / Baths | Price | Details |
|---|---|---|---|---|---|

|
#31
Leicester St
Auburn, MA 01501
|
912 sq. feet
|
1 baths 2 beds |
show details | |

|
#32
N Main St
Pascoag, RI 02859
|
- sq. feet
|
- baths - beds |
$100,000
|
show details |

|
#33
1/2 Putnam Hill Road
Sutton, MA 01590
|
1,415 sq. feet
|
1 baths 3 beds |
show details | |

|
#34
Hawkins St
Worcester, MA 01604
|
864 sq. feet
|
1 baths 3 beds |
show details | |

|
#35
Ledge Ave
Spencer, MA 01562
|
2,791 sq. feet
|
3 baths 4 beds |
show details | |

|
#36
Conway St
Worcester, MA 01607
|
912 sq. feet
|
1 baths 2 beds |
show details | |

|
#37
Millville Rd
Uxbridge, MA 01569
|
960 sq. feet
|
1 baths 3 beds |
show details | |

|
#38
Haven St
Milford, MA 01757
|
2,448 sq. feet
|
2 baths 4 beds |
show details | |

|
#39
Sunset Dr
Milford, MA 01757
|
1,104 sq. feet
|
1 baths 3 beds |
show details | |

|
#40
Holbrook Ln
Paxton, MA 01612
|
1,600 sq. feet
|
2 baths 3 beds |
show details |
| Photo | Address | Area | Beds / Baths | Price | Details |
|---|---|---|---|---|---|

|
#41
Chapin St
Uxbridge, MA 01569
|
3,028 sq. feet
|
2 baths 3 beds |
show details | |

|
#42
Lakeview Dr
Charlton, MA 01507
|
1,235 sq. feet
|
1 baths 2 beds |
show details | |

|
#43
Union St
Holden, MA 01520
|
3,019 sq. feet
|
2 baths 4 beds |
show details | |

|
#44
Hancock St
Milford, MA 01757
|
1,946 sq. feet
|
1 baths 4 beds |
show details | |

|
#45
Trinity Dr
Milford, MA 01757
|
1,632 sq. feet
|
1 baths 4 beds |
show details | |

|
#46
Jodie Cir
Uxbridge, MA 01569
|
1,184 sq. feet
|
2 baths 3 beds |
show details | |

|
#47
Pine St
Dudley, MA 01571
|
1,118 sq. feet
|
1 baths 2 beds |
show details | |

|
#48
Blackstone St
Uxbridge, MA 01569
|
1,060 sq. feet
|
1 baths 2 beds |
show details | |

|
#49
Cole Dr
Hopkinton, MA 01748
|
2,006 sq. feet
|
2 baths 3 beds |
show details | |

|
Check over 1 million property listings on Foreclosure.com!
|
browse all offers | |||
Latest news about housing in Millbury, MA collected exclusively by city-data.com from local newspapers, TV, and radio stations

 | How Much Massachusetts Households Make Per Year: Census Data (37 replies) |
| 2021 Real Estate Observations (1729 replies) |
| Millbury SFH detached rental $1000 (53 replies) |
| Moving Small Family to Worcester. Advice? (25 replies) |
| One1 job in Hartford 1 in Cambridge - Best town to live (51 replies) |
| Worcester MA move considerations questions (63 replies) |

Household type by relationship:
Households: 771,507- In family households: 644,137 (138,415 male householders, 64,187 female householders)
151,406 spouses, 234,038 children (220,335 natural, 5,096 adopted, 8,607 stepchildren), 11,080 grandchildren, 6,742 brothers or sisters, 7,870 parents, foster children, 7,297 other relatives, 18,119 non-relatives
- In nonfamily households: 127,370 (47,312 male householders (35,337 living alone)), 53,166 female householders (44,100 living alone)), 26,892 nonrelatives
- In group quarters: 27,045 (11,315 institutionalized population)
135,695 married couples with children.
42,745 single-parent households (8,218 men, 34,527 women).
93.2% of residents of Millbury speak English at home.
1.5% of residents speak Spanish at home (82% speak English very well, 18% speak English well).
4.3% of residents speak other Indo-European language at home (69% speak English very well, 19% speak English well, 12% speak English not well).
0.6% of residents speak Asian or Pacific Island language at home (63% speak English very well, 37% speak English well).
0.3% of residents speak other language at home (100% speak English very well).
Foreign born population: 773 (5.3%)
(101.4% of them are naturalized citizens)
| Here: | 6.4 |
| State: | 6.5 |
| Here: | 4.3 |
| State: | 4.0 |

- Bedrooms in owner-occupied houses and condos in Millbury, Massachusetts
- 0no bedroom
- 561 bedroom
- 6952 bedrooms
- 1,9833 bedrooms
- 6774 bedrooms
- 1125+ bedrooms

- Bedrooms in renter-occupied apartments in Millbury, Massachusetts
- 20no bedroom
- 4181 bedroom
- 6002 bedrooms
- 3373 bedrooms
- 294 bedrooms
- 05+ bedrooms

- Cars and other vehicles available in Millbury in owner-occupied houses/condos
- 143no vehicle
- 9091 vehicle
- 1,7052 vehicles
- 5263 vehicles
- 1444 vehicles
- 965+ vehicles

- Cars and other vehicles available in Millbury in renter-occupied apartments
- 247no vehicle
- 7301 vehicle
- 3442 vehicles
- 403 vehicles
- 304 vehicles
- 135+ vehicles

- Rooms in owner-occupied houses in Millbury, Massachusetts
- 01 room
- 72 rooms
- 03 rooms
- 2474 rooms
- 7005 rooms
- 1,0296 rooms
- 6947 rooms
- 4728 rooms
- 3749+ rooms

- Rooms in renter-occupied apartments in Millbury, Massachusetts
- 121 room
- 1532 rooms
- 1973 rooms
- 3984 rooms
- 3845 rooms
- 1486 rooms
- 947 rooms
- 188 rooms
- 09+ rooms


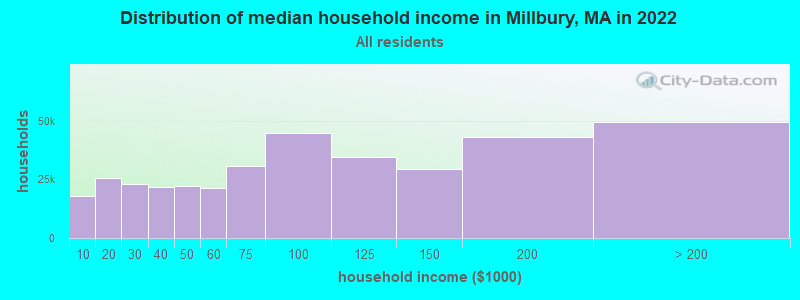
Millbury, MA household income distribution

- 17,820Less than $10,000
- 25,425$10,000 to $19,999
- 23,155$20,000 to $29,999
- 21,552$30,000 to $39,999
- 22,070$40,000 to $49,999
- 21,131$50,000 to $59,999
- 30,665$60,000 to $74,999
- 44,601$75,000 to $99,999
- 34,619$100,000 to $124,999
- 29,582$125,000 to $149,999
- 43,085$150,000 to $199,999
- 49,386$200,000 or more
Percentage of workers working in this county: 84.4%
Number of people working at home: 1,300 (16.0% of all workers)
Travel time to work (commute)
- Less than 5 minutes: 174
- 5 to 9 minutes: 718
- 10 to 14 minutes: 899
- 15 to 19 minutes: 1,027
- 20 to 24 minutes: 1,196
- 25 to 29 minutes: 372
- 30 to 34 minutes: 828
- 35 to 39 minutes: 207
- 40 to 44 minutes: 199
- 45 to 59 minutes: 360
- 60 to 89 minutes: 305
- 90 or more minutes: 140
Means of transportation to work:
- Drove a car alone: 5,677 (84.8%)
- Carpooled: 545 (8.1%)
- Bus or trolley bus: 39 (0.6%)
- Subway or elevated: 6 (0.1%)
- Railroad: 42 (0.6%)
- Bicycle: 7 (0.1%)
- Walked: 86 (1.3%)
- Other means: 23 (0.3%)
- Worked at home: 271 (4.0%)


- Year of entry for the foreign-born population in Millbury, Massachusetts
- 131995 to March 2000
- 181990 to 1994
- 281985 to 1989
- 401980 to 1984
- 211975 to 1979
- 591970 to 1974
- 521965 to 1969
- 149Before 1965

First ancestries reported:
- Irish: 2,849 (17.5%)
- French: 2,768 (17.0%)
- Italian: 1,689 (10.4%)
- English: 1,558 (9.6%)
- French Canadian: 1,403 (8.6%)
- Polish: 1,174 (7.2%)
- Swedish: 993 (6.1%)
- Other: 934 (5.7%)
- United States: 705 (4.3%)
- Lithuanian: 541 (3.3%)
- German: 528 (3.2%)
- Scottish: 355 (2.2%)
- Arab: 154 (0.9%)
- Scotch-Irish: 125 (0.8%)
- Dutch: 82 (0.5%)
- Portuguese: 80 (0.5%)
- Norwegian: 69 (0.4%)
- Ukrainian: 50 (0.3%)
- Welsh: 45 (0.3%)
- Greek: 42 (0.3%)
- Russian: 41 (0.3%)
- Danish: 38 (0.2%)
- Slovak: 7 (0.04%)
- Czech: 6 (0.04%)
- Hungarian: 6 (0.04%)
- Swiss: 5 (0.03%)
Most common places of birth for foreign-born residents (%):
| Millbury: | 11.3% (43) |
| Massachusetts: | 5.2% (40,247) |
| Millbury: | 9.5% (36) |
| Massachusetts: | 1.8% (13,543) |
| Millbury: | 9.2% (35) |
| Massachusetts: | 3.7% (28,319) |
| Millbury: | 7.6% (29) |
| Massachusetts: | 0.2% (1,824) |
| Millbury: | 5.3% (20) |
| Massachusetts: | 3.6% (28,086) |
| Millbury: | 4.7% (18) |
| Massachusetts: | 4.7% (36,669) |
| Millbury: | 4.5% (17) |
| Massachusetts: | 0.5% (3,868) |
| Millbury: | 4.5% (17) |
| Massachusetts: | 1.0% (7,867) |
| Millbury: | 3.9% (15) |
| Massachusetts: | 0.8% (5,895) |
| Millbury: | 3.7% (14) |
| Massachusetts: | 2.3% (17,987) |
| Millbury: | 3.7% (14) |
| Massachusetts: | 1.6% (12,350) |
| Millbury: | 3.7% (14) |
| Massachusetts: | 0.4% (3,048) |
| Millbury: | 3.4% (13) |
| Massachusetts: | 3.3% (25,403) |
| Millbury: | 3.2% (12) |
| Massachusetts: | 0.6% (4,578) |
| Millbury: | 2.4% (9) |
| Massachusetts: | 0.4% (3,051) |
| Millbury: | 2.4% (9) |
| Massachusetts: | 1.0% (7,414) |
| Millbury: | 2.4% (9) |
| Massachusetts: | 0.3% (2,633) |
| Millbury: | 2.1% (8) |
| Massachusetts: | 3.9% (30,457) |
| Millbury: | 2.1% (8) |
| Massachusetts: | 0.5% (3,834) |
| Millbury: | 1.8% (7) |
| Massachusetts: | 0.7% (5,693) |
| Millbury: | 1.6% (6) |
| Massachusetts: | 0.2% (1,418) |
| Millbury: | 1.6% (6) |
| Massachusetts: | 1.9% (14,883) |
| Millbury: | 1.6% (6) |
| Massachusetts: | 0.5% (3,660) |
| Millbury: | 1.6% (6) |
| Massachusetts: | 0.2% (1,303) |
Place of birth for U.S.-born residents:
- This state: 11,200
- Other state: 1,172
- Northeast: 818
- Midwest: 125
- South: 91
- West: 138
68% of Millbury residents lived in the same house 5 years ago.
Out of people who lived in different houses, 80% lived in this county.
Out of people who lived in different counties, 52% lived in Massachusetts.
Education attainment for males 25 years and older:
- No schooling: 0
- Nursery to 4th grade: 0
- 5th and 6th grade: 35
- 7th and 8th grade: 160
- 9th grade: 125
- 10th grade: 129
- 11th grade: 100
- 12th grade, no diploma: 107
- High school graduate (or equivalency): 1,625
- Less than 1 year of college: 207
- Some college more than 1 year, no degree: 639
- Associate degree: 383
- Bachelor's degree: 393
- Master's degree: 200
- Professional school degree: 39
- Doctorate degree: 33

Education attainment for females 25 years and older:
- No schooling: 44
- Nursery to 4th grade: 15
- 5th and 6th grade: 22
- 7th and 8th grade: 208
- 9th grade: 92
- 10th grade: 127
- 11th grade: 169
- 12th grade, no diploma: 134
- High school graduate (or equivalency): 1,840
- Less than 1 year of college: 241
- Some college more than 1 year, no degree: 654
- Associate degree: 347
- Bachelor's degree: 685
- Master's degree: 221
- Professional school degree: 16
- Doctorate degree: 15


Housing units in structures:
- One, detached: 3,533
- One, attached: 207
- Two: 511
- 3 or 4: 485
- 5 to 9: 222
- 10 to 19: 104
- 20 to 49: 11
- 50 or more: 36
Housing units lacking complete kitchen facilities: 0.4%

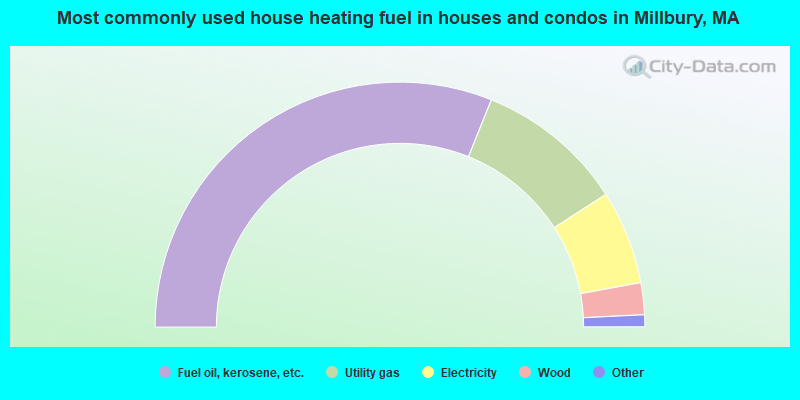
- 62.2%Fuel oil, kerosene, etc.
- 19.6%Utility gas
- 12.4%Electricity
- 4.2%Wood
- 0.8%Coal or coke
- 0.7%Bottled, tank, or LP gas
- 0.2%Other fuel
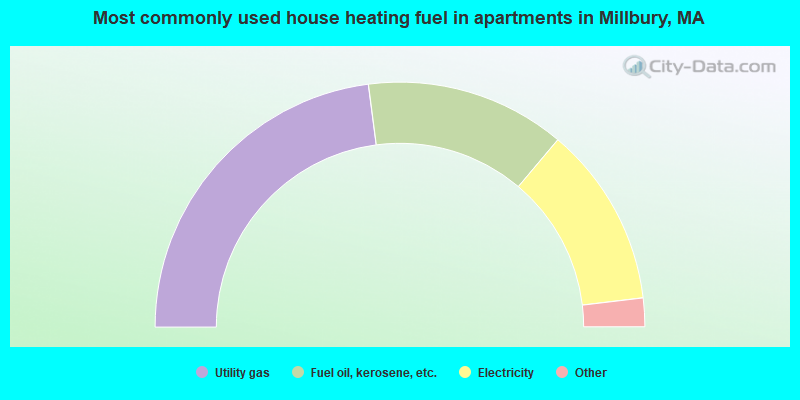
- 45.9%Utility gas
- 26.4%Fuel oil, kerosene, etc.
- 23.9%Electricity
- 2.1%Bottled, tank, or LP gas
- 1.1%Other fuel
- 0.6%Solar energy
Private vs. public school enrollment:
| Here: | 9.0% |
| Massachusetts: | 10.8% |
| Here: | 13.8% |
| Massachusetts: | 12.2% |
| Here: | 23.7% |
| Massachusetts: | 48.2% |


