Mission Bend, TX (Texas) Houses and Residents
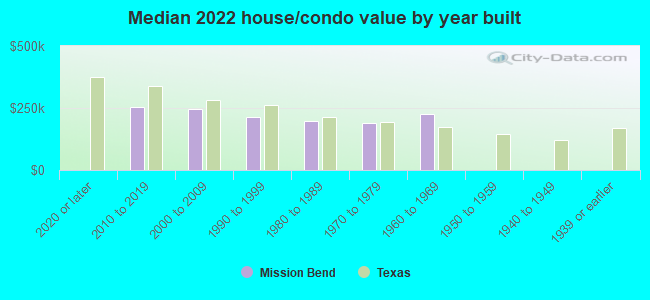
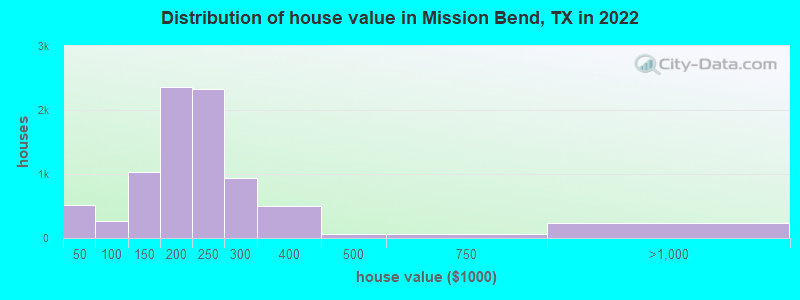
Estimated median house or condo value in 2022: $211,216 (it was $84,700 in 2000 )
Mission Bend:
$211,216Texas:
$275,400
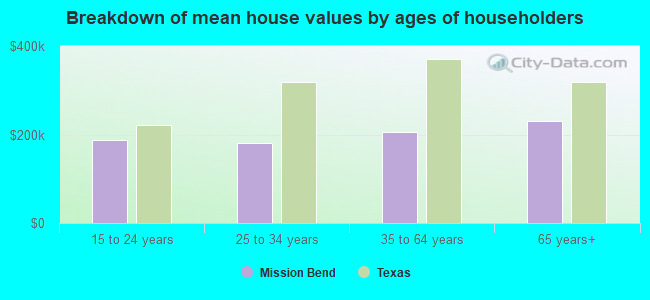
Lower value quartile - upper value quartile: $168,697 - $255,151Mean price in 2022: Detached houses: $218,267 Here:
$218,267State:
$369,058
Townhouses or other attached units: $220,037 Here:
$220,037State:
$327,631
Mobile homes: $39,740 Here:
$39,740State:
$124,413
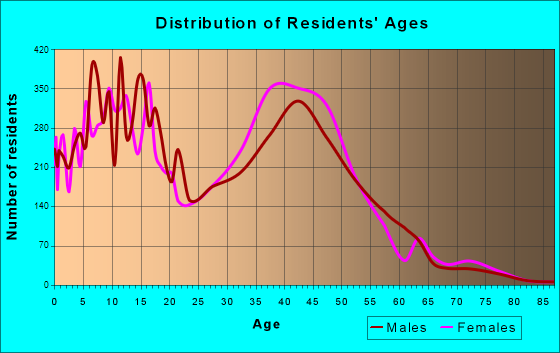
Total population: 36,501 (Urban population: 30,900, Rural population: 0)
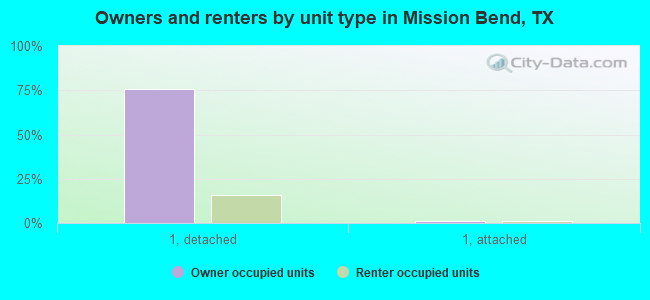
Houses: 12,423 (12,039 occupied: 9,633 owner occupied, 2,509 renter occupied )
% of renters here:
21%State:
38%
Housing density: 2,377 houses/condos per square mile
Median price asked for vacant for-sale houses and condos in 2022: $181,187.
Median contract rent in 2022: $1,258 (lower quartile is $1,027, upper quartile is $1,625)
Median rent asked for vacant for-rent units in 2022: $1,769
Median gross rent in Mission Bend, TX in 2022: $1,521
Housing units in Mission Bend with a mortgage: 4,928 (112 second mortgage, 10 home equity loan, 96 both second mortgage and home equity loan )Houses without a mortgage: 83
Median household income for houses/condos with a mortgage: $91,409
Median household income for apartments without a mortgage: $56,310
Median monthly housing costs: $1,167
Data:
Median house or condo value ($)
Median house or condo value ($ change since 2000)
Median house or condo value ($) - White
Median house or condo value ($) - Black or African American
Median house or condo value ($) - Asian
Median house or condo value ($) - Hispanic or Latino
Median house or condo value ($) - American Indian and Alaska Native
Median house or condo value ($) - Multirace
Median house or condo value ($) - Other Race
Median price asked for mobile homes ($)
Household density (households per square mile)
Mean house or condo value by units in structure - 1, detached ($)
Mean house or condo value by units in structure - 1, attached ($)
Mean house or condo value by units in structure - 2 ($)
Mean house or condo value by units in structure by units in structure - 3 or 4 ($)
Mean house or condo value by units in structure - 5 or more ($)
Mean house or condo value by units in structure - Boat, RV, van, etc. ($)
Mean house or condo value by units in structure - Mobile home ($)
Median contract rent ($)
Median contract rent - Lower quartile ($)
Median contract rent - Upper quartile ($)
Median gross rent ($)
Urban houses (%)
Rural houses (%)
Houses occupied (%)
Houses occupied (% change since 2000)
Houses owner occupied (%)
Houses owner occupied (% change since 2000)
Houses renter occupied (%)
Houses renter occupied (% change since 2000)
Vacant housing units - For rent (%)
Vacant housing units - For rent (% change since 2000)
Vacant housing units - For sale only (%)
Vacant housing units - For sale only (% change since 2000)
Vacant housing units - Rented or sold, not occupied (%)
Vacant housing units - Rented or sold, not occupied (% change since 2000)
Vacant housing units - For seasonal, recreational, or occasional use (%)
Vacant housing units - For seasonal, recreational, or occasional use (% change since 2000)
Vacant housing units - For migrant workers (%)
Vacant housing units - For migrant workers (% change since 2000)
Vacant housing units - Other vacant (%)
Vacant housing units - Other vacant (% change since 2000)
Median monthly housing costs ($)
Median household income for houses/condos with a mortgage ($)
Median household income for houses/condos without a mortgage ($)
Median household income ($)
Median household income ($) - White
Median household income ($) - Black or African American
Median household income ($) - Asian
Median household income ($) - Hispanic or Latino
Median household income ($) - American Indian and Alaska Native
Median household income ($) - Multirace
Median household income ($) - Other Race
Mortgage status - with mortgage (%)
Mortgage status - with second mortgage (%)
Mortgage status - with home equity loan (%)
Mortgage status - with both second mortgage and home equity loan (%)
Mortgage status - without a mortgage (%)
Median year house/condo built
Median year apartment built
Household type by relationship - Male householder living alone (%)
Household type by relationship - Male householder not living alone (%)
Household type by relationship - Female householder living alone (%)
Household type by relationship - Female householder not living alone (%)
Household type by relationship - Opposite-Sex spouse (%)
Household type by relationship - Same-Sex spouse (%)
Household type by relationship - Opposite-Sex unmarried partner (%)
Household type by relationship - Same-Sex unmarried partner (%)
Household type by relationship - In group quarters (%)
Size of family households - 2-person household (%)
Size of family households - 3-person household (%)
Size of family households - 4-person household (%)
Size of family households - 5-person household (%)
Size of family households - 6-person household (%)
Size of family households - 7-or-more-person household (%)
Size of nonfamily households - 1-person household (%)
Size of nonfamily households - 2-person household (%)
Size of nonfamily households - 3-person household (%)
Size of nonfamily households - 4-person household (%)
Size of nonfamily households - 5-person household (%)
Size of nonfamily households - 6-person household (%)
Size of nonfamily households - 7-or-moreperson household (%)
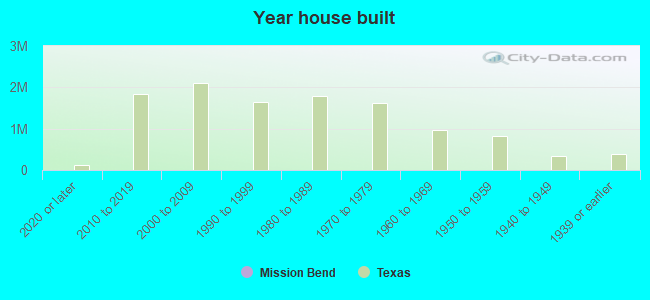
Year house built - Built 2010 or later (%)
Year house built - Built 2000 to 2009 (%)
Year house built - Built 1990 to 1999 (%)
Year house built - Built 1980 to 1989 (%)
Year house built - Built 1970 to 1979 (%)
Year house built - Built 1960 to 1969 (%)
Year house built - Built 1950 to 1959 (%)
Year house built - Built 1940 to 1949 (%)
Year house built - Built 1939 or earlier (%)
Median number of rooms in houses and condos
Median number of rooms in apartments
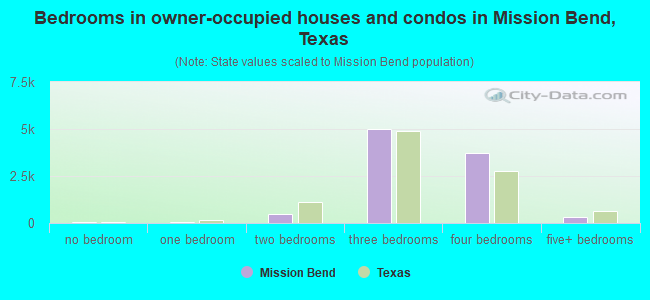
Median number of bedrooms in owner occupied houses
Mean number of bedrooms in owner occupied houses
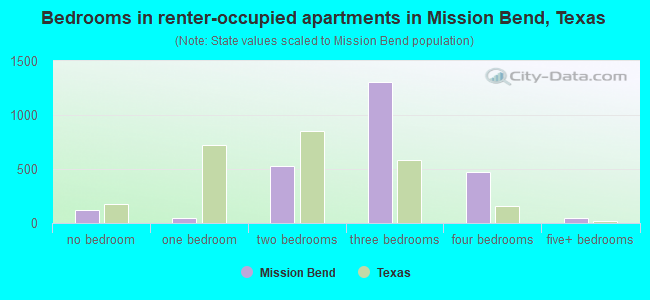
Median number of bedrooms in renter occupied houses
Mean number of bedrooms in renter occupied houses
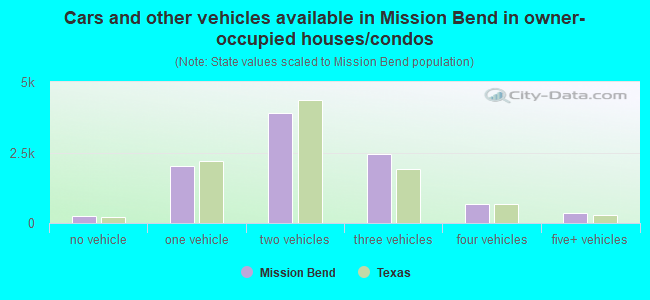
Median number of vehichles in owner occupied houses
Mean number of vehichles in owner occupied houses
Median number of vehichles in renter occupied houses
Mean number of vehichles in renter occupied houses
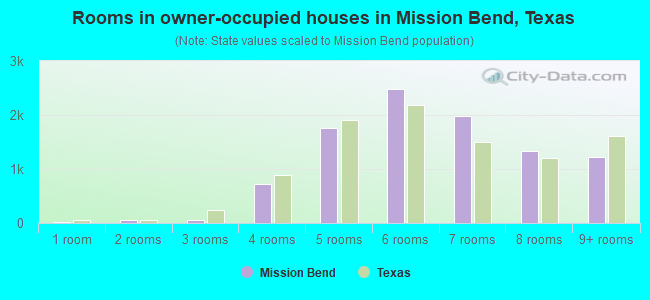
Rooms in owner-occupied houses - 1 room (%)
Rooms in owner-occupied houses - 2 rooms (%)
Rooms in owner-occupied houses - 3 rooms (%)
Rooms in owner-occupied houses - 4 rooms (%)
Rooms in owner-occupied houses - 5 rooms (%)
Rooms in owner-occupied houses - 6 rooms (%)
Rooms in owner-occupied houses - 7 rooms (%)
Rooms in owner-occupied houses - 8 rooms (%)
Rooms in owner-occupied houses - 9+ rooms (%)
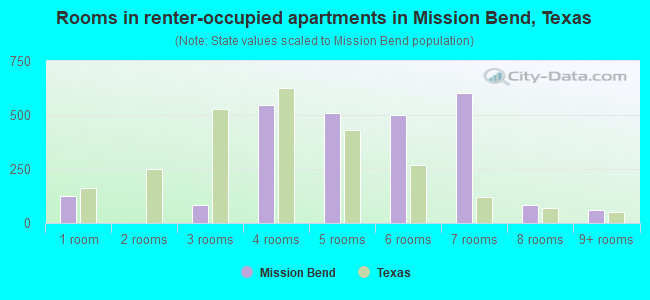
Rooms in renter-occupied houses - 1 room (%)
Rooms in renter-occupied houses - 2 rooms (%)
Rooms in renter-occupied houses - 3 rooms (%)
Rooms in renter-occupied houses - 4 rooms (%)
Rooms in renter-occupied houses - 5 rooms (%)
Rooms in renter-occupied houses - 6 rooms (%)
Rooms in renter-occupied houses - 7 rooms (%)
Rooms in renter-occupied houses - 8 rooms (%)
Rooms in renter-occupied houses - 9+ rooms (%)
Bedrooms in owner-occupied houses - no bedrooms (%)
Bedrooms in owner-occupied houses - 1 bedroom (%)
Bedrooms in owner-occupied houses - 2 bedrooms (%)
Bedrooms in owner-occupied houses - 3 bedrooms (%)
Bedrooms in owner-occupied houses - 4 bedrooms (%)
Bedrooms in owner-occupied houses - 5+ bedrooms (%)
Bedrooms in renter-occupied houses - no bedrooms (%)
Bedrooms in renter-occupied houses - 1 bedroom (%)
Bedrooms in renter-occupied houses - 2 bedrooms (%)
Bedrooms in renter-occupied houses - 3 bedrooms (%)
Bedrooms in renter-occupied houses - 4 bedrooms (%)
Bedrooms in renter-occupied houses - 5+ bedrooms (%)
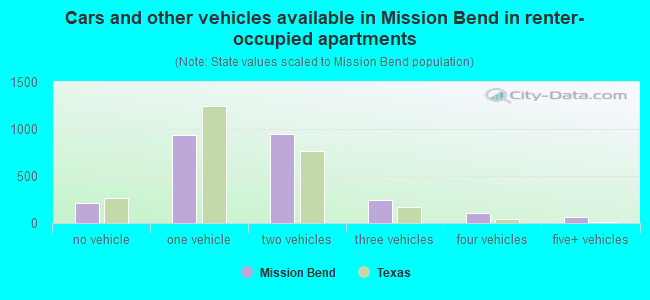
Vehicles available in owner-occupied houses - no vehicle available (%)
Vehicles available in owner-occupied houses - 1 vehicle available(%)
Vehicles available in owner-occupied houses - 2 Vehicles available (%)
Vehicles available in owner-occupied houses - 3 Vehicles available (%)
Vehicles available in owner-occupied houses - 4 Vehicles available (%)
Vehicles available in owner-occupied houses - 5+ Vehicles available (%)
Vehicles available in renter-occupied houses - no vehicle available (%)
Vehicles available in renter-occupied houses - 1 vehicle available (%)
Vehicles available in renter-occupied houses - 2 Vehicles available (%)
Vehicles available in renter-occupied houses - 3 Vehicles available (%)
Vehicles available in renter-occupied houses - 4 Vehicles available (%)
Vehicles available in renter-occupied houses - 5+ Vehicles available (%)
Housing units in structures - 1, detached (%)
Housing units in structures - 1, attached (%)
Housing units in structures - 2 (%)
Housing units in structures - 3 or 4 (%)
Housing units in structures - 5 to 9 (%)
Housing units in structures - 10 to 19 (%)
Housing units in structures - 20 to 49 (%)
Housing units in structures - 50 or more (%)
Housing units in structures - Mobile home (%)
Housing units in structures - Boat, RV, van, etc. (%)
Housing units in structures - Owners - 1, detached (%)
Housing units in structures - Owners - 1, attached (%)
Housing units in structures - Owners - 2 (%)
Housing units in structures - Owners - 3 or 4 (%)
Housing units in structures - Owners - 5 to 9 (%)
Housing units in structures - Owners - 10 to 19 (%)
Housing units in structures - Owners - 20 to 49 (%)
Housing units in structures - Owners - 50 or more (%)
Housing units in structures - Owners - Mobile home (%)
Housing units in structures - Owners - Boat, RV, van, etc. (%)
Housing units in structures - Renters - 1, detached (%)
Housing units in structures - Renters - 1, attached (%)
Housing units in structures - Renters - 2 (%)
Housing units in structures - Renters - 3 or 4 (%)
Housing units in structures - Renters - 5 to 9 (%)
Housing units in structures - Renters - 10 to 19 (%)
Housing units in structures - Renters - 20 to 49 (%)
Housing units in structures - Renters - 50 or more (%)
Housing units in structures - Renters - Mobile home (%)
Housing units in structures - Renters - Boat, RV, van, etc. (%)
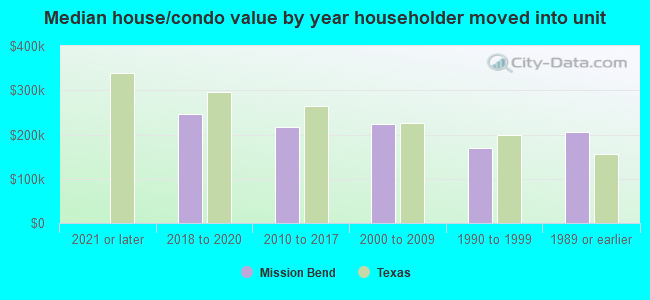
House/condo owner moved in on average (years ago)
Renter moved in on average (years ago)
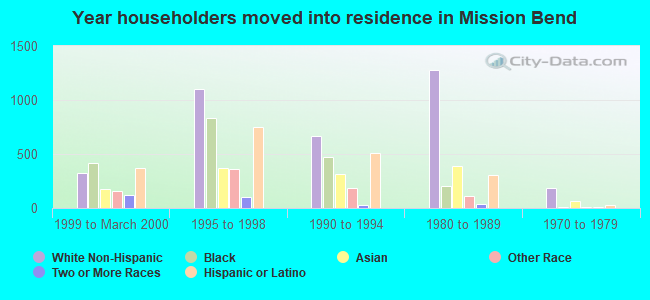
Year householder moved into unit - Moved in 1999 to March 2000 (%)
Year householder moved into unit - Moved in 1999 to March 2000 (%) - White
Year householder moved into unit - Moved in 1999 to March 2000 (%) - Black or African American
Year householder moved into unit - Moved in 1999 to March 2000 (%) - Asian
Year householder moved into unit - Moved in 1999 to March 2000 (%) - Hispanic or Latino
Year householder moved into unit - Moved in 1999 to March 2000 (%) - American Indian and Alaska Native
Year householder moved into unit - Moved in 1999 to March 2000 (%) - Multirace
Year householder moved into unit - Moved in 1999 to March 2000 (%) - Other Race
Year householder moved into unit - Moved in 1995 to 1998 (%)
Year householder moved into unit - Moved in 1995 to 1998 (%) - White
Year householder moved into unit - Moved in 1995 to 1998 (%) - Black or African American
Year householder moved into unit - Moved in 1995 to 1998 (%) - Asian
Year householder moved into unit - Moved in 1995 to 1998 (%) - Hispanic or Latino
Year householder moved into unit - Moved in 1995 to 1998 (%) - American Indian and Alaska Native
Year householder moved into unit - Moved in 1995 to 1998 (%) - Multirace
Year householder moved into unit - Moved in 1995 to 1998 (%) - Other Race
Year householder moved into unit - Moved in 1990 to 1994 (%)
Year householder moved into unit - Moved in 1990 to 1994 (%) - White
Year householder moved into unit - Moved in 1990 to 1994 (%) - Black or African American
Year householder moved into unit - Moved in 1990 to 1994 (%) - Asian
Year householder moved into unit - Moved in 1990 to 1994 (%) - Hispanic or Latino
Year householder moved into unit - Moved in 1990 to 1994 (%) - American Indian and Alaska Native
Year householder moved into unit - Moved in 1990 to 1994 (%) - Multirace
Year householder moved into unit - Moved in 1990 to 1994 (%) - Other Race
Year householder moved into unit - Moved in 1980 to 1989 (%)
Year householder moved into unit - Moved in 1980 to 1989 (%) - White
Year householder moved into unit - Moved in 1980 to 1989 (%) - Black or African American
Year householder moved into unit - Moved in 1980 to 1989 (%) - Asian
Year householder moved into unit - Moved in 1980 to 1989 (%) - Hispanic or Latino
Year householder moved into unit - Moved in 1980 to 1989 (%) - American Indian and Alaska Native
Year householder moved into unit - Moved in 1980 to 1989 (%) - Multirace
Year householder moved into unit - Moved in 1980 to 1989 (%) - Other Race
Year householder moved into unit - Moved in 1970 to 1979 (%)
Year householder moved into unit - Moved in 1970 to 1979 (%) - White
Year householder moved into unit - Moved in 1970 to 1979 (%) - Black or African American
Year householder moved into unit - Moved in 1970 to 1979 (%) - Asian
Year householder moved into unit - Moved in 1970 to 1979 (%) - Hispanic or Latino
Year householder moved into unit - Moved in 1970 to 1979 (%) - American Indian and Alaska Native
Year householder moved into unit - Moved in 1970 to 1979 (%) - Multirace
Year householder moved into unit - Moved in 1970 to 1979 (%) - Other Race
Year householder moved into unit - Moved in 1969 or earlier (%)
Year householder moved into unit - Moved in 1969 or earlier (%) - White
Year householder moved into unit - Moved in 1969 or earlier (%) - Black or African American
Year householder moved into unit - Moved in 1969 or earlier (%) - Asian
Year householder moved into unit - Moved in 1969 or earlier (%) - Hispanic or Latino
Year householder moved into unit - Moved in 1969 or earlier (%) - American Indian and Alaska Native
Year householder moved into unit - Moved in 1969 or earlier (%) - Multirace
Year householder moved into unit - Moved in 1969 or earlier (%) - Other Race
Housing units lacking complete plumbing facilities (%)
Housing units lacking complete kitchen facilities (%)
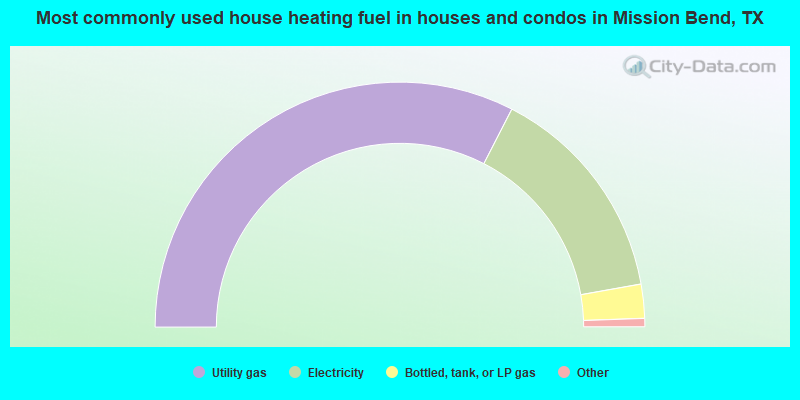
House heating fuel used in houses and condos - Utility gas (%)
House heating fuel used in houses and condos - Bottled, tank, or LP gas (%)
House heating fuel used in houses and condos - Electricity (%)
House heating fuel used in houses and condos - Fuel oil, kerosene, etc. (%)
House heating fuel used in houses and condos - Coal or coke (%)
House heating fuel used in houses and condos - Wood (%)
House heating fuel used in houses and condos - Solar energy (%)
House heating fuel used in houses and condos - Other fuel (%)
House heating fuel used in houses and condos - No fuel used (%)
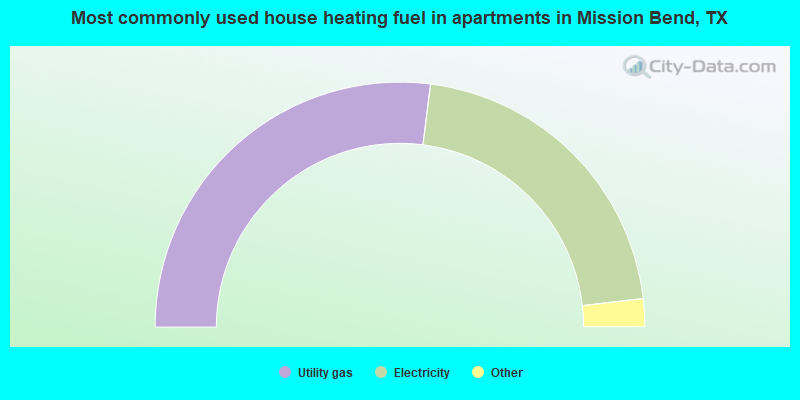
House heating fuel used in apartments - Utility gas (%)
House heating fuel used in apartments - Bottled, tank, or LP gas (%)
House heating fuel used in apartments - Electricity (%)
House heating fuel used in apartments - Fuel oil, kerosene, etc. (%)
House heating fuel used in apartments - Coal or coke (%)
House heating fuel used in apartments - Wood (%)
House heating fuel used in apartments - Solar energy (%)
House heating fuel used in apartments - Other fuel (%)
House heating fuel used in apartments - No fuel used (%)
Median year house/condo built: 1986Median year apartment built: 1990Household type by relationship:
Households: 40,423
Male householders: 5,978 (588 living alone ), Female householders: 5,892 (917 living alone )7,051 spouses (6,873 opposite-sex spouses ), 291 unmarried partners , (291 opposite-sex unmarried partners ), 15,109 children (13,350 natural , 469 adopted , 1,288 stepchildren ), 1,528 grandchildren , 823 brothers or sisters , 1,300 parents , 0 foster children , 1,935 other relatives , 444 non-relatives In group quarters: 68
Size of family households: 3,419 2-persons , 2,269 3-persons , 1,883 4-persons , 1,343 5-persons , 437 6-persons , 806 7-or-more-persons .
Size of nonfamily households: 1,632 1-person , 323 2-persons , 38 3-persons .
4,772 married couples with children. single-parent households (240 men , 2,061 women ).
43.8% of residents of Mission Bend speak English at home. of residents speak Spanish at home (56% speak English very well , 26% speak English well , 14% speak English not well , 4% don't speak English at all ).of residents speak other Indo-European language at home (68% speak English very well , 19% speak English well , 10% speak English not well , 3% don't speak English at all ).of residents speak Asian or Pacific Island language at home (43% speak English very well , 35% speak English well , 19% speak English not well , 3% don't speak English at all ).of residents speak other language at home (91% speak English very well , 9% speak English well ).
Foreign born population: 15,366 (38.0%)of them are naturalized citizens )
Median number of rooms in houses and condos:
Median number of rooms in apartments
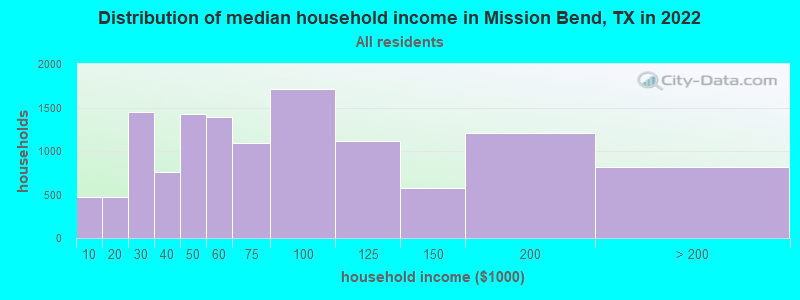
Mission Bend, TX household income distribution 466 Less than $10,000468 $10,000 to $19,9991,448 $20,000 to $29,999763 $30,000 to $39,9991,426 $40,000 to $49,9991,389 $50,000 to $59,9991,096 $60,000 to $74,9991,707 $75,000 to $99,9991,119 $100,000 to $124,999578 $125,000 to $149,9991,205 $150,000 to $199,999819 $200,000 or more
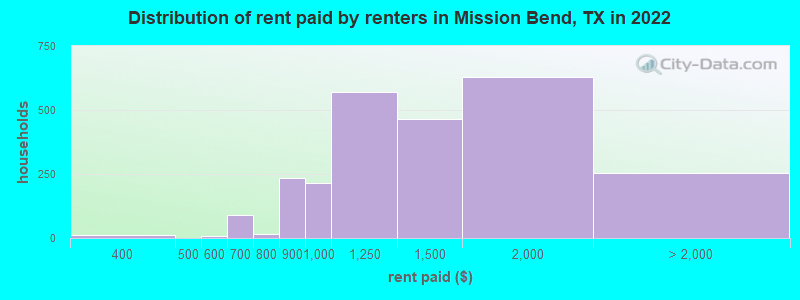
Home value of owner - occupied houses in 2022 in Mission Bend, TX 250 Less than $10,00012 $10,000 to $14,99913 $15,000 to $19,9998 $20,000 to $24,999106 $25,000 to $29,99923 $30,000 to $34,9998 $35,000 to $39,99983 $40,000 to $49,99914 $50,000 to $59,99953 $60,000 to $69,99940 $70,000 to $79,99950 $80,000 to $89,99916 $90,000 to $99,999554 $100,000 to $124,999483 $125,000 to $149,9991,383 $150,000 to $174,999974 $175,000 to $199,9992,330 $200,000 to $249,999937 $250,000 to $299,999500 $300,000 to $399,99956 $400,000 to $499,99959 $500,000 to $749,999230 $750,000 to $999,99911 $1,000,000 to $1,499,999Rent paid by renters in 2022 in Mission Bend, TX 12 $350 to $3996 $500 to $54991 $600 to $64916 $750 to $799234 $800 to $899213 $900 to $999570 $1,000 to $1,249466 $1,250 to $1,499627 $1,500 to $1,99930 $2,000 to $2,499224 No cash rent
Percentage of workers working in this county: 53.6%Number of people working at home: 1,807 (9.5% of all workers )
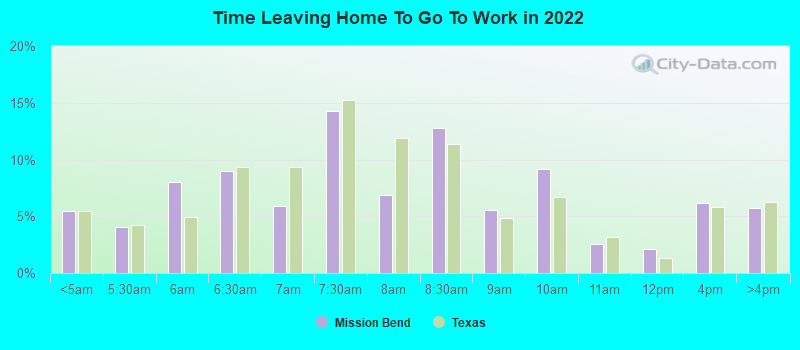
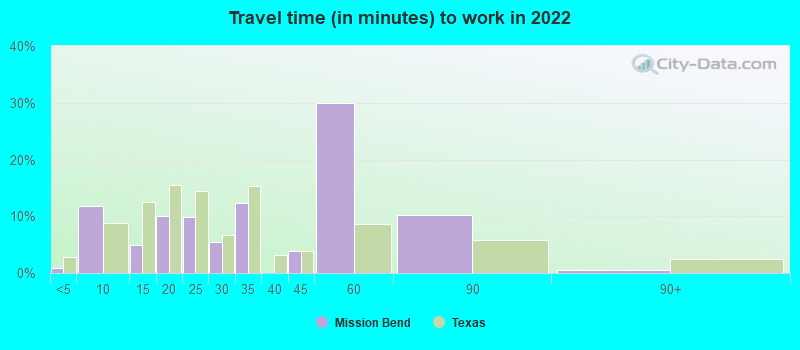
Travel time to work (commute)
Less than 5 minutes: 65 to 9 minutes: 31010 to 14 minutes: 1,52215 to 19 minutes: 2,39620 to 24 minutes: 2,24925 to 29 minutes: 1,50430 to 34 minutes: 3,12635 to 39 minutes: 1,30040 to 44 minutes: 99345 to 59 minutes: 2,20360 to 89 minutes: 1,19790 or more minutes: 262
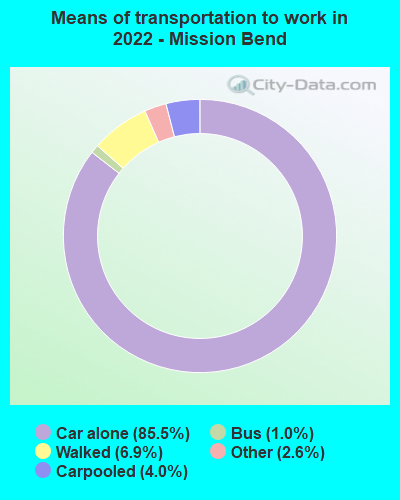
Means of transportation to work:
Drove a car alone: 1,708 (45.6%)Carpooled: 94 (2.5%)Bus : 12 (0.3%)Taxi: 63 (1.7%)Walked: 181 (4.8%)Worked at home: 1,807 (48.3%)
Unemployment by race in 2022
Unemployment rate for White non-Hispanic residents 5.4% Males5.5% FemalesUnemployment rate for Black residents 16.4% Males4.1% FemalesUnemployment rate for Asian residents 7.3% Males12.1% FemalesUnemployment rate for other race residents 4.2% Males6.1% FemalesUnemployment rate for two or more race residents 13.2% Males5.7% FemalesUnemployment rate for Hispanic or Latino residents 5.0% Males10.5% Females
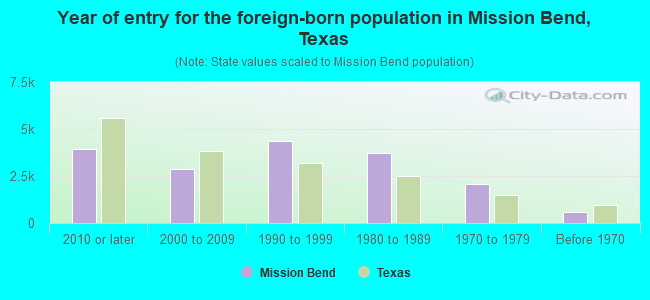
Year of entry for the foreign-born population in Mission Bend, Texas
3,922 2010 or later 2,863 2000 to 2009 4,378 1990 to 1999 3,715 1980 to 1989 2,057 1970 to 1979 569 Before 1970
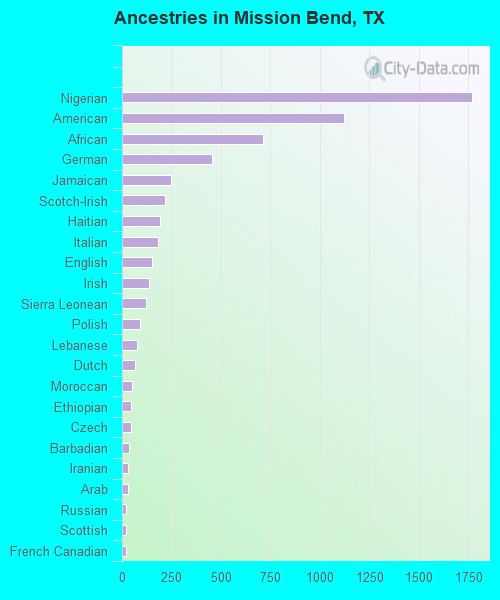
First ancestries reported:
Nigerian: 1,767 (6.9%)
American: 1,122 (4.4%)
African: 713 (2.8%)
German: 457 (1.8%)
Jamaican: 247 (1.0%)
Scotch-Irish: 215 (0.8%)
Haitian: 191 (0.7%)
Italian: 181 (0.7%)
English: 152 (0.6%)
Irish: 135 (0.5%)
Sierra Leonean: 119 (0.5%)
Polish: 91 (0.4%)
Lebanese: 76 (0.3%)
Dutch: 66 (0.3%)
Moroccan: 52 (0.2%)
Ethiopian: 45 (0.2%)
Czech: 44 (0.2%)
Barbadian: 33 (0.1%)
Iranian: 30 (0.1%)
Arab: 28 (0.1%)
Russian: 22 (0.09%)
Scottish: 22 (0.09%)
French Canadian: 18 (0.07%)
Liberian: 10 (0.04%)
Lithuanian: 7 (0.03%)
Trinidadian and Tobagonian: 6 (0.02%)
European: 5 (0.02%)
Guyanese: 5 (0.02%) Most common places of birth for foreign-born residents (%): Mexico Mission Bend:
17.5% (2,597)Texas:
48.4% (2,411,723)
Nigeria Mission Bend:
13.1% (1,946)Texas:
1.9% (96,110)
El Salvador Mission Bend:
10.2% (1,507)Texas:
4.5% (224,455)
Vietnam Mission Bend:
8.3% (1,231)Texas:
3.7% (184,770)
Pakistan Mission Bend:
6.7% (994)Texas:
1.2% (62,159)
Cuba Mission Bend:
6.1% (902)Texas:
1.3% (62,978)
Philippines Mission Bend:
3.6% (528)Texas:
2.1% (103,148)
China, excluding Hong Kong and Taiwan Mission Bend:
3.2% (467)Texas:
2.3% (115,558)
Honduras Mission Bend:
3.1% (453)Texas:
3.0% (147,182)
Venezuela Mission Bend:
3.0% (441)Texas:
1.5% (72,413)
India Mission Bend:
2.4% (361)Texas:
6.1% (306,347)
Guatemala Mission Bend:
2.2% (328)Texas:
1.8% (87,382)
Colombia Mission Bend:
1.8% (272)Texas:
1.2% (61,555)
Nicaragua Mission Bend:
1.7% (249)Texas:
0.4% (18,642)
Place of birth for U.S.-born residents:
This state: 18,781Other state: 5,190Northeast: 824Midwest: 1,026South: 2,369West: 934 95.3% of Mission Bend residents lived in the same house 1 years ago.
Out of people who lived in different houses, 35.9% lived in this county.
Out of people who lived in different counties, 75.5% lived in Texas.
Mission Bend:
95.3%State average:
85.7%
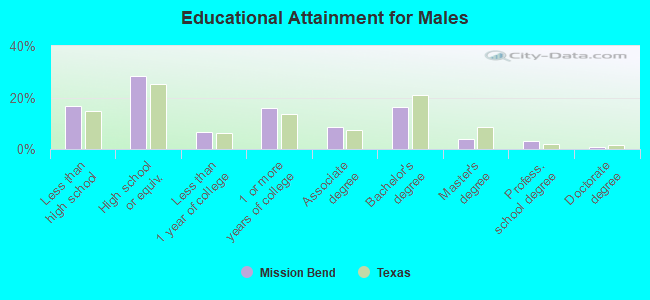
Education attainment for males 25 years and older:
No schooling: 573Nursery to 4th grade: 135th and 6th grade: 2147th and 8th grade: 1139th grade: 19610th grade: 4111th grade: 7712th grade, no diploma: 722High school graduate (or equivalency): 3,307Less than 1 year of college: 797Some college more than 1 year, no degree: 1,856Associate degree: 991Bachelor's degree: 1,928Master's degree: 473Professional school degree: 373Doctorate degree: 69
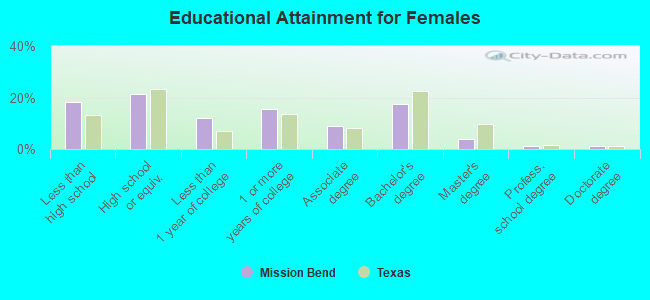
Education attainment for females 25 years and older:
No schooling: 735Nursery to 4th grade: 1375th and 6th grade: 1877th and 8th grade: 3779th grade: 13910th grade: 7811th grade: 10412th grade, no diploma: 766High school graduate (or equivalency): 2,926Less than 1 year of college: 1,650Some college more than 1 year, no degree: 2,120Associate degree: 1,249Bachelor's degree: 2,399Master's degree: 519Professional school degree: 141Doctorate degree: 181
Housing units in structures:
One, detached: 11,097One, attached: 410Two: 173 or 4: 1205 to 9: 25310 to 19: 19020 to 49: 7350 or more: 101Mobile homes: 158Median worth of mobile homes: $19,846
Housing units lacking complete plumbing facilities in 2022: 0.3%Housing units lacking complete kitchen facilities in 2022: 1.1%House/condo owner moved in on average 17 years ago
Renter moved in on average 8 years ago
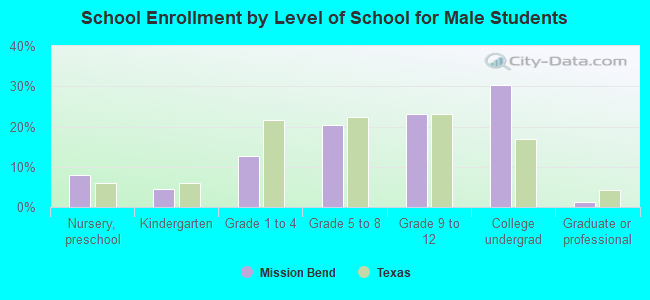
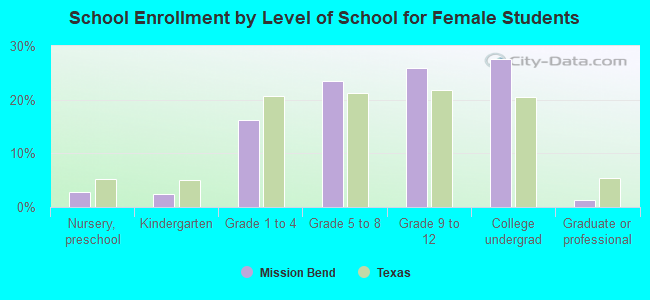
Private vs. public school enrollment:
Students in private schools in grades 1 to 8 (elementary and middle school): 528 Students in private schools in grades 9 to 12 (high school): 252 Students in private undergraduate colleges: 260