Mount Pisgah, SC (South Carolina) Houses and Residents
| Mount Pisgah: | $145,210 |
| South Carolina: | $254,600 |
Total population: 2,677 (Urban population: 0, Rural population: 2,413 (115 farm, 2,298 nonfarm))
Houses: 1,094 (976 occupied: 837 owner occupied, 139 renter occupied)
| % of renters here: | 14% |
| State: | 28% |
Housing density: 11 houses/condos per square mile
Median price asked for vacant for-sale houses and condos in 2022 in this county: $73,488.
Median contract rent in 2022: $658 (lower quartile is $554, upper quartile is $901)
Median rent asked for vacant for-rent units in 2022: $351
Median gross rent in Mount Pisgah, SC in 2022: $903
Housing units in Mount Pisgah with a mortgage: 154 (12 second mortgage, 5 home equity loan, 0 both second mortgage and home equity loan)
Houses without a mortgage: 196
Compare current foreclosures near Mount Pisgah, SC:
| Photo | Address | Area | Beds / Baths | Price | Details |
|---|---|---|---|---|---|

|
#1
Rogers Rd
Cassatt, SC 29032
|
1,463 sq. feet
|
2 baths 3 beds |
$200,000
|
show details |

|
#2
Saddlewood Rd
Cassatt, SC 29032
|
1,640 sq. feet
|
2 baths 3 beds |
show details | |

|
#3
W Stevens Dr
Kershaw, SC 29067
|
2,074 sq. feet
|
2 baths - beds |
show details | |

|
#4
Park Dr
Kershaw, SC 29067
|
1,591 sq. feet
|
2 baths - beds |
show details | |

|
#5
Old Jefferson Hwy
Kershaw, SC 29067
|
1,856 sq. feet
|
2 baths - beds |
show details | |

|
#6
Prestige Ln
Jefferson, SC 29718
|
1,120 sq. feet
|
2 baths - beds |
show details | |

|
#7
Center Grove Rd
Kershaw, SC 29067
|
3,132 sq. feet
|
3 baths - beds |
show details | |

|
#8
Vineyard Dr
Camden, SC 29020
|
2,179 sq. feet
|
- baths - beds |
show details | |

|
#9
Porter Rd
Cassatt, SC 29032
|
1,284 sq. feet
|
- baths - beds |
show details | |

|
#10
E Miller St
Jefferson, SC 29718
|
3,560 sq. feet
|
1 baths - beds |
show details |
| Photo | Address | Area | Beds / Baths | Price | Details |
|---|---|---|---|---|---|

|
#11
Field Trial Rd
Camden, SC 29020
|
1,746 sq. feet
|
- baths - beds |
show details | |

|
#12
Kershaw Hwy # A
Camden, SC 29020
|
2,970 sq. feet
|
- baths - beds |
show details | |

|
#13
Emsley Sullivan Rd
Jefferson, SC 29718
|
- sq. feet
|
- baths - beds |
show details | |

|
#14
White Plains Church Rd
Jefferson, SC 29718
|
- sq. feet
|
- baths - beds |
show details | |

|
#15
Winchester Rd
Cassatt, SC 29032
|
720 sq. feet
|
- baths - beds |
show details | |

|
#16
Prestige Ln
Jefferson, SC 29718
|
- sq. feet
|
- baths - beds |
show details | |

|
#17
Will Evans Rd
Jefferson, SC 29718
|
- sq. feet
|
- baths - beds |
show details | |

|
#18
Hwy 1
Mc Bee, SC 29101
|
- sq. feet
|
- baths - beds |
show details | |

|
#19
W Old Camden Rd
Mc Bee, SC 29101
|
- sq. feet
|
- baths - beds |
show details | |

|
#20
Firewood Rd
Lancaster, SC 29720
|
- sq. feet
|
- baths - beds |
show details |
| Photo | Address | Area | Beds / Baths | Price | Details |
|---|---|---|---|---|---|

|
#21
Union Church Rd
Lancaster, SC 29720
|
- sq. feet
|
2 baths - beds |
show details | |

|
#22
Tower Ln
Pageland, SC 29728
|
- sq. feet
|
- baths - beds |
show details | |

|
#23
S 9th St
Mc Bee, SC 29101
|
- sq. feet
|
- baths - beds |
show details | |

|
#24
Roberts Rd
Kershaw, SC 29067
|
- sq. feet
|
- baths - beds |
show details | |

|
#25
Earl Cauthen Rd
Heath Springs, SC 29058
|
- sq. feet
|
2 baths - beds |
show details | |

|
#26
Buffalo Creek Rd
Kershaw, SC 29067
|
- sq. feet
|
- baths - beds |
show details | |

|
#27
Confederate Rd
Kershaw, SC 29067
|
- sq. feet
|
- baths - beds |
show details | |

|
#28
E Hilton St
Kershaw, SC 29067
|
- sq. feet
|
- baths - beds |
show details | |

|
#29
Etters Ln
Cassatt, SC 29032
|
- sq. feet
|
- baths - beds |
show details | |

|
#30
Watermark Rd
Kershaw, SC 29067
|
- sq. feet
|
- baths - beds |
show details |
| Photo | Address | Area | Beds / Baths | Price | Details |
|---|---|---|---|---|---|

|
#31
Laurent Ave
Westville, SC 29175
|
- sq. feet
|
- baths - beds |
show details | |

|
#32
Church Rd
Westville, SC 29175
|
1,988 sq. feet
|
- baths - beds |
show details | |

|
#33
Payne Pond Rd
Westville, SC 29175
|
- sq. feet
|
- baths - beds |
show details | |

|
#34
Neal Switch Rd
Camden, SC 29020
|
- sq. feet
|
- baths - beds |
show details | |

|
#35
White Plains Church Rd
Pageland, SC 29728
|
- sq. feet
|
- baths - beds |
show details | |

|
#36
Willie Pickett Rd
Mount Croghan, SC 29727
|
- sq. feet
|
- baths - beds |
show details | |

|
#37
Porter Rd
Cassatt, SC 29032
|
- sq. feet
|
- baths - beds |
show details | |

|
#38
Cheraw Rd
Cassatt, SC 29032
|
- sq. feet
|
- baths - beds |
show details | |

|
#39
Marshall Rd
Cassatt, SC 29032
|
- sq. feet
|
- baths - beds |
show details | |

|
#40
Field Trial Rd
Camden, SC 29020
|
- sq. feet
|
- baths - beds |
show details |
| Photo | Address | Area | Beds / Baths | Price | Details |
|---|---|---|---|---|---|

|
#41
John Miller Rd
Jefferson, SC 29718
|
- sq. feet
|
- baths - beds |
show details | |

|
#42
Morningwood Ln
Mount Croghan, SC 29727
|
- sq. feet
|
- baths - beds |
show details | |

|
#43
James West Ln
Cassatt, SC 29032
|
- sq. feet
|
- baths - beds |
show details | |

|
#44
Morning View Ln
Cassatt, SC 29032
|
- sq. feet
|
- baths - beds |
show details | |

|
#45
Romain Dr
Cassatt, SC 29032
|
- sq. feet
|
- baths - beds |
show details | |

|
#46
Bethune Rd
Bethune, SC 29009
|
- sq. feet
|
- baths - beds |
show details | |

|
#47
Holland Rd
Cassatt, SC 29032
|
- sq. feet
|
- baths - beds |
show details | |

|
#48
Teal Rd
Cassatt, SC 29032
|
- sq. feet
|
- baths - beds |
show details | |

|
#49
Peach Orchard Rd
Jefferson, SC 29718
|
- sq. feet
|
- baths - beds |
show details | |

|
Check over 1 million property listings on Foreclosure.com!
|
browse all offers | |||

Household type by relationship:
Households: 61,171- In family households: 53,142 (11,331 male householders, 5,783 female householders)
12,348 spouses, 17,617 children (16,122 natural, 520 adopted, 975 stepchildren), 2,251 grandchildren, 605 brothers or sisters, 510 parents, foster children, 906 other relatives, 1,435 non-relatives
- In nonfamily households: 8,029 (3,163 male householders (2,604 living alone)), 3,651 female householders (3,253 living alone)), 1,215 nonrelatives
- In group quarters: 526 (278 institutionalized population)
8,685 married couples with children.
3,238 single-parent households (703 men, 2,535 women).
98.3% of residents of Mount Pisgah speak English at home.
1.2% of residents speak Spanish at home (52% speak English very well, 48% speak English not well).
0.6% of residents speak other Indo-European language at home (100% speak English very well).
Foreign born population: 49 (1.6%)
(0.0% of them are naturalized citizens)
| Here: | 6.4 |
| State: | 6.4 |
| Here: | 5.0 |
| State: | 4.5 |

- Bedrooms in owner-occupied houses and condos in Mount Pisgah, South Carolina
- 0no bedroom
- 201 bedroom
- 2252 bedrooms
- 5363 bedrooms
- 464 bedrooms
- 105+ bedrooms

- Bedrooms in renter-occupied apartments in Mount Pisgah, South Carolina
- 0no bedroom
- 71 bedroom
- 682 bedrooms
- 513 bedrooms
- 134 bedrooms
- 05+ bedrooms

- Cars and other vehicles available in Mount Pisgah in owner-occupied houses/condos
- 26no vehicle
- 2271 vehicle
- 3432 vehicles
- 1803 vehicles
- 564 vehicles
- 55+ vehicles

- Cars and other vehicles available in Mount Pisgah in renter-occupied apartments
- 5no vehicle
- 761 vehicle
- 512 vehicles
- 73 vehicles
- 04 vehicles
- 05+ vehicles

- Rooms in owner-occupied houses in Mount Pisgah, South Carolina
- 01 room
- 62 rooms
- 523 rooms
- 1014 rooms
- 2735 rooms
- 2116 rooms
- 1087 rooms
- 538 rooms
- 339+ rooms

- Rooms in renter-occupied apartments in Mount Pisgah, South Carolina
- 01 room
- 02 rooms
- 213 rooms
- 414 rooms
- 475 rooms
- 176 rooms
- 77 rooms
- 68 rooms
- 09+ rooms


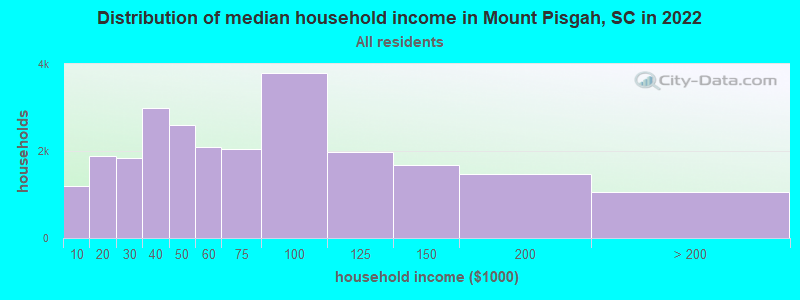
Mount Pisgah, SC household income distribution

- 1,190Less than $10,000
- 1,882$10,000 to $19,999
- 1,849$20,000 to $29,999
- 2,980$30,000 to $39,999
- 2,591$40,000 to $49,999
- 2,090$50,000 to $59,999
- 2,042$60,000 to $74,999
- 3,790$75,000 to $99,999
- 1,979$100,000 to $124,999
- 1,671$125,000 to $149,999
- 1,466$150,000 to $199,999
- 1,050$200,000 or more
Percentage of workers working in this county: 40.9%
Number of people working at home: 90 (7.4% of all workers)
Travel time to work (commute)
- Less than 5 minutes: 30
- 5 to 9 minutes: 69
- 10 to 14 minutes: 92
- 15 to 19 minutes: 106
- 20 to 24 minutes: 68
- 25 to 29 minutes: 44
- 30 to 34 minutes: 260
- 35 to 39 minutes: 89
- 40 to 44 minutes: 93
- 45 to 59 minutes: 170
- 60 to 89 minutes: 131
- 90 or more minutes: 37
Means of transportation to work:
- Drove a car alone: 957 (79.9%)
- Carpooled: 187 (15.6%)
- Walked: 30 (2.5%)
- Other means: 15 (1.3%)
- Worked at home: 8 (0.7%)


- Year of entry for the foreign-born population in Mount Pisgah, South Carolina
- 91995 to March 2000
- 131990 to 1994
- 01985 to 1989
- 01980 to 1984
- 01975 to 1979
- 81970 to 1974
- 01965 to 1969
- 0Before 1965
Most common places of birth for foreign-born residents (%):
| Mount Pisgah: | 43.3% (13) |
| South Carolina: | 2.7% (3,098) |
| Mount Pisgah: | 30.0% (9) |
| South Carolina: | 1.4% (1,599) |
| Mount Pisgah: | 26.7% (8) |
| South Carolina: | 0.3% (336) |
Place of birth for U.S.-born residents:
- This state: 1,991
- Other state: 358
- Northeast: 40
- Midwest: 85
- South: 217
- West: 16
64% of Mount Pisgah residents lived in the same house 5 years ago.
Out of people who lived in different houses, 16% lived in this county.
Out of people who lived in different counties, 85% lived in South Carolina.
Education attainment for males 25 years and older:
- No schooling: 11
- Nursery to 4th grade: 12
- 5th and 6th grade: 27
- 7th and 8th grade: 53
- 9th grade: 38
- 10th grade: 48
- 11th grade: 40
- 12th grade, no diploma: 67
- High school graduate (or equivalency): 320
- Less than 1 year of college: 53
- Some college more than 1 year, no degree: 45
- Associate degree: 58
- Bachelor's degree: 8
- Master's degree: 14
- Professional school degree: 8
- Doctorate degree: 0

Education attainment for females 25 years and older:
- No schooling: 0
- Nursery to 4th grade: 6
- 5th and 6th grade: 40
- 7th and 8th grade: 47
- 9th grade: 52
- 10th grade: 45
- 11th grade: 26
- 12th grade, no diploma: 47
- High school graduate (or equivalency): 298
- Less than 1 year of college: 57
- Some college more than 1 year, no degree: 82
- Associate degree: 48
- Bachelor's degree: 42
- Master's degree: 14
- Professional school degree: 0
- Doctorate degree: 0


Housing units in structures:
- One, detached: 612
- Mobile homes: 482
Median worth of mobile homes: $50,080
Housing units lacking complete kitchen facilities: 3.5%

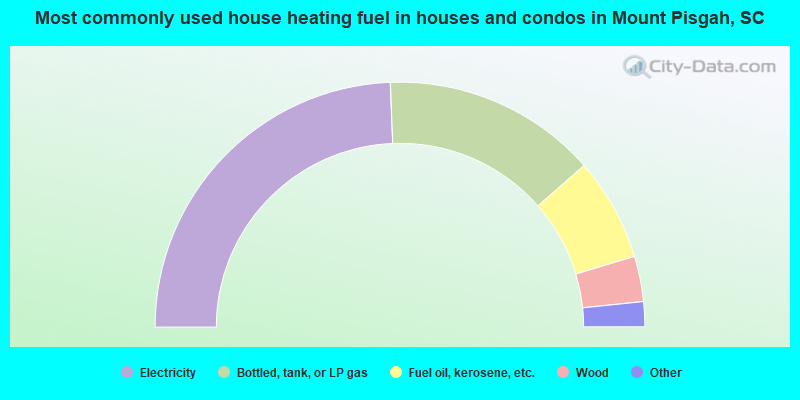
- 48.7%Electricity
- 28.3%Bottled, tank, or LP gas
- 13.6%Fuel oil, kerosene, etc.
- 6.0%Wood
- 1.8%Utility gas
- 1.6%No fuel used
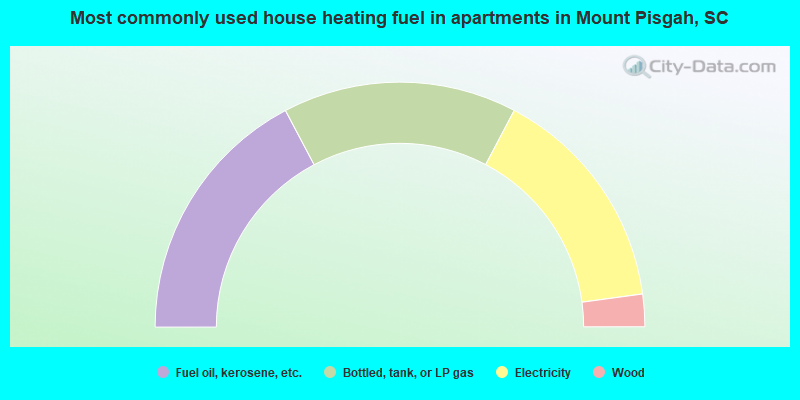
- 34.5%Fuel oil, kerosene, etc.
- 30.9%Bottled, tank, or LP gas
- 30.2%Electricity
- 4.3%Wood
Private vs. public school enrollment:
| Here: | 10.2% |
| South Carolina: | 9.2% |
| Here: | 0.0% |
| South Carolina: | 8.1% |
| Here: | 26.7% |
| South Carolina: | 20.3% |


