Mount Vernon, WA (Washington) Houses and Residents
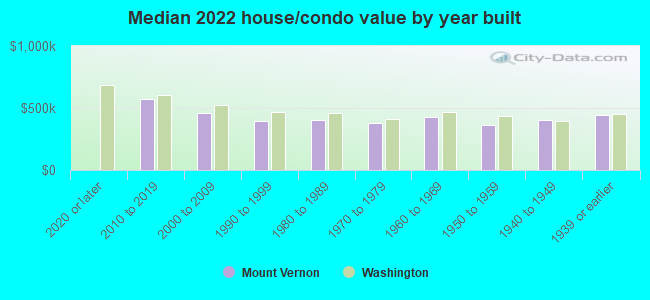
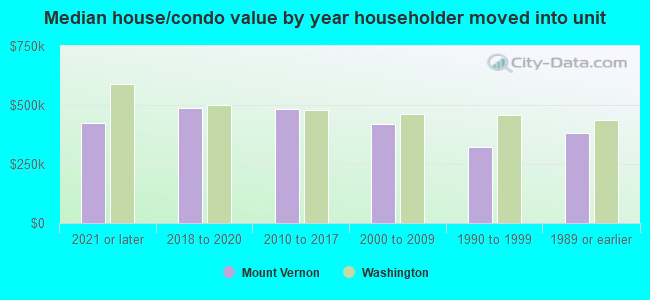
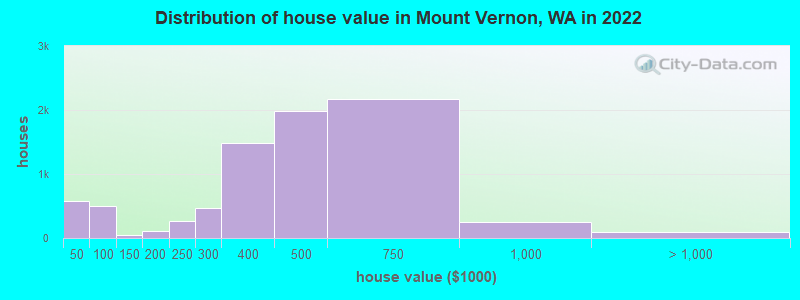
Estimated median house or condo value in 2022: $451,611 (it was $136,100 in 2000 )
Mount Vernon:
$451,611Washington:
$569,500
Lower value quartile - upper value quartile: $343,111 - $543,600Total population: 33,132 (Urban population: 26,012, Rural population: 285 (all nonfarm) )
Houses: 13,530 (13,233 occupied: 8,244 owner occupied, 4,696 renter occupied )
% of renters here:
36%State:
36%
Housing density: 1,218 houses/condos per square mile
Median price asked for vacant for-sale houses and condos in 2022: $1,127,485.
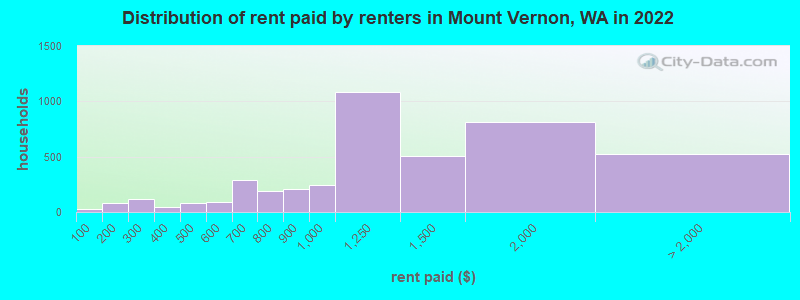
Median contract rent in 2022: $1,179 (lower quartile is $932, upper quartile is $1,549)
Median rent asked for vacant for-rent units in 2022: $57,545
Median gross rent in Mount Vernon, WA in 2022: $1,300
Housing units in Mount Vernon with a mortgage: 5,426 (633 second mortgage, 13 home equity loan, 449 both second mortgage and home equity loan )Houses without a mortgage: 29
Median household income for houses/condos with a mortgage: $109,122
Median household income for apartments without a mortgage: $70,906
Median monthly housing costs: $1,398
Data:
Median house or condo value ($)
Median house or condo value ($ change since 2000)
Median house or condo value ($) - White
Median house or condo value ($) - Black or African American
Median house or condo value ($) - Asian
Median house or condo value ($) - Hispanic or Latino
Median house or condo value ($) - American Indian and Alaska Native
Median house or condo value ($) - Multirace
Median house or condo value ($) - Other Race
Median price asked for mobile homes ($)
Household density (households per square mile)
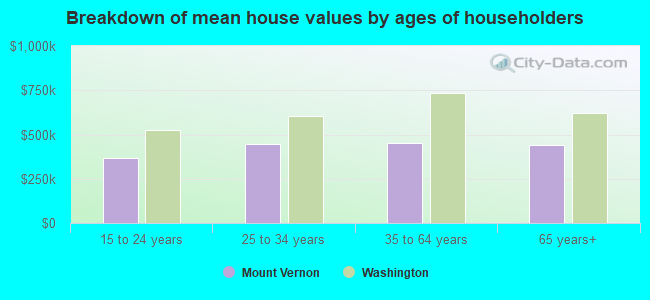
Mean house or condo value by units in structure - 1, detached ($)
Mean house or condo value by units in structure - 1, attached ($)
Mean house or condo value by units in structure - 2 ($)
Mean house or condo value by units in structure by units in structure - 3 or 4 ($)
Mean house or condo value by units in structure - 5 or more ($)
Mean house or condo value by units in structure - Boat, RV, van, etc. ($)
Mean house or condo value by units in structure - Mobile home ($)
Median contract rent ($)
Median contract rent - Lower quartile ($)
Median contract rent - Upper quartile ($)
Median gross rent ($)
Urban houses (%)
Rural houses (%)
Houses occupied (%)
Houses occupied (% change since 2000)
Houses owner occupied (%)
Houses owner occupied (% change since 2000)
Houses renter occupied (%)
Houses renter occupied (% change since 2000)
Vacant housing units - For rent (%)
Vacant housing units - For rent (% change since 2000)
Vacant housing units - For sale only (%)
Vacant housing units - For sale only (% change since 2000)
Vacant housing units - Rented or sold, not occupied (%)
Vacant housing units - Rented or sold, not occupied (% change since 2000)
Vacant housing units - For seasonal, recreational, or occasional use (%)
Vacant housing units - For seasonal, recreational, or occasional use (% change since 2000)
Vacant housing units - For migrant workers (%)
Vacant housing units - For migrant workers (% change since 2000)
Vacant housing units - Other vacant (%)
Vacant housing units - Other vacant (% change since 2000)
Median monthly housing costs ($)
Median household income for houses/condos with a mortgage ($)
Median household income for houses/condos without a mortgage ($)
Median household income ($)
Median household income ($) - White
Median household income ($) - Black or African American
Median household income ($) - Asian
Median household income ($) - Hispanic or Latino
Median household income ($) - American Indian and Alaska Native
Median household income ($) - Multirace
Median household income ($) - Other Race
Mortgage status - with mortgage (%)
Mortgage status - with second mortgage (%)
Mortgage status - with home equity loan (%)
Mortgage status - with both second mortgage and home equity loan (%)
Mortgage status - without a mortgage (%)
Median year house/condo built
Median year apartment built
Household type by relationship - Male householder living alone (%)
Household type by relationship - Male householder not living alone (%)
Household type by relationship - Female householder living alone (%)
Household type by relationship - Female householder not living alone (%)
Household type by relationship - Opposite-Sex spouse (%)
Household type by relationship - Same-Sex spouse (%)
Household type by relationship - Opposite-Sex unmarried partner (%)
Household type by relationship - Same-Sex unmarried partner (%)
Household type by relationship - In group quarters (%)
Size of family households - 2-person household (%)
Size of family households - 3-person household (%)
Size of family households - 4-person household (%)
Size of family households - 5-person household (%)
Size of family households - 6-person household (%)
Size of family households - 7-or-more-person household (%)
Size of nonfamily households - 1-person household (%)
Size of nonfamily households - 2-person household (%)
Size of nonfamily households - 3-person household (%)
Size of nonfamily households - 4-person household (%)
Size of nonfamily households - 5-person household (%)
Size of nonfamily households - 6-person household (%)
Size of nonfamily households - 7-or-moreperson household (%)
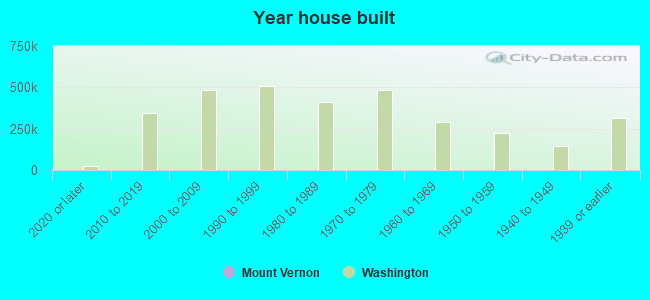
Year house built - Built 2010 or later (%)
Year house built - Built 2000 to 2009 (%)
Year house built - Built 1990 to 1999 (%)
Year house built - Built 1980 to 1989 (%)
Year house built - Built 1970 to 1979 (%)
Year house built - Built 1960 to 1969 (%)
Year house built - Built 1950 to 1959 (%)
Year house built - Built 1940 to 1949 (%)
Year house built - Built 1939 or earlier (%)
Median number of rooms in houses and condos
Median number of rooms in apartments
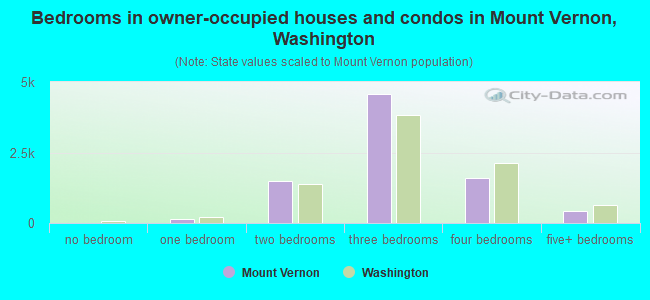
Median number of bedrooms in owner occupied houses
Mean number of bedrooms in owner occupied houses
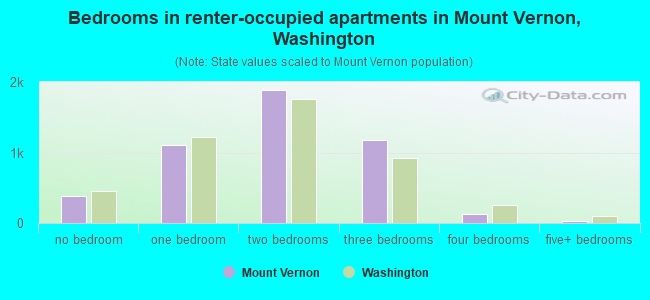
Median number of bedrooms in renter occupied houses
Mean number of bedrooms in renter occupied houses
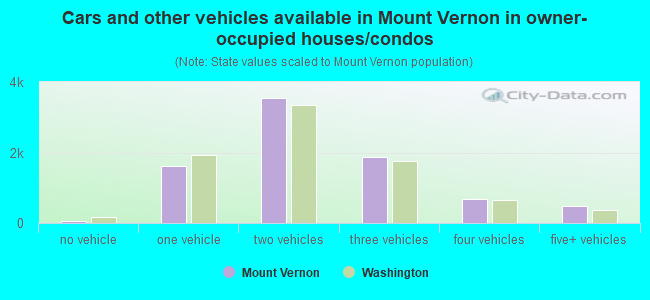
Median number of vehichles in owner occupied houses
Mean number of vehichles in owner occupied houses
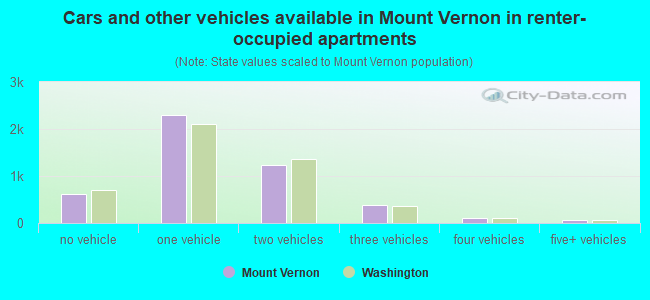
Median number of vehichles in renter occupied houses
Mean number of vehichles in renter occupied houses
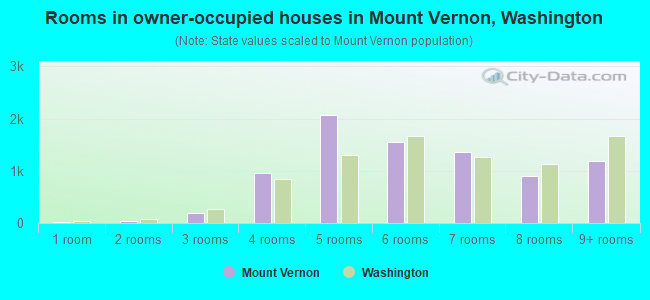
Rooms in owner-occupied houses - 1 room (%)
Rooms in owner-occupied houses - 2 rooms (%)
Rooms in owner-occupied houses - 3 rooms (%)
Rooms in owner-occupied houses - 4 rooms (%)
Rooms in owner-occupied houses - 5 rooms (%)
Rooms in owner-occupied houses - 6 rooms (%)
Rooms in owner-occupied houses - 7 rooms (%)
Rooms in owner-occupied houses - 8 rooms (%)
Rooms in owner-occupied houses - 9+ rooms (%)
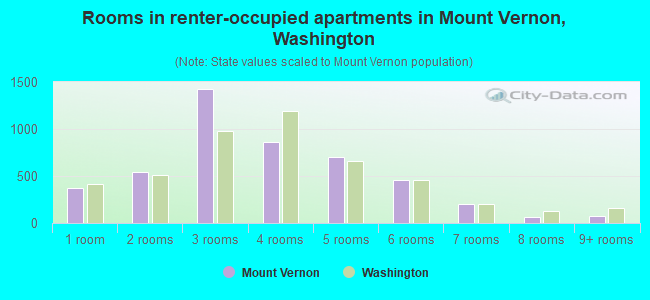
Rooms in renter-occupied houses - 1 room (%)
Rooms in renter-occupied houses - 2 rooms (%)
Rooms in renter-occupied houses - 3 rooms (%)
Rooms in renter-occupied houses - 4 rooms (%)
Rooms in renter-occupied houses - 5 rooms (%)
Rooms in renter-occupied houses - 6 rooms (%)
Rooms in renter-occupied houses - 7 rooms (%)
Rooms in renter-occupied houses - 8 rooms (%)
Rooms in renter-occupied houses - 9+ rooms (%)
Bedrooms in owner-occupied houses - no bedrooms (%)
Bedrooms in owner-occupied houses - 1 bedroom (%)
Bedrooms in owner-occupied houses - 2 bedrooms (%)
Bedrooms in owner-occupied houses - 3 bedrooms (%)
Bedrooms in owner-occupied houses - 4 bedrooms (%)
Bedrooms in owner-occupied houses - 5+ bedrooms (%)
Bedrooms in renter-occupied houses - no bedrooms (%)
Bedrooms in renter-occupied houses - 1 bedroom (%)
Bedrooms in renter-occupied houses - 2 bedrooms (%)
Bedrooms in renter-occupied houses - 3 bedrooms (%)
Bedrooms in renter-occupied houses - 4 bedrooms (%)
Bedrooms in renter-occupied houses - 5+ bedrooms (%)
Vehicles available in owner-occupied houses - no vehicle available (%)
Vehicles available in owner-occupied houses - 1 vehicle available(%)
Vehicles available in owner-occupied houses - 2 Vehicles available (%)
Vehicles available in owner-occupied houses - 3 Vehicles available (%)
Vehicles available in owner-occupied houses - 4 Vehicles available (%)
Vehicles available in owner-occupied houses - 5+ Vehicles available (%)
Vehicles available in renter-occupied houses - no vehicle available (%)
Vehicles available in renter-occupied houses - 1 vehicle available (%)
Vehicles available in renter-occupied houses - 2 Vehicles available (%)
Vehicles available in renter-occupied houses - 3 Vehicles available (%)
Vehicles available in renter-occupied houses - 4 Vehicles available (%)
Vehicles available in renter-occupied houses - 5+ Vehicles available (%)
Housing units in structures - 1, detached (%)
Housing units in structures - 1, attached (%)
Housing units in structures - 2 (%)
Housing units in structures - 3 or 4 (%)
Housing units in structures - 5 to 9 (%)
Housing units in structures - 10 to 19 (%)
Housing units in structures - 20 to 49 (%)
Housing units in structures - 50 or more (%)
Housing units in structures - Mobile home (%)
Housing units in structures - Boat, RV, van, etc. (%)
Housing units in structures - Owners - 1, detached (%)
Housing units in structures - Owners - 1, attached (%)
Housing units in structures - Owners - 2 (%)
Housing units in structures - Owners - 3 or 4 (%)
Housing units in structures - Owners - 5 to 9 (%)
Housing units in structures - Owners - 10 to 19 (%)
Housing units in structures - Owners - 20 to 49 (%)
Housing units in structures - Owners - 50 or more (%)
Housing units in structures - Owners - Mobile home (%)
Housing units in structures - Owners - Boat, RV, van, etc. (%)
Housing units in structures - Renters - 1, detached (%)
Housing units in structures - Renters - 1, attached (%)
Housing units in structures - Renters - 2 (%)
Housing units in structures - Renters - 3 or 4 (%)
Housing units in structures - Renters - 5 to 9 (%)
Housing units in structures - Renters - 10 to 19 (%)
Housing units in structures - Renters - 20 to 49 (%)
Housing units in structures - Renters - 50 or more (%)
Housing units in structures - Renters - Mobile home (%)
Housing units in structures - Renters - Boat, RV, van, etc. (%)
House/condo owner moved in on average (years ago)
Renter moved in on average (years ago)
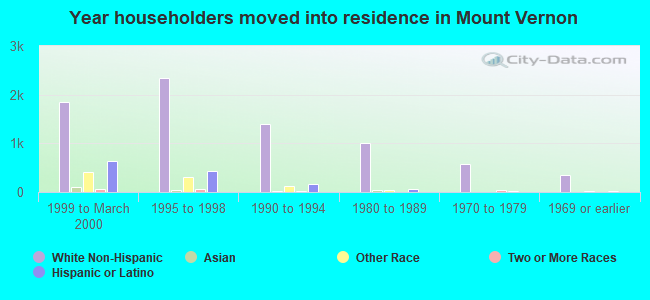
Year householder moved into unit - Moved in 1999 to March 2000 (%)
Year householder moved into unit - Moved in 1999 to March 2000 (%) - White
Year householder moved into unit - Moved in 1999 to March 2000 (%) - Black or African American
Year householder moved into unit - Moved in 1999 to March 2000 (%) - Asian
Year householder moved into unit - Moved in 1999 to March 2000 (%) - Hispanic or Latino
Year householder moved into unit - Moved in 1999 to March 2000 (%) - American Indian and Alaska Native
Year householder moved into unit - Moved in 1999 to March 2000 (%) - Multirace
Year householder moved into unit - Moved in 1999 to March 2000 (%) - Other Race
Year householder moved into unit - Moved in 1995 to 1998 (%)
Year householder moved into unit - Moved in 1995 to 1998 (%) - White
Year householder moved into unit - Moved in 1995 to 1998 (%) - Black or African American
Year householder moved into unit - Moved in 1995 to 1998 (%) - Asian
Year householder moved into unit - Moved in 1995 to 1998 (%) - Hispanic or Latino
Year householder moved into unit - Moved in 1995 to 1998 (%) - American Indian and Alaska Native
Year householder moved into unit - Moved in 1995 to 1998 (%) - Multirace
Year householder moved into unit - Moved in 1995 to 1998 (%) - Other Race
Year householder moved into unit - Moved in 1990 to 1994 (%)
Year householder moved into unit - Moved in 1990 to 1994 (%) - White
Year householder moved into unit - Moved in 1990 to 1994 (%) - Black or African American
Year householder moved into unit - Moved in 1990 to 1994 (%) - Asian
Year householder moved into unit - Moved in 1990 to 1994 (%) - Hispanic or Latino
Year householder moved into unit - Moved in 1990 to 1994 (%) - American Indian and Alaska Native
Year householder moved into unit - Moved in 1990 to 1994 (%) - Multirace
Year householder moved into unit - Moved in 1990 to 1994 (%) - Other Race
Year householder moved into unit - Moved in 1980 to 1989 (%)
Year householder moved into unit - Moved in 1980 to 1989 (%) - White
Year householder moved into unit - Moved in 1980 to 1989 (%) - Black or African American
Year householder moved into unit - Moved in 1980 to 1989 (%) - Asian
Year householder moved into unit - Moved in 1980 to 1989 (%) - Hispanic or Latino
Year householder moved into unit - Moved in 1980 to 1989 (%) - American Indian and Alaska Native
Year householder moved into unit - Moved in 1980 to 1989 (%) - Multirace
Year householder moved into unit - Moved in 1980 to 1989 (%) - Other Race
Year householder moved into unit - Moved in 1970 to 1979 (%)
Year householder moved into unit - Moved in 1970 to 1979 (%) - White
Year householder moved into unit - Moved in 1970 to 1979 (%) - Black or African American
Year householder moved into unit - Moved in 1970 to 1979 (%) - Asian
Year householder moved into unit - Moved in 1970 to 1979 (%) - Hispanic or Latino
Year householder moved into unit - Moved in 1970 to 1979 (%) - American Indian and Alaska Native
Year householder moved into unit - Moved in 1970 to 1979 (%) - Multirace
Year householder moved into unit - Moved in 1970 to 1979 (%) - Other Race
Year householder moved into unit - Moved in 1969 or earlier (%)
Year householder moved into unit - Moved in 1969 or earlier (%) - White
Year householder moved into unit - Moved in 1969 or earlier (%) - Black or African American
Year householder moved into unit - Moved in 1969 or earlier (%) - Asian
Year householder moved into unit - Moved in 1969 or earlier (%) - Hispanic or Latino
Year householder moved into unit - Moved in 1969 or earlier (%) - American Indian and Alaska Native
Year householder moved into unit - Moved in 1969 or earlier (%) - Multirace
Year householder moved into unit - Moved in 1969 or earlier (%) - Other Race
Housing units lacking complete plumbing facilities (%)
Housing units lacking complete kitchen facilities (%)
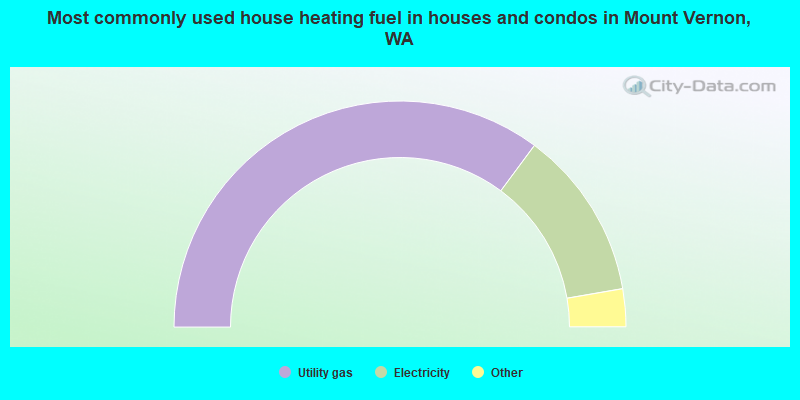
House heating fuel used in houses and condos - Utility gas (%)
House heating fuel used in houses and condos - Bottled, tank, or LP gas (%)
House heating fuel used in houses and condos - Electricity (%)
House heating fuel used in houses and condos - Fuel oil, kerosene, etc. (%)
House heating fuel used in houses and condos - Coal or coke (%)
House heating fuel used in houses and condos - Wood (%)
House heating fuel used in houses and condos - Solar energy (%)
House heating fuel used in houses and condos - Other fuel (%)
House heating fuel used in houses and condos - No fuel used (%)
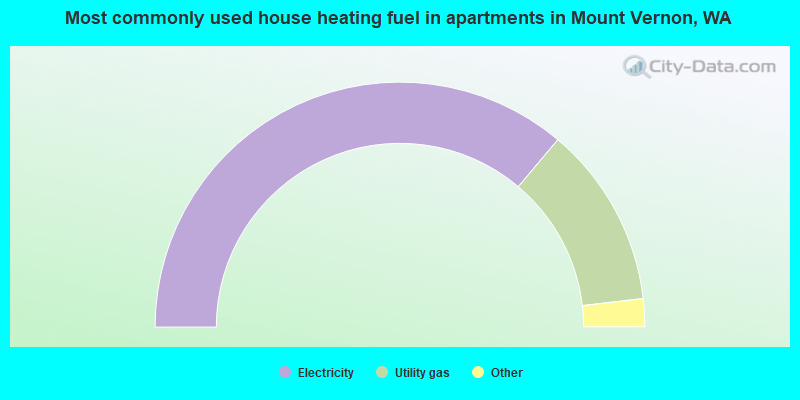
House heating fuel used in apartments - Utility gas (%)
House heating fuel used in apartments - Bottled, tank, or LP gas (%)
House heating fuel used in apartments - Electricity (%)
House heating fuel used in apartments - Fuel oil, kerosene, etc. (%)
House heating fuel used in apartments - Coal or coke (%)
House heating fuel used in apartments - Wood (%)
House heating fuel used in apartments - Solar energy (%)
House heating fuel used in apartments - Other fuel (%)
House heating fuel used in apartments - No fuel used (%)
Median year house/condo built: 1993Median year apartment built: 1984Household type by relationship:
Households: 35,580
Male householders: 6,208 (1,538 living alone ), Female householders: 6,903 (2,039 living alone )6,528 spouses (6,360 opposite-sex spouses ), 1,032 unmarried partners , (1,013 opposite-sex unmarried partners ), 9,756 children (9,184 natural , 291 adopted , 279 stepchildren ), 1,322 grandchildren , 328 brothers or sisters , 654 parents , 159 foster children , 491 other relatives , 1,427 non-relatives In group quarters: 768
Size of family households: 2,804 2-persons , 2,192 3-persons , 1,473 4-persons , 851 5-persons , 582 6-persons , 323 7-or-more-persons .
Size of nonfamily households: 3,775 1-person , 871 2-persons , 48 3-persons , 101 4-persons , 24 5-persons , 13 6-persons .
4,223 married couples with children. single-parent households (411 men , 1,907 women ).
68.7% of residents of Mount Vernon speak English at home. of residents speak Spanish at home (59% speak English very well , 16% speak English well , 16% speak English not well , 8% don't speak English at all ).of residents speak other Indo-European language at home (44% speak English very well , 22% speak English well , 24% speak English not well , 11% don't speak English at all ).of residents speak Asian or Pacific Island language at home (67% speak English very well , 25% speak English well , 5% speak English not well , 4% don't speak English at all ).of residents speak other language at home (43% speak English very well , 27% speak English not well , 30% don't speak English at all ).
Foreign born population: 5,812 (16.3%)of them are naturalized citizens )
Median number of rooms in houses and condos:
Median number of rooms in apartments
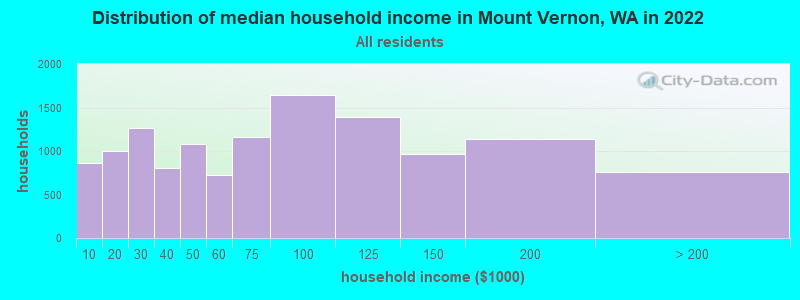
Mount Vernon, WA household income distribution 864 Less than $10,000999 $10,000 to $19,9991,263 $20,000 to $29,999807 $30,000 to $39,9991,081 $40,000 to $49,999719 $50,000 to $59,9991,166 $60,000 to $74,9991,649 $75,000 to $99,9991,390 $100,000 to $124,999966 $125,000 to $149,9991,137 $150,000 to $199,999763 $200,000 or more
Home value of owner - occupied houses in 2022 in Mount Vernon, WA 205 Less than $10,00037 $10,000 to $14,99911 $15,000 to $19,99998 $20,000 to $24,99946 $25,000 to $29,99938 $30,000 to $34,99912 $35,000 to $39,999123 $40,000 to $49,999243 $50,000 to $59,99922 $60,000 to $69,99938 $70,000 to $79,99943 $80,000 to $89,99924 $90,000 to $99,99922 $100,000 to $124,99919 $125,000 to $149,99943 $150,000 to $174,99964 $175,000 to $199,999260 $200,000 to $249,999467 $250,000 to $299,9991,492 $300,000 to $399,9991,987 $400,000 to $499,9992,172 $500,000 to $749,999246 $750,000 to $999,99968 $1,000,000 to $1,499,99920 $2,000,000 or moreRent paid by renters in 2022 in Mount Vernon, WA 27 Less than $10079 $150 to $199103 $200 to $24912 $250 to $29935 $300 to $3494 $350 to $39952 $400 to $44929 $450 to $49968 $500 to $54925 $550 to $599170 $600 to $649120 $650 to $699112 $700 to $74978 $750 to $799211 $800 to $899247 $900 to $9991,081 $1,000 to $1,249508 $1,250 to $1,499814 $1,500 to $1,999167 $2,000 to $2,49929 $2,500 to $2,99938 $3,000 to $3,499290 No cash rent
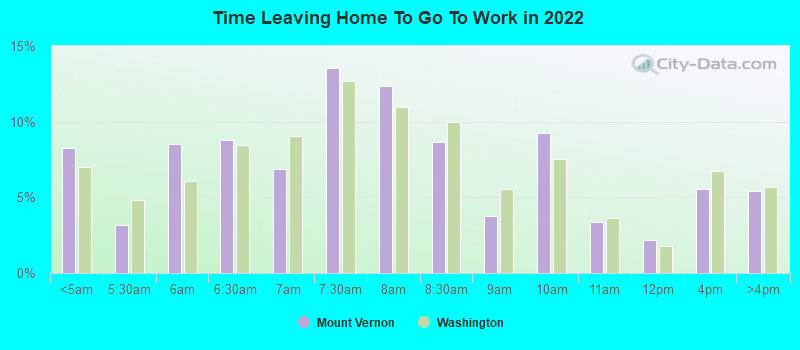
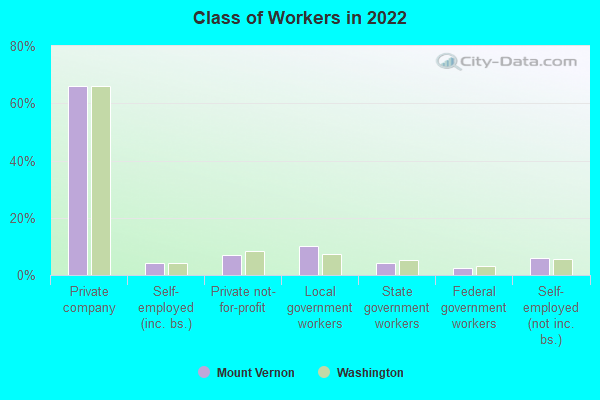
Percentage of workers working in this county: 76.5%Number of people working at home: 2,446 (15.5% of all workers )
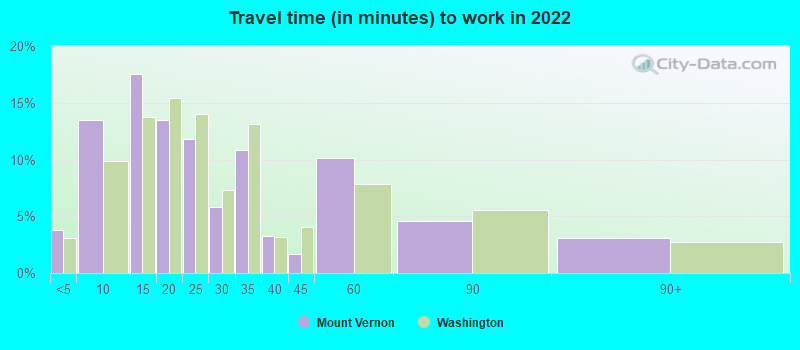
Travel time to work (commute)
Less than 5 minutes: 6885 to 9 minutes: 2,00010 to 14 minutes: 2,87415 to 19 minutes: 1,94420 to 24 minutes: 1,71125 to 29 minutes: 52430 to 34 minutes: 1,22835 to 39 minutes: 63640 to 44 minutes: 26745 to 59 minutes: 87460 to 89 minutes: 67290 or more minutes: 331
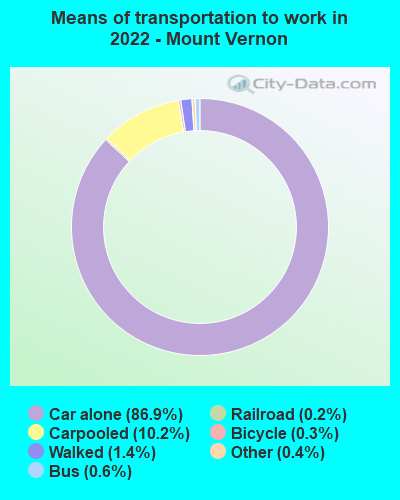
Means of transportation to work:
Drove a car alone: 12,903 (74.0%)Carpooled: 1,562 (9.0%)Bus : 58 (0.3%)Light rail, streetcar or trolley : 34 (0.2%)Ferryboat: 3 (0.0%)Taxi: 58 (0.3%)Bicycle: 41 (0.2%)Walked: 205 (1.2%)Worked at home: 2,446 (14.0%)
Unemployment by race in 2022
Unemployment rate for White non-Hispanic residents 7.1% Males2.3% FemalesUnemployment rate for Black residents 1.2% MalesUnemployment rate for American Indian and Alaska Native residents 0.5% Males26.2% FemalesUnemployment rate for Asian residents 2.2% MalesUnemployment rate for other race residents 20.4% Males9.0% FemalesUnemployment rate for two or more race residents 4.1% Males7.5% FemalesUnemployment rate for Hispanic or Latino residents 14.2% Males9.0% Females
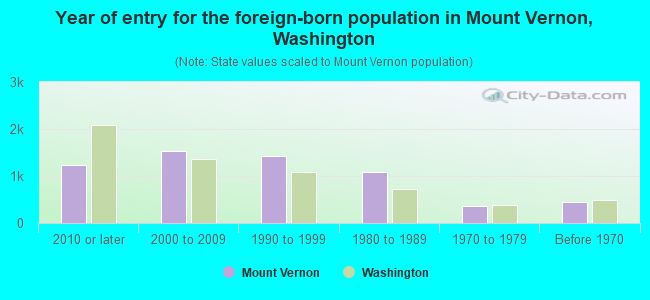
Year of entry for the foreign-born population in Mount Vernon, Washington
1,236 2010 or later 1,522 2000 to 2009 1,433 1990 to 1999 1,077 1980 to 1989 366 1970 to 1979 456 Before 1970
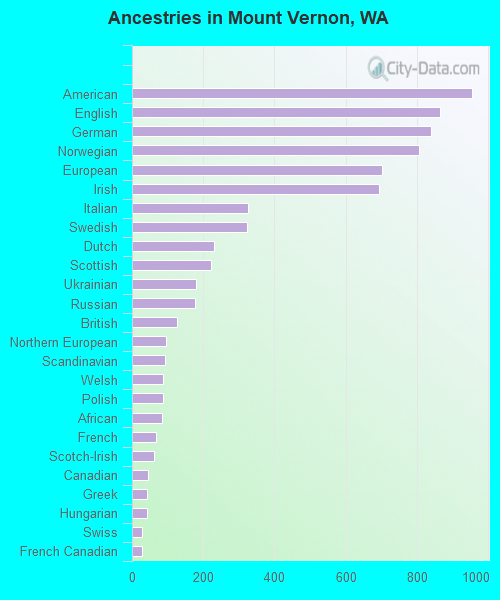
First ancestries reported:
American: 955 (5.3%)
English: 864 (4.8%)
German: 840 (4.7%)
Norwegian: 806 (4.5%)
European: 702 (3.9%)
Irish: 694 (3.9%)
Italian: 326 (1.8%)
Swedish: 324 (1.8%)
Dutch: 229 (1.3%)
Scottish: 221 (1.2%)
Ukrainian: 179 (1.0%)
Russian: 176 (1.0%)
British: 125 (0.7%)
Northern European: 96 (0.5%)
Scandinavian: 93 (0.5%)
Welsh: 88 (0.5%)
Polish: 86 (0.5%)
African: 85 (0.5%)
French: 67 (0.4%)
Scotch-Irish: 63 (0.4%)
Canadian: 46 (0.3%)
Greek: 43 (0.2%)
Hungarian: 42 (0.2%)
Swiss: 29 (0.2%)
French Canadian: 28 (0.2%)
Czech: 28 (0.2%)
Palestinian: 26 (0.1%)
Maltese: 21 (0.1%)
Danish: 20 (0.1%)
Bulgarian: 17 (0.10%)
Finnish: 17 (0.10%)
Croatian: 17 (0.10%)
Iranian: 15 (0.08%)
Slovene: 15 (0.08%)
Celtic: 13 (0.07%)
Eastern European: 11 (0.06%)
Australian: 10 (0.06%)
Austrian: 9 (0.05%)
Belgian: 9 (0.05%)
Portuguese: 4 (0.02%) Most common places of birth for foreign-born residents (%): Mexico Mount Vernon:
67.0% (3,937)Washington:
21.1% (241,655)
Philippines Mount Vernon:
7.4% (436)Washington:
6.3% (71,661)
Russia Mount Vernon:
3.7% (215)Washington:
1.9% (21,540)
Guatemala Mount Vernon:
2.3% (133)Washington:
1.2% (13,855)
Canada Mount Vernon:
2.2% (129)Washington:
4.1% (47,238)
Ukraine Mount Vernon:
2.0% (117)Washington:
3.1% (35,872)
China, excluding Hong Kong and Taiwan Mount Vernon:
1.7% (98)Washington:
7.4% (84,470)
Vietnam Mount Vernon:
1.7% (98)Washington:
5.4% (62,003)
Place of birth for U.S.-born residents:
This state: 19,091Other state: 10,186Northeast: 1,044Midwest: 2,393South: 1,491West: 5,243 85.8% of Mount Vernon residents lived in the same house 1 years ago.
Out of people who lived in different houses, 29.9% lived in this county.
Out of people who lived in different counties, 72.3% lived in Washington.
Mount Vernon:
85.8%State average:
85.2%
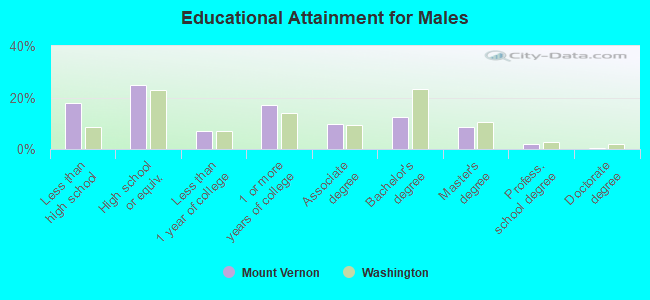
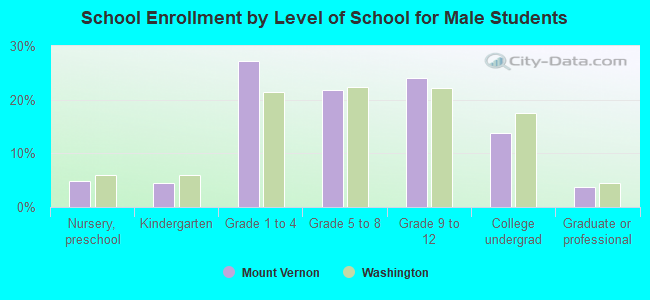
Education attainment for males 25 years and older:
No schooling: 371Nursery to 4th grade: 655th and 6th grade: 787th and 8th grade: 4269th grade: 6210th grade: 17111th grade: 23812th grade, no diploma: 676High school graduate (or equivalency): 2,880Less than 1 year of college: 830Some college more than 1 year, no degree: 1,984Associate degree: 1,123Bachelor's degree: 1,460Master's degree: 977Professional school degree: 237Doctorate degree: 66
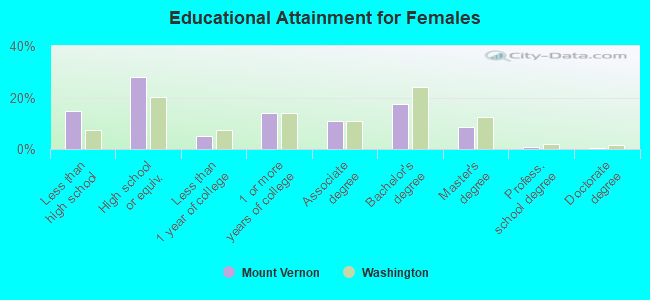
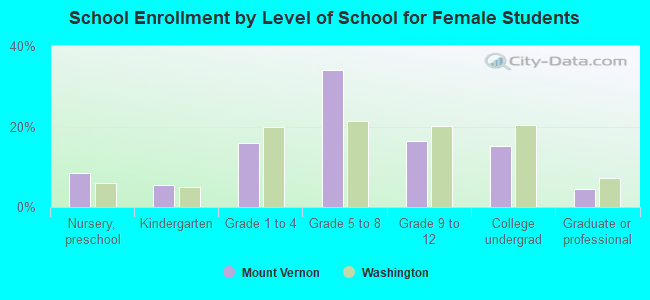
Education attainment for females 25 years and older:
No schooling: 386Nursery to 4th grade: 2645th and 6th grade: 3887th and 8th grade: 929th grade: 17810th grade: 15711th grade: 13212th grade, no diploma: 278High school graduate (or equivalency): 3,582Less than 1 year of college: 660Some college more than 1 year, no degree: 1,806Associate degree: 1,397Bachelor's degree: 2,210Master's degree: 1,084Professional school degree: 112Doctorate degree: 45
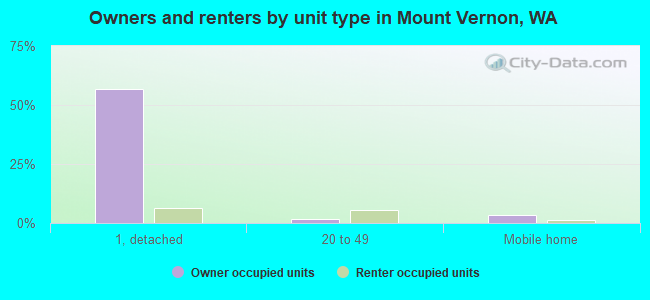
Housing units in structures:
One, detached: 8,531One, attached: 452Two: 4693 or 4: 8855 to 9: 62810 to 19: 38520 to 49: 80250 or more: 735Mobile homes: 629Boats, RVs, vans, etc.: 9Median worth of mobile homes: $55,486
Housing units lacking complete plumbing facilities in 2022: 0.8%Housing units lacking complete kitchen facilities in 2022: 1.0%House/condo owner moved in on average 7 years ago
Renter moved in on average 3 years ago
Private vs. public school enrollment:
Students in private schools in grades 1 to 8 (elementary and middle school): 482 Here:
11.9%Washington:
12.4%
Students in private schools in grades 9 to 12 (high school): 193 Here:
11.4%Washington:
9.2%
Students in private undergraduate colleges: 172 Here:
13.5%Washington:
16.5%