Nashua, NH (New Hampshire) Houses and Residents
Estimated median house or condo value in 2022: $389,100 (it was $132,200 in 2000 )
Nashua:
$389,100New Hampshire:
$384,700
Lower value quartile - upper value quartile: $292,800 - $513,700Mean price in 2022: Detached houses: $452,181 Here:
$452,181State:
$491,479
Townhouses or other attached units: $319,019 Here:
$319,019State:
$361,001
In 2-unit structures: $347,923 Here:
$347,923State:
$368,847
In 3-to-4-unit structures: $511,406 Here:
$511,406State:
$575,942
In 5-or-more-unit structures: $254,648 Here:
$254,648State:
$274,068
Mobile homes: $144,425 Here:
$144,425State:
$124,817
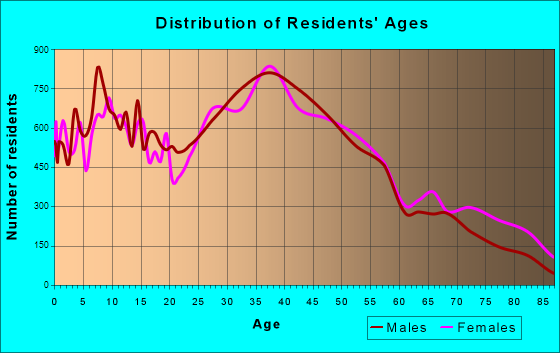
Total population: 87,259 (Urban population: 85,910, Rural population: 695 (all nonfarm) )
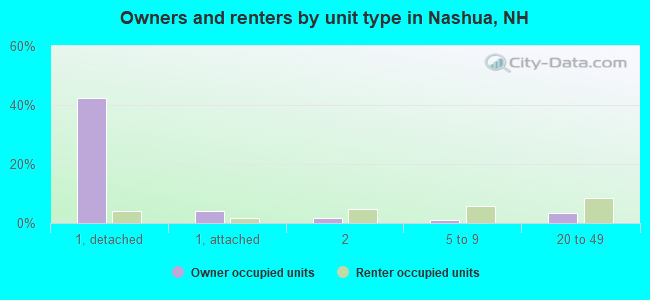
Houses: 39,884 (38,017 occupied: 20,791 owner occupied, 17,226 renter occupied )
% of renters here:
45%State:
28%
Housing density: 1,291 houses/condos per square mile
Median price asked for vacant for-sale houses and condos in 2022: $209,977.
Median contract rent in 2022: $1,483 (lower quartile is $1,111, upper quartile is $1,859)
Median rent asked for vacant for-rent units in 2022: $1,947
Median gross rent in Nashua, NH in 2022: $1,658
Housing units in Nashua with a mortgage: 14,363 (1,179 second mortgage, 0 home equity loan, 1,118 both second mortgage and home equity loan )Houses without a mortgage: 318
Median household income for houses/condos with a mortgage: $141,363
Median household income for apartments without a mortgage: $101,121
Median monthly housing costs: $1,771
Data:
Median house or condo value ($)
Median house or condo value ($ change since 2000)
Median house or condo value ($) - White
Median house or condo value ($) - Black or African American
Median house or condo value ($) - Asian
Median house or condo value ($) - Hispanic or Latino
Median house or condo value ($) - American Indian and Alaska Native
Median house or condo value ($) - Multirace
Median house or condo value ($) - Other Race
Median price asked for mobile homes ($)
Household density (households per square mile)
Mean house or condo value by units in structure - 1, detached ($)
Mean house or condo value by units in structure - 1, attached ($)
Mean house or condo value by units in structure - 2 ($)
Mean house or condo value by units in structure by units in structure - 3 or 4 ($)
Mean house or condo value by units in structure - 5 or more ($)
Mean house or condo value by units in structure - Boat, RV, van, etc. ($)
Mean house or condo value by units in structure - Mobile home ($)
Median contract rent ($)
Median contract rent - Lower quartile ($)
Median contract rent - Upper quartile ($)
Median gross rent ($)
Urban houses (%)
Rural houses (%)
Houses occupied (%)
Houses occupied (% change since 2000)
Houses owner occupied (%)
Houses owner occupied (% change since 2000)
Houses renter occupied (%)
Houses renter occupied (% change since 2000)
Vacant housing units - For rent (%)
Vacant housing units - For rent (% change since 2000)
Vacant housing units - For sale only (%)
Vacant housing units - For sale only (% change since 2000)
Vacant housing units - Rented or sold, not occupied (%)
Vacant housing units - Rented or sold, not occupied (% change since 2000)
Vacant housing units - For seasonal, recreational, or occasional use (%)
Vacant housing units - For seasonal, recreational, or occasional use (% change since 2000)
Vacant housing units - For migrant workers (%)
Vacant housing units - For migrant workers (% change since 2000)
Vacant housing units - Other vacant (%)
Vacant housing units - Other vacant (% change since 2000)
Median monthly housing costs ($)
Median household income for houses/condos with a mortgage ($)
Median household income for houses/condos without a mortgage ($)
Median household income ($)
Median household income ($) - White
Median household income ($) - Black or African American
Median household income ($) - Asian
Median household income ($) - Hispanic or Latino
Median household income ($) - American Indian and Alaska Native
Median household income ($) - Multirace
Median household income ($) - Other Race
Mortgage status - with mortgage (%)
Mortgage status - with second mortgage (%)
Mortgage status - with home equity loan (%)
Mortgage status - with both second mortgage and home equity loan (%)
Mortgage status - without a mortgage (%)
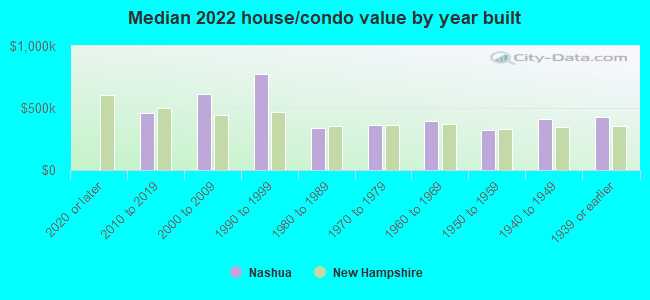
Median year house/condo built
Median year apartment built
Household type by relationship - Male householder living alone (%)
Household type by relationship - Male householder not living alone (%)
Household type by relationship - Female householder living alone (%)
Household type by relationship - Female householder not living alone (%)
Household type by relationship - Opposite-Sex spouse (%)
Household type by relationship - Same-Sex spouse (%)
Household type by relationship - Opposite-Sex unmarried partner (%)
Household type by relationship - Same-Sex unmarried partner (%)
Household type by relationship - In group quarters (%)
Size of family households - 2-person household (%)
Size of family households - 3-person household (%)
Size of family households - 4-person household (%)
Size of family households - 5-person household (%)
Size of family households - 6-person household (%)
Size of family households - 7-or-more-person household (%)
Size of nonfamily households - 1-person household (%)
Size of nonfamily households - 2-person household (%)
Size of nonfamily households - 3-person household (%)
Size of nonfamily households - 4-person household (%)
Size of nonfamily households - 5-person household (%)
Size of nonfamily households - 6-person household (%)
Size of nonfamily households - 7-or-moreperson household (%)
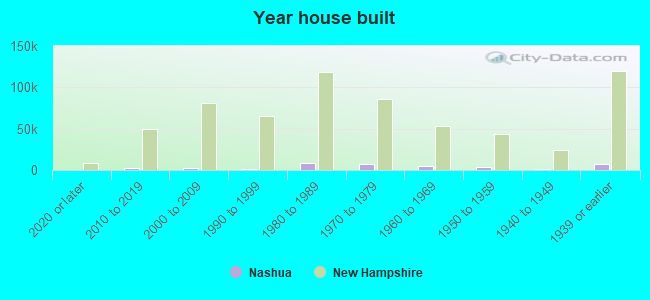
Year house built - Built 2010 or later (%)
Year house built - Built 2000 to 2009 (%)
Year house built - Built 1990 to 1999 (%)
Year house built - Built 1980 to 1989 (%)
Year house built - Built 1970 to 1979 (%)
Year house built - Built 1960 to 1969 (%)
Year house built - Built 1950 to 1959 (%)
Year house built - Built 1940 to 1949 (%)
Year house built - Built 1939 or earlier (%)
Median number of rooms in houses and condos
Median number of rooms in apartments
Median number of bedrooms in owner occupied houses
Mean number of bedrooms in owner occupied houses
Median number of bedrooms in renter occupied houses
Mean number of bedrooms in renter occupied houses
Median number of vehichles in owner occupied houses
Mean number of vehichles in owner occupied houses
Median number of vehichles in renter occupied houses
Mean number of vehichles in renter occupied houses
Rooms in owner-occupied houses - 1 room (%)
Rooms in owner-occupied houses - 2 rooms (%)
Rooms in owner-occupied houses - 3 rooms (%)
Rooms in owner-occupied houses - 4 rooms (%)
Rooms in owner-occupied houses - 5 rooms (%)
Rooms in owner-occupied houses - 6 rooms (%)
Rooms in owner-occupied houses - 7 rooms (%)
Rooms in owner-occupied houses - 8 rooms (%)
Rooms in owner-occupied houses - 9+ rooms (%)
Rooms in renter-occupied houses - 1 room (%)
Rooms in renter-occupied houses - 2 rooms (%)
Rooms in renter-occupied houses - 3 rooms (%)
Rooms in renter-occupied houses - 4 rooms (%)
Rooms in renter-occupied houses - 5 rooms (%)
Rooms in renter-occupied houses - 6 rooms (%)
Rooms in renter-occupied houses - 7 rooms (%)
Rooms in renter-occupied houses - 8 rooms (%)
Rooms in renter-occupied houses - 9+ rooms (%)
Bedrooms in owner-occupied houses - no bedrooms (%)
Bedrooms in owner-occupied houses - 1 bedroom (%)
Bedrooms in owner-occupied houses - 2 bedrooms (%)
Bedrooms in owner-occupied houses - 3 bedrooms (%)
Bedrooms in owner-occupied houses - 4 bedrooms (%)
Bedrooms in owner-occupied houses - 5+ bedrooms (%)
Bedrooms in renter-occupied houses - no bedrooms (%)
Bedrooms in renter-occupied houses - 1 bedroom (%)
Bedrooms in renter-occupied houses - 2 bedrooms (%)
Bedrooms in renter-occupied houses - 3 bedrooms (%)
Bedrooms in renter-occupied houses - 4 bedrooms (%)
Bedrooms in renter-occupied houses - 5+ bedrooms (%)
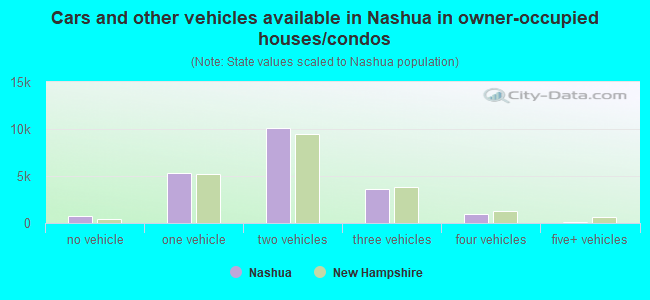
Vehicles available in owner-occupied houses - no vehicle available (%)
Vehicles available in owner-occupied houses - 1 vehicle available(%)
Vehicles available in owner-occupied houses - 2 Vehicles available (%)
Vehicles available in owner-occupied houses - 3 Vehicles available (%)
Vehicles available in owner-occupied houses - 4 Vehicles available (%)
Vehicles available in owner-occupied houses - 5+ Vehicles available (%)
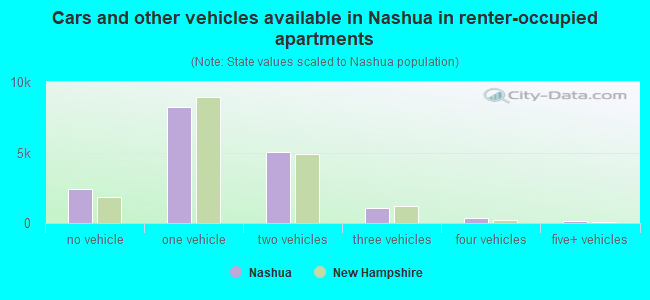
Vehicles available in renter-occupied houses - no vehicle available (%)
Vehicles available in renter-occupied houses - 1 vehicle available (%)
Vehicles available in renter-occupied houses - 2 Vehicles available (%)
Vehicles available in renter-occupied houses - 3 Vehicles available (%)
Vehicles available in renter-occupied houses - 4 Vehicles available (%)
Vehicles available in renter-occupied houses - 5+ Vehicles available (%)
Housing units in structures - 1, detached (%)
Housing units in structures - 1, attached (%)
Housing units in structures - 2 (%)
Housing units in structures - 3 or 4 (%)
Housing units in structures - 5 to 9 (%)
Housing units in structures - 10 to 19 (%)
Housing units in structures - 20 to 49 (%)
Housing units in structures - 50 or more (%)
Housing units in structures - Mobile home (%)
Housing units in structures - Boat, RV, van, etc. (%)
Housing units in structures - Owners - 1, detached (%)
Housing units in structures - Owners - 1, attached (%)
Housing units in structures - Owners - 2 (%)
Housing units in structures - Owners - 3 or 4 (%)
Housing units in structures - Owners - 5 to 9 (%)
Housing units in structures - Owners - 10 to 19 (%)
Housing units in structures - Owners - 20 to 49 (%)
Housing units in structures - Owners - 50 or more (%)
Housing units in structures - Owners - Mobile home (%)
Housing units in structures - Owners - Boat, RV, van, etc. (%)
Housing units in structures - Renters - 1, detached (%)
Housing units in structures - Renters - 1, attached (%)
Housing units in structures - Renters - 2 (%)
Housing units in structures - Renters - 3 or 4 (%)
Housing units in structures - Renters - 5 to 9 (%)
Housing units in structures - Renters - 10 to 19 (%)
Housing units in structures - Renters - 20 to 49 (%)
Housing units in structures - Renters - 50 or more (%)
Housing units in structures - Renters - Mobile home (%)
Housing units in structures - Renters - Boat, RV, van, etc. (%)
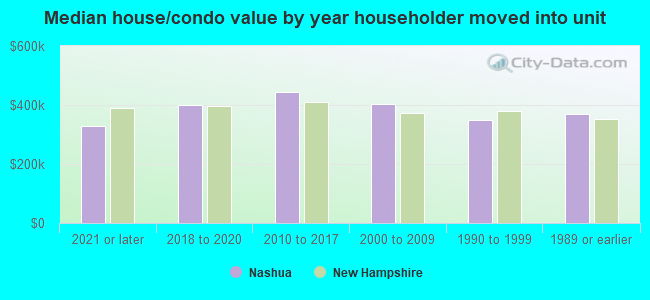
House/condo owner moved in on average (years ago)
Renter moved in on average (years ago)
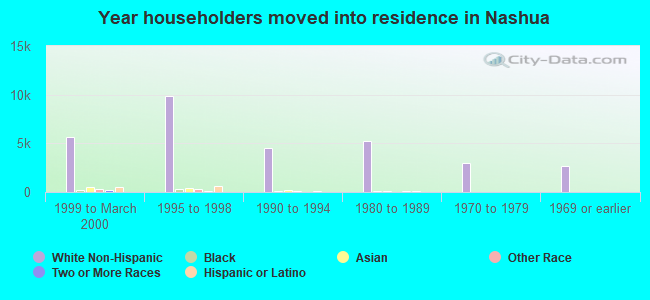
Year householder moved into unit - Moved in 1999 to March 2000 (%)
Year householder moved into unit - Moved in 1999 to March 2000 (%) - White
Year householder moved into unit - Moved in 1999 to March 2000 (%) - Black or African American
Year householder moved into unit - Moved in 1999 to March 2000 (%) - Asian
Year householder moved into unit - Moved in 1999 to March 2000 (%) - Hispanic or Latino
Year householder moved into unit - Moved in 1999 to March 2000 (%) - American Indian and Alaska Native
Year householder moved into unit - Moved in 1999 to March 2000 (%) - Multirace
Year householder moved into unit - Moved in 1999 to March 2000 (%) - Other Race
Year householder moved into unit - Moved in 1995 to 1998 (%)
Year householder moved into unit - Moved in 1995 to 1998 (%) - White
Year householder moved into unit - Moved in 1995 to 1998 (%) - Black or African American
Year householder moved into unit - Moved in 1995 to 1998 (%) - Asian
Year householder moved into unit - Moved in 1995 to 1998 (%) - Hispanic or Latino
Year householder moved into unit - Moved in 1995 to 1998 (%) - American Indian and Alaska Native
Year householder moved into unit - Moved in 1995 to 1998 (%) - Multirace
Year householder moved into unit - Moved in 1995 to 1998 (%) - Other Race
Year householder moved into unit - Moved in 1990 to 1994 (%)
Year householder moved into unit - Moved in 1990 to 1994 (%) - White
Year householder moved into unit - Moved in 1990 to 1994 (%) - Black or African American
Year householder moved into unit - Moved in 1990 to 1994 (%) - Asian
Year householder moved into unit - Moved in 1990 to 1994 (%) - Hispanic or Latino
Year householder moved into unit - Moved in 1990 to 1994 (%) - American Indian and Alaska Native
Year householder moved into unit - Moved in 1990 to 1994 (%) - Multirace
Year householder moved into unit - Moved in 1990 to 1994 (%) - Other Race
Year householder moved into unit - Moved in 1980 to 1989 (%)
Year householder moved into unit - Moved in 1980 to 1989 (%) - White
Year householder moved into unit - Moved in 1980 to 1989 (%) - Black or African American
Year householder moved into unit - Moved in 1980 to 1989 (%) - Asian
Year householder moved into unit - Moved in 1980 to 1989 (%) - Hispanic or Latino
Year householder moved into unit - Moved in 1980 to 1989 (%) - American Indian and Alaska Native
Year householder moved into unit - Moved in 1980 to 1989 (%) - Multirace
Year householder moved into unit - Moved in 1980 to 1989 (%) - Other Race
Year householder moved into unit - Moved in 1970 to 1979 (%)
Year householder moved into unit - Moved in 1970 to 1979 (%) - White
Year householder moved into unit - Moved in 1970 to 1979 (%) - Black or African American
Year householder moved into unit - Moved in 1970 to 1979 (%) - Asian
Year householder moved into unit - Moved in 1970 to 1979 (%) - Hispanic or Latino
Year householder moved into unit - Moved in 1970 to 1979 (%) - American Indian and Alaska Native
Year householder moved into unit - Moved in 1970 to 1979 (%) - Multirace
Year householder moved into unit - Moved in 1970 to 1979 (%) - Other Race
Year householder moved into unit - Moved in 1969 or earlier (%)
Year householder moved into unit - Moved in 1969 or earlier (%) - White
Year householder moved into unit - Moved in 1969 or earlier (%) - Black or African American
Year householder moved into unit - Moved in 1969 or earlier (%) - Asian
Year householder moved into unit - Moved in 1969 or earlier (%) - Hispanic or Latino
Year householder moved into unit - Moved in 1969 or earlier (%) - American Indian and Alaska Native
Year householder moved into unit - Moved in 1969 or earlier (%) - Multirace
Year householder moved into unit - Moved in 1969 or earlier (%) - Other Race
Housing units lacking complete plumbing facilities (%)
Housing units lacking complete kitchen facilities (%)
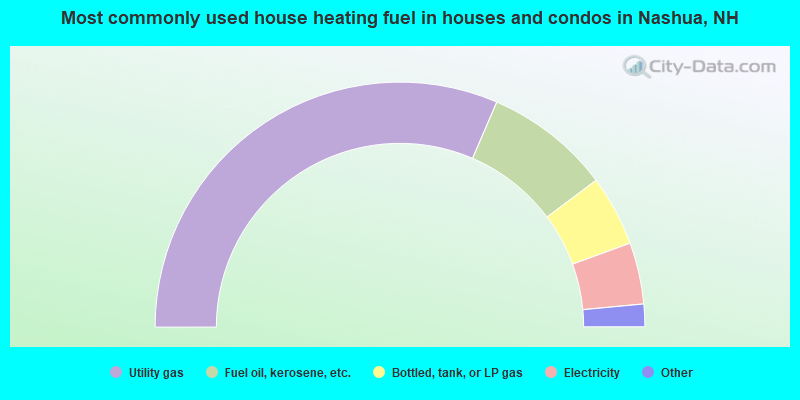
House heating fuel used in houses and condos - Utility gas (%)
House heating fuel used in houses and condos - Bottled, tank, or LP gas (%)
House heating fuel used in houses and condos - Electricity (%)
House heating fuel used in houses and condos - Fuel oil, kerosene, etc. (%)
House heating fuel used in houses and condos - Coal or coke (%)
House heating fuel used in houses and condos - Wood (%)
House heating fuel used in houses and condos - Solar energy (%)
House heating fuel used in houses and condos - Other fuel (%)
House heating fuel used in houses and condos - No fuel used (%)
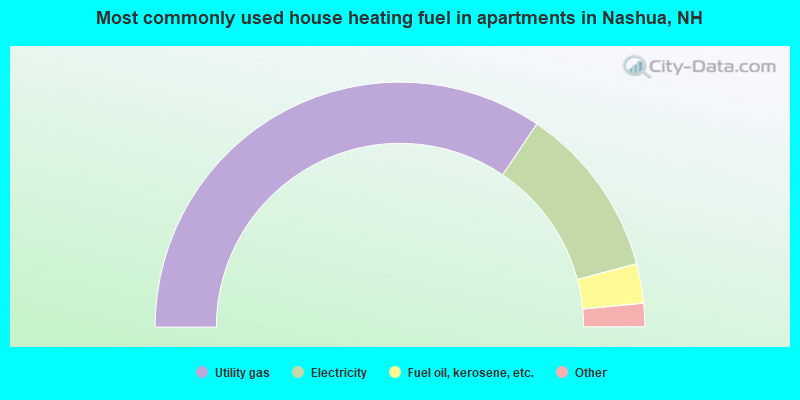
House heating fuel used in apartments - Utility gas (%)
House heating fuel used in apartments - Bottled, tank, or LP gas (%)
House heating fuel used in apartments - Electricity (%)
House heating fuel used in apartments - Fuel oil, kerosene, etc. (%)
House heating fuel used in apartments - Coal or coke (%)
House heating fuel used in apartments - Wood (%)
House heating fuel used in apartments - Solar energy (%)
House heating fuel used in apartments - Other fuel (%)
House heating fuel used in apartments - No fuel used (%)
Latest news about housing in Nashua, NH collected exclusively by city-data.com from local newspapers, TV, and radio stations
Median year house/condo built: 1975Median year apartment built: 1972Household type by relationship:
Households: 91,162
Male householders: 19,099 (6,215 living alone ), Female householders: 18,918 (5,758 living alone )15,715 spouses (15,440 opposite-sex spouses ), 3,910 unmarried partners , (3,910 opposite-sex unmarried partners ), 23,177 children (21,681 natural , 640 adopted , 856 stepchildren ), 3,970 grandchildren , 912 brothers or sisters , 1,062 parents , 0 foster children , 1,141 other relatives , 2,449 non-relatives In group quarters: 809
Size of family households: 9,342 2-persons , 5,419 3-persons , 5,611 4-persons , 1,638 5-persons , 58 6-persons , 719 7-or-more-persons .
Size of nonfamily households: 11,973 1-person , 2,614 2-persons , 643 3-persons .
9,039 married couples with children. single-parent households (1,931 men , 2,672 women ).
79.1% of residents of Nashua speak English at home. of residents speak Spanish at home (43% speak English very well , 20% speak English well , 21% speak English not well , 15% don't speak English at all ).of residents speak other Indo-European language at home (73% speak English very well , 18% speak English well , 7% speak English not well , 1% don't speak English at all ).of residents speak Asian or Pacific Island language at home (70% speak English very well , 18% speak English well , 10% speak English not well , 2% don't speak English at all ).of residents speak other language at home (76% speak English very well , 19% speak English well , 5% speak English not well ).
Foreign born population: 17,081 (18.7%)of them are naturalized citizens )
Median number of rooms in houses and condos:
Median number of rooms in apartments
Owner-occupied Renter-occupied
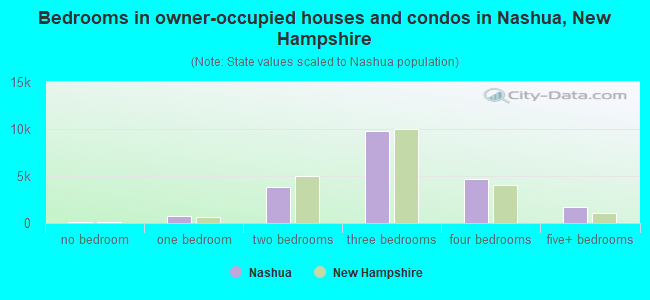
Bedrooms in owner-occupied houses and condos in Nashua, New Hampshire
120 no bedroom 714 1 bedroom 3,809 2 bedrooms 9,771 3 bedrooms 4,637 4 bedrooms 1,740 5+ bedrooms
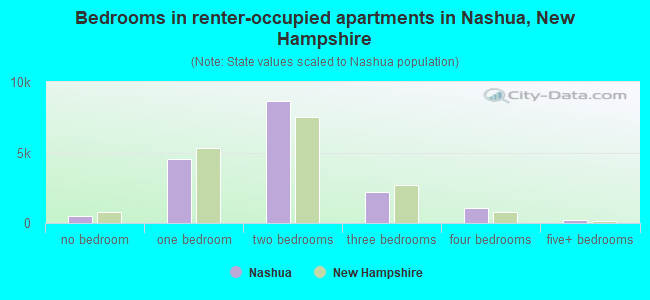
Bedrooms in renter-occupied apartments in Nashua, New Hampshire
517 no bedroom 4,548 1 bedroom 8,687 2 bedrooms 2,218 3 bedrooms 1,049 4 bedrooms 207 5+ bedrooms
Owner-occupied Renter-occupied
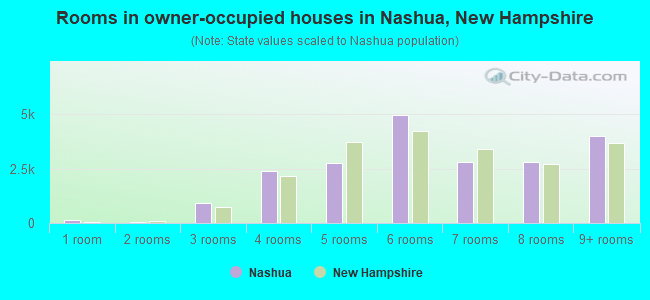
Rooms in owner-occupied houses in Nashua, New Hampshire
120 1 room 40 2 rooms 908 3 rooms 2,371 4 rooms 2,763 5 rooms 4,963 6 rooms 2,796 7 rooms 2,811 8 rooms 4,019 9+ rooms
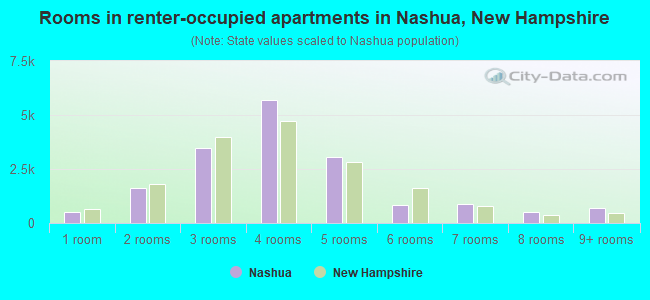
Rooms in renter-occupied apartments in Nashua, New Hampshire
517 1 room 1,599 2 rooms 3,481 3 rooms 5,681 4 rooms 3,039 5 rooms 826 6 rooms 865 7 rooms 520 8 rooms 698 9+ rooms
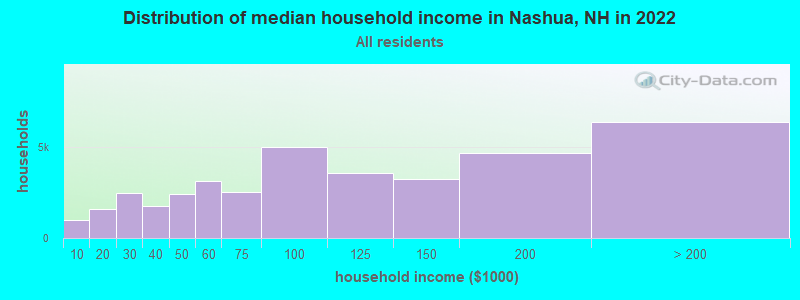
Nashua, NH household income distribution 1,004 Less than $10,0001,586 $10,000 to $19,9992,510 $20,000 to $29,9991,769 $30,000 to $39,9992,412 $40,000 to $49,9993,168 $50,000 to $59,9992,552 $60,000 to $74,9995,049 $75,000 to $99,9993,576 $100,000 to $124,9993,283 $125,000 to $149,9994,704 $150,000 to $199,9996,404 $200,000 or more
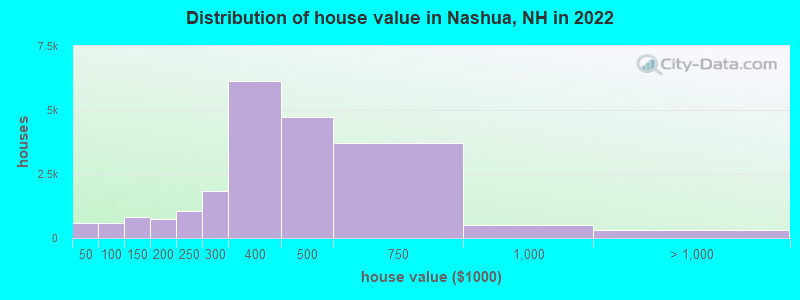
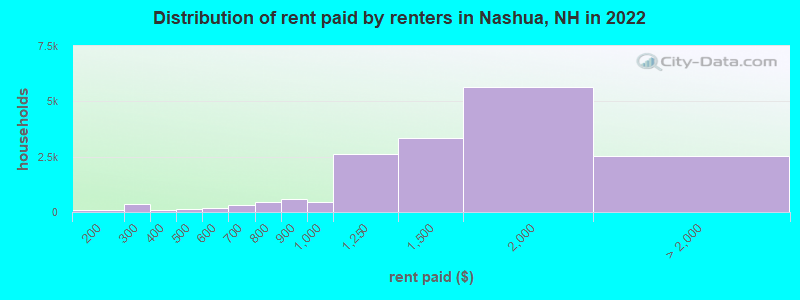
Home value of owner - occupied houses in 2022 in Nashua, NH 212 Less than $10,00072 $10,000 to $14,99916 $15,000 to $19,99918 $20,000 to $24,99974 $25,000 to $29,99968 $30,000 to $34,99960 $35,000 to $39,99955 $40,000 to $49,99964 $50,000 to $59,999105 $60,000 to $69,999101 $70,000 to $79,99984 $80,000 to $89,999188 $90,000 to $99,999430 $100,000 to $124,999392 $125,000 to $149,999466 $150,000 to $174,999288 $175,000 to $199,9991,046 $200,000 to $249,9991,839 $250,000 to $299,9996,145 $300,000 to $399,9994,718 $400,000 to $499,9993,721 $500,000 to $749,999515 $750,000 to $999,999263 $1,000,000 to $1,499,99924 $1,500,000 to $1,999,99937 $2,000,000 or moreRent paid by renters in 2022 in Nashua, NH 49 Less than $10084 $100 to $149104 $200 to $249233 $250 to $29930 $300 to $34943 $350 to $39953 $400 to $44981 $450 to $499137 $500 to $54953 $550 to $599225 $600 to $64997 $650 to $699243 $700 to $749202 $750 to $799573 $800 to $899467 $900 to $9992,611 $1,000 to $1,2493,362 $1,250 to $1,4995,632 $1,500 to $1,9991,642 $2,000 to $2,499367 $2,500 to $2,999143 $3,000 to $3,49948 $3,500 or more333 No cash rent
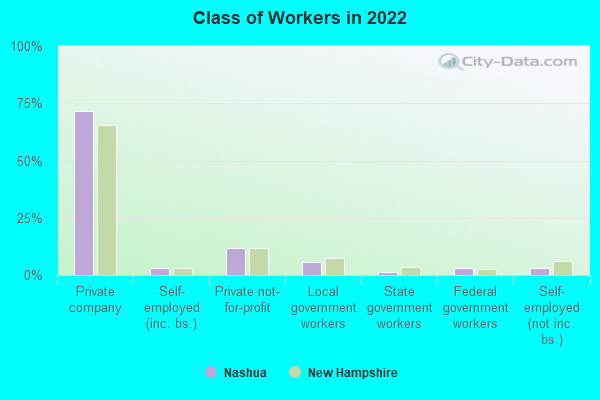
Percentage of workers working in this county: 72.3%Number of people working at home: 8,475 (16.3% of all workers )
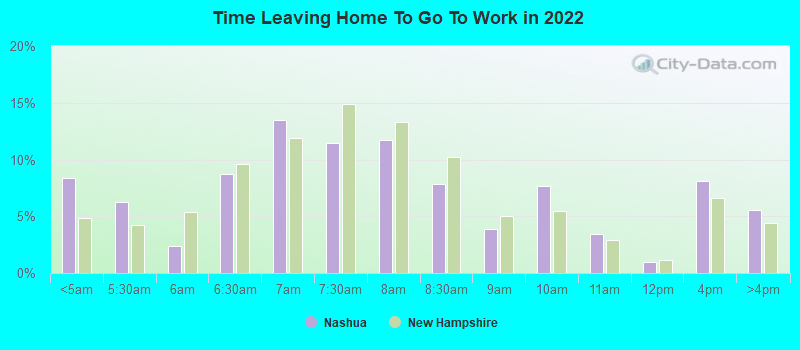
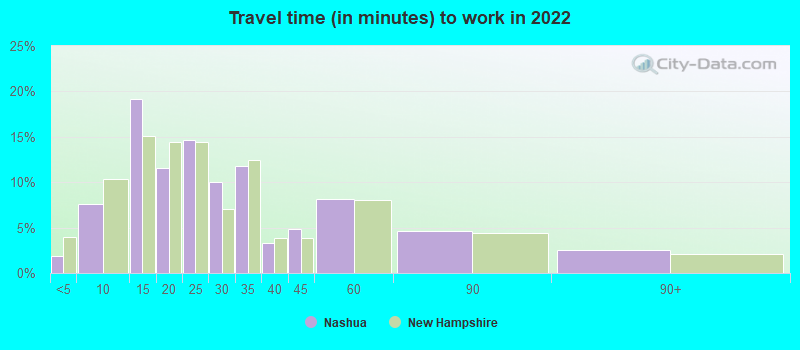
Travel time to work (commute)
Less than 5 minutes: 3135 to 9 minutes: 3,22110 to 14 minutes: 9,01515 to 19 minutes: 7,00720 to 24 minutes: 4,05925 to 29 minutes: 3,71730 to 34 minutes: 3,87435 to 39 minutes: 87640 to 44 minutes: 1,37445 to 59 minutes: 3,62560 to 89 minutes: 2,85290 or more minutes: 1,461
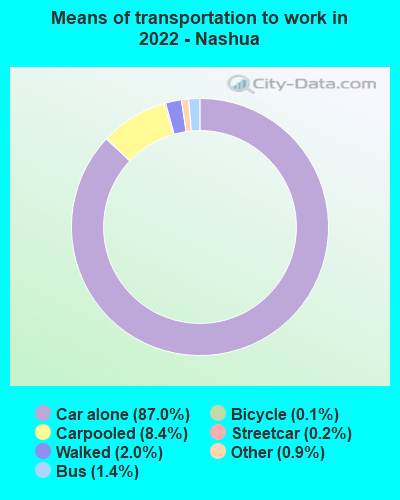
Means of transportation to work:
Drove a car alone: 39,496 (71.0%)Carpooled: 4,911 (8.8%)Bus : 330 (0.6%)Subway or elevated rail : 105 (0.2%)Long-distance train or commuter rail : 6 (0.0%)Light rail, streetcar or trolley : 22 (0.0%)Taxi: 456 (0.8%)Bicycle: 96 (0.2%)Walked: 951 (1.7%)Worked at home: 8,475 (15.2%)
Unemployment by race in 2022
Unemployment rate for White non-Hispanic residents 7.5% Males3.1% FemalesUnemployment rate for Black residents 9.1% Males3.9% FemalesUnemployment rate for Asian residents 4.0% Males15.1% FemalesUnemployment rate for other race residents 7.5% Males2.2% FemalesUnemployment rate for two or more race residents 1.5% Males2.0% FemalesUnemployment rate for Hispanic or Latino residents 7.4% Males2.9% Females
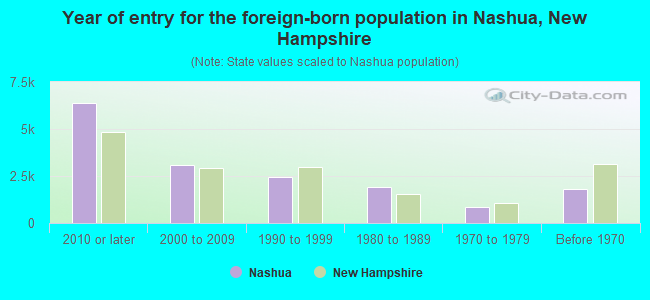
Year of entry for the foreign-born population in Nashua, New Hampshire
6,385 2010 or later 3,074 2000 to 2009 2,439 1990 to 1999 1,930 1980 to 1989 850 1970 to 1979 1,818 Before 1970
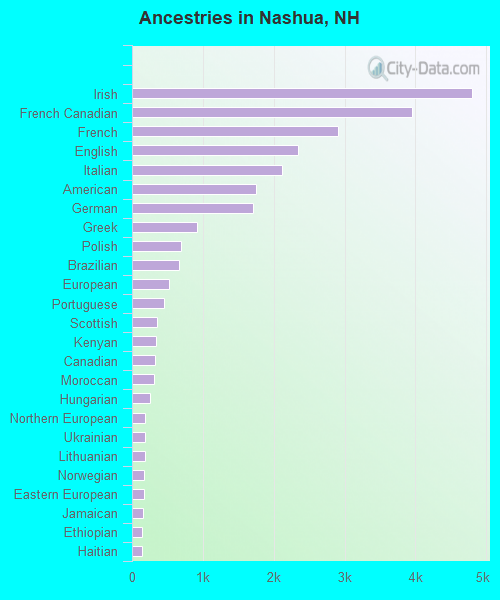
First ancestries reported:
Irish: 4,798 (11.2%)
French Canadian: 3,957 (9.2%)
French: 2,903 (6.8%)
English: 2,343 (5.5%)
Italian: 2,116 (4.9%)
American: 1,753 (4.1%)
German: 1,706 (4.0%)
Greek: 915 (2.1%)
Polish: 694 (1.6%)
Brazilian: 663 (1.5%)
European: 525 (1.2%)
Portuguese: 449 (1.0%)
Scottish: 352 (0.8%)
Kenyan: 337 (0.8%)
Canadian: 331 (0.8%)
Moroccan: 316 (0.7%)
Hungarian: 255 (0.6%)
Northern European: 188 (0.4%)
Ukrainian: 187 (0.4%)
Lithuanian: 178 (0.4%)
Norwegian: 169 (0.4%)
Eastern European: 166 (0.4%)
Jamaican: 150 (0.4%)
Ethiopian: 147 (0.3%)
Haitian: 135 (0.3%)
Russian: 132 (0.3%)
Swedish: 124 (0.3%)
Scotch-Irish: 124 (0.3%)
Iranian: 97 (0.2%)
Armenian: 92 (0.2%)
Syrian: 90 (0.2%)
Dutch: 74 (0.2%)
Welsh: 70 (0.2%)
Finnish: 65 (0.2%)
Danish: 64 (0.1%)
Turkish: 57 (0.1%)
Ghanaian: 52 (0.1%)
Cape Verdean: 48 (0.1%)
British: 46 (0.1%)
Romanian: 43 (0.1%)
African: 43 (0.1%)
Egyptian: 37 (0.09%)
Slovak: 31 (0.07%)
Austrian: 31 (0.07%)
Liberian: 28 (0.07%)
Lebanese: 28 (0.07%)
Swiss: 20 (0.05%)
Jordanian: 20 (0.05%)
Palestinian: 18 (0.04%)
Albanian: 15 (0.04%)
Bulgarian: 14 (0.03%)
British West Indian: 14 (0.03%)
Icelander: 12 (0.03%)
Belgian: 12 (0.03%)
Cajun: 11 (0.03%)
Slavic: 11 (0.03%)
Trinidadian and Tobagonian: 10 (0.02%)
Slovene: 9 (0.02%)
U.S. Virgin Islander: 9 (0.02%)
West Indian: 9 (0.02%)
Latvian: 8 (0.02%)
Czechoslovakian: 5 (0.01%)
Most common places of birth for foreign-born residents (%): India Nashua:
20.6% (3,016)New Hampshire:
9.1% (7,609)
Dominican Republic Nashua:
18.0% (2,632)New Hampshire:
7.0% (5,842)
Canada Nashua:
6.9% (1,004)New Hampshire:
9.1% (7,618)
Brazil Nashua:
6.3% (924)New Hampshire:
3.6% (2,964)
Mexico Nashua:
4.4% (651)New Hampshire:
2.0% (1,650)
China, excluding Hong Kong and Taiwan Nashua:
3.8% (559)New Hampshire:
4.5% (3,775)
Colombia Nashua:
2.4% (346)New Hampshire:
1.4% (1,179)
Germany Nashua:
2.4% (346)New Hampshire:
3.3% (2,742)
Vietnam Nashua:
2.3% (340)New Hampshire:
2.2% (1,838)
Nepal Nashua:
2.1% (304)New Hampshire:
2.5% (2,112)
Honduras Nashua:
2.0% (298)New Hampshire:
1.5% (1,270)
Korea Nashua:
2.0% (293)New Hampshire:
2.7% (2,211)
Place of birth for U.S.-born residents:
This state: 25,327Other state: 46,588Northeast: 38,668Midwest: 2,681South: 3,339West: 1,900 90.8% of Nashua residents lived in the same house 1 years ago.
Out of people who lived in different houses, 26.9% lived in this county.
Out of people who lived in different counties, 16.0% lived in New Hampshire.
Nashua:
90.8%State average:
89.8%
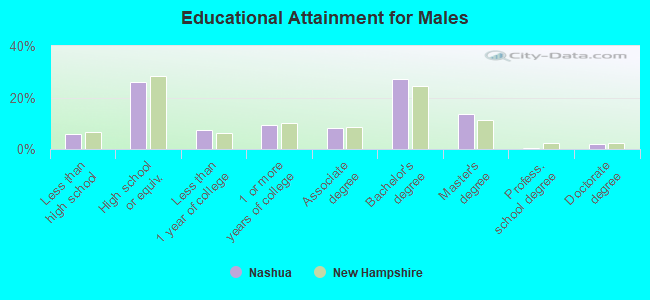
Education attainment for males 25 years and older:
No schooling: 299Nursery to 4th grade: 05th and 6th grade: 07th and 8th grade: 729th grade: 39710th grade: 82711th grade: 15212th grade, no diploma: 172High school graduate (or equivalency): 8,746Less than 1 year of college: 2,494Some college more than 1 year, no degree: 3,135Associate degree: 2,750Bachelor's degree: 9,100Master's degree: 4,524Professional school degree: 154Doctorate degree: 622
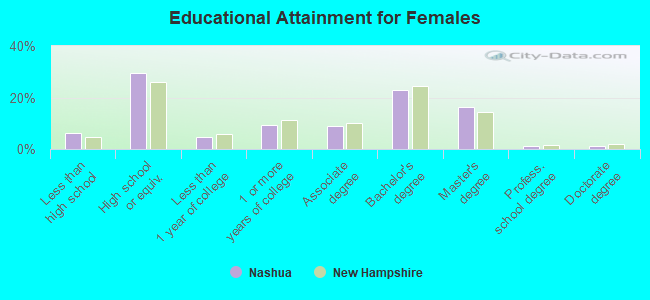
Education attainment for females 25 years and older:
No schooling: 274Nursery to 4th grade: 05th and 6th grade: 2707th and 8th grade: 2869th grade: 38110th grade: 49811th grade: 40912th grade, no diploma: 36High school graduate (or equivalency): 10,248Less than 1 year of college: 1,601Some college more than 1 year, no degree: 3,200Associate degree: 3,169Bachelor's degree: 7,979Master's degree: 5,681Professional school degree: 437Doctorate degree: 378
Housing units in structures:
One, detached: 18,059One, attached: 1,912Two: 3,2523 or 4: 2,8425 to 9: 2,16710 to 19: 2,48620 to 49: 5,30950 or more: 2,960Mobile homes: 897Median worth of mobile homes: $122,100
Housing units lacking complete plumbing facilities in 2022: 1.5%Housing units lacking complete kitchen facilities in 2022: 0.6%House/condo owner moved in on average 11 years ago
Renter moved in on average 3 years ago
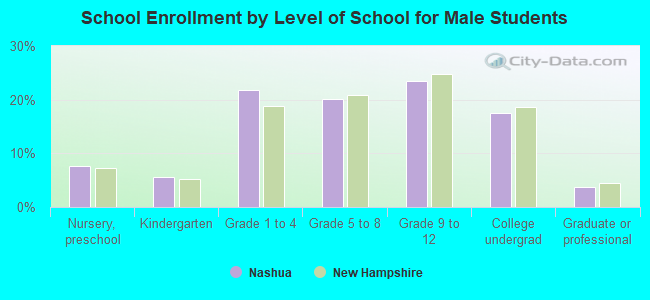
Private vs. public school enrollment:
Students in private schools in grades 1 to 8 (elementary and middle school): 800 Here:
12.8%New Hampshire:
11.4%
Students in private schools in grades 9 to 12 (high school): 177 Here:
4.6%New Hampshire:
14.0%
Students in private undergraduate colleges: 1,090 Here:
42.2%New Hampshire:
38.0%