Nashville-Davidson, TN (Tennessee) Houses and Residents
Estimated median house or condo value in 2022: $432,400 (it was $111,800 in 2000 )
Nashville-Davidson:
$432,400Tennessee:
$284,800
Lower value quartile - upper value quartile: $315,000 - $646,900Mean price in 2022: Detached houses: $554,540 Here:
$554,540State:
$374,382
Townhouses or other attached units: $387,192 Here:
$387,192State:
$354,101
In 2-unit structures: $387,920 Here:
$387,920State:
$247,693
In 3-to-4-unit structures: $229,291 Here:
$229,291State:
$239,060
In 5-or-more-unit structures: $442,263 Here:
$442,263State:
$317,434
Mobile homes: $281,131 Here:
$281,131State:
$101,421
Occupied boats, RVs, vans, etc.: $153,197 Here:
$153,197State:
$142,822
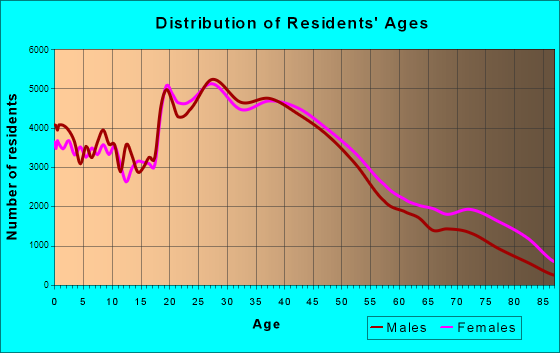
Total population: 644,014 (Urban population: 521,985, Rural population: 23,564 (481 farm, 23,083 nonfarm ))
Houses: 347,694 (317,817 occupied: 166,532 owner occupied, 151,285 renter occupied )
% of renters here:
48%State:
33%
Housing density: 735 houses/condos per square mile
Median price asked for vacant for-sale houses and condos in 2022: $893,014.
Median contract rent in 2022: $1,313 (lower quartile is $987, upper quartile is $1,737)
Median rent asked for vacant for-rent units in 2022: $1,705
Median gross rent in Nashville-Davidson, TN in 2022: $1,464
Housing units in Nashville-Davidson with a mortgage: 112,358 (10,726 second mortgage, 363 home equity loan, 9,027 both second mortgage and home equity loan )Houses without a mortgage: 1,910
Median household income for houses/condos with a mortgage: $107,746
Median household income for apartments without a mortgage: $75,699
Median monthly housing costs: $1,429
Data:
Median house or condo value ($)
Median house or condo value ($ change since 2000)
Median house or condo value ($) - White
Median house or condo value ($) - Black or African American
Median house or condo value ($) - Asian
Median house or condo value ($) - Hispanic or Latino
Median house or condo value ($) - American Indian and Alaska Native
Median house or condo value ($) - Multirace
Median house or condo value ($) - Other Race
Median price asked for mobile homes ($)
Household density (households per square mile)
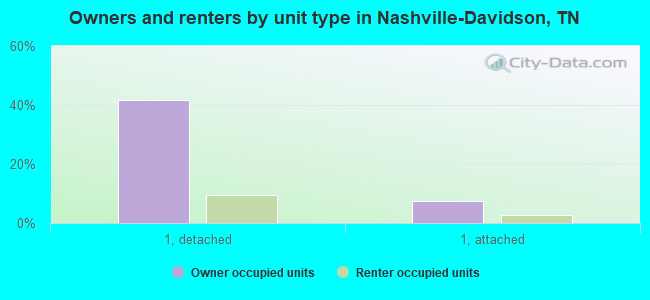
Mean house or condo value by units in structure - 1, detached ($)
Mean house or condo value by units in structure - 1, attached ($)
Mean house or condo value by units in structure - 2 ($)
Mean house or condo value by units in structure by units in structure - 3 or 4 ($)
Mean house or condo value by units in structure - 5 or more ($)
Mean house or condo value by units in structure - Boat, RV, van, etc. ($)
Mean house or condo value by units in structure - Mobile home ($)
Median contract rent ($)
Median contract rent - Lower quartile ($)
Median contract rent - Upper quartile ($)
Median gross rent ($)
Urban houses (%)
Rural houses (%)
Houses occupied (%)
Houses occupied (% change since 2000)
Houses owner occupied (%)
Houses owner occupied (% change since 2000)
Houses renter occupied (%)
Houses renter occupied (% change since 2000)
Vacant housing units - For rent (%)
Vacant housing units - For rent (% change since 2000)
Vacant housing units - For sale only (%)
Vacant housing units - For sale only (% change since 2000)
Vacant housing units - Rented or sold, not occupied (%)
Vacant housing units - Rented or sold, not occupied (% change since 2000)
Vacant housing units - For seasonal, recreational, or occasional use (%)
Vacant housing units - For seasonal, recreational, or occasional use (% change since 2000)
Vacant housing units - For migrant workers (%)
Vacant housing units - For migrant workers (% change since 2000)
Vacant housing units - Other vacant (%)
Vacant housing units - Other vacant (% change since 2000)
Median monthly housing costs ($)
Median household income for houses/condos with a mortgage ($)
Median household income for houses/condos without a mortgage ($)
Median household income ($)
Median household income ($) - White
Median household income ($) - Black or African American
Median household income ($) - Asian
Median household income ($) - Hispanic or Latino
Median household income ($) - American Indian and Alaska Native
Median household income ($) - Multirace
Median household income ($) - Other Race
Mortgage status - with mortgage (%)
Mortgage status - with second mortgage (%)
Mortgage status - with home equity loan (%)
Mortgage status - with both second mortgage and home equity loan (%)
Mortgage status - without a mortgage (%)
Median year house/condo built
Median year apartment built
Household type by relationship - Male householder living alone (%)
Household type by relationship - Male householder not living alone (%)
Household type by relationship - Female householder living alone (%)
Household type by relationship - Female householder not living alone (%)
Household type by relationship - Opposite-Sex spouse (%)
Household type by relationship - Same-Sex spouse (%)
Household type by relationship - Opposite-Sex unmarried partner (%)
Household type by relationship - Same-Sex unmarried partner (%)
Household type by relationship - In group quarters (%)
Size of family households - 2-person household (%)
Size of family households - 3-person household (%)
Size of family households - 4-person household (%)
Size of family households - 5-person household (%)
Size of family households - 6-person household (%)
Size of family households - 7-or-more-person household (%)
Size of nonfamily households - 1-person household (%)
Size of nonfamily households - 2-person household (%)
Size of nonfamily households - 3-person household (%)
Size of nonfamily households - 4-person household (%)
Size of nonfamily households - 5-person household (%)
Size of nonfamily households - 6-person household (%)
Size of nonfamily households - 7-or-moreperson household (%)
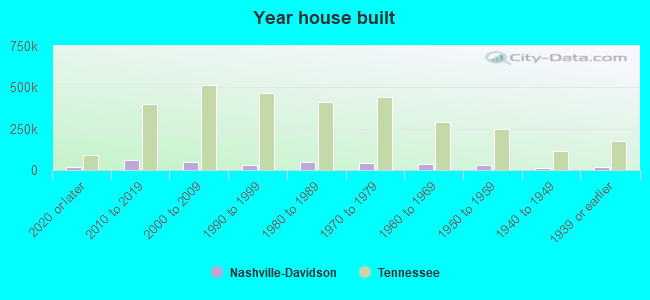
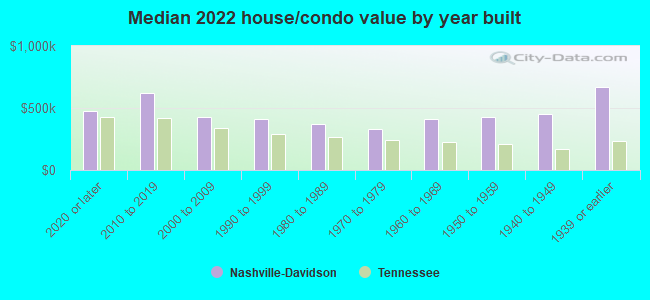
Year house built - Built 2010 or later (%)
Year house built - Built 2000 to 2009 (%)
Year house built - Built 1990 to 1999 (%)
Year house built - Built 1980 to 1989 (%)
Year house built - Built 1970 to 1979 (%)
Year house built - Built 1960 to 1969 (%)
Year house built - Built 1950 to 1959 (%)
Year house built - Built 1940 to 1949 (%)
Year house built - Built 1939 or earlier (%)
Median number of rooms in houses and condos
Median number of rooms in apartments
Median number of bedrooms in owner occupied houses
Mean number of bedrooms in owner occupied houses
Median number of bedrooms in renter occupied houses
Mean number of bedrooms in renter occupied houses
Median number of vehichles in owner occupied houses
Mean number of vehichles in owner occupied houses
Median number of vehichles in renter occupied houses
Mean number of vehichles in renter occupied houses
Rooms in owner-occupied houses - 1 room (%)
Rooms in owner-occupied houses - 2 rooms (%)
Rooms in owner-occupied houses - 3 rooms (%)
Rooms in owner-occupied houses - 4 rooms (%)
Rooms in owner-occupied houses - 5 rooms (%)
Rooms in owner-occupied houses - 6 rooms (%)
Rooms in owner-occupied houses - 7 rooms (%)
Rooms in owner-occupied houses - 8 rooms (%)
Rooms in owner-occupied houses - 9+ rooms (%)
Rooms in renter-occupied houses - 1 room (%)
Rooms in renter-occupied houses - 2 rooms (%)
Rooms in renter-occupied houses - 3 rooms (%)
Rooms in renter-occupied houses - 4 rooms (%)
Rooms in renter-occupied houses - 5 rooms (%)
Rooms in renter-occupied houses - 6 rooms (%)
Rooms in renter-occupied houses - 7 rooms (%)
Rooms in renter-occupied houses - 8 rooms (%)
Rooms in renter-occupied houses - 9+ rooms (%)
Bedrooms in owner-occupied houses - no bedrooms (%)
Bedrooms in owner-occupied houses - 1 bedroom (%)
Bedrooms in owner-occupied houses - 2 bedrooms (%)
Bedrooms in owner-occupied houses - 3 bedrooms (%)
Bedrooms in owner-occupied houses - 4 bedrooms (%)
Bedrooms in owner-occupied houses - 5+ bedrooms (%)
Bedrooms in renter-occupied houses - no bedrooms (%)
Bedrooms in renter-occupied houses - 1 bedroom (%)
Bedrooms in renter-occupied houses - 2 bedrooms (%)
Bedrooms in renter-occupied houses - 3 bedrooms (%)
Bedrooms in renter-occupied houses - 4 bedrooms (%)
Bedrooms in renter-occupied houses - 5+ bedrooms (%)
Vehicles available in owner-occupied houses - no vehicle available (%)
Vehicles available in owner-occupied houses - 1 vehicle available(%)
Vehicles available in owner-occupied houses - 2 Vehicles available (%)
Vehicles available in owner-occupied houses - 3 Vehicles available (%)
Vehicles available in owner-occupied houses - 4 Vehicles available (%)
Vehicles available in owner-occupied houses - 5+ Vehicles available (%)
Vehicles available in renter-occupied houses - no vehicle available (%)
Vehicles available in renter-occupied houses - 1 vehicle available (%)
Vehicles available in renter-occupied houses - 2 Vehicles available (%)
Vehicles available in renter-occupied houses - 3 Vehicles available (%)
Vehicles available in renter-occupied houses - 4 Vehicles available (%)
Vehicles available in renter-occupied houses - 5+ Vehicles available (%)
Housing units in structures - 1, detached (%)
Housing units in structures - 1, attached (%)
Housing units in structures - 2 (%)
Housing units in structures - 3 or 4 (%)
Housing units in structures - 5 to 9 (%)
Housing units in structures - 10 to 19 (%)
Housing units in structures - 20 to 49 (%)
Housing units in structures - 50 or more (%)
Housing units in structures - Mobile home (%)
Housing units in structures - Boat, RV, van, etc. (%)
Housing units in structures - Owners - 1, detached (%)
Housing units in structures - Owners - 1, attached (%)
Housing units in structures - Owners - 2 (%)
Housing units in structures - Owners - 3 or 4 (%)
Housing units in structures - Owners - 5 to 9 (%)
Housing units in structures - Owners - 10 to 19 (%)
Housing units in structures - Owners - 20 to 49 (%)
Housing units in structures - Owners - 50 or more (%)
Housing units in structures - Owners - Mobile home (%)
Housing units in structures - Owners - Boat, RV, van, etc. (%)
Housing units in structures - Renters - 1, detached (%)
Housing units in structures - Renters - 1, attached (%)
Housing units in structures - Renters - 2 (%)
Housing units in structures - Renters - 3 or 4 (%)
Housing units in structures - Renters - 5 to 9 (%)
Housing units in structures - Renters - 10 to 19 (%)
Housing units in structures - Renters - 20 to 49 (%)
Housing units in structures - Renters - 50 or more (%)
Housing units in structures - Renters - Mobile home (%)
Housing units in structures - Renters - Boat, RV, van, etc. (%)
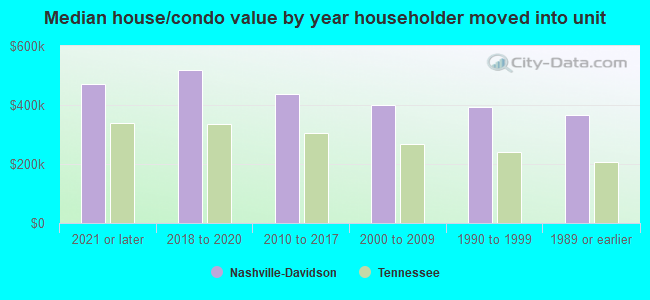
House/condo owner moved in on average (years ago)
Renter moved in on average (years ago)
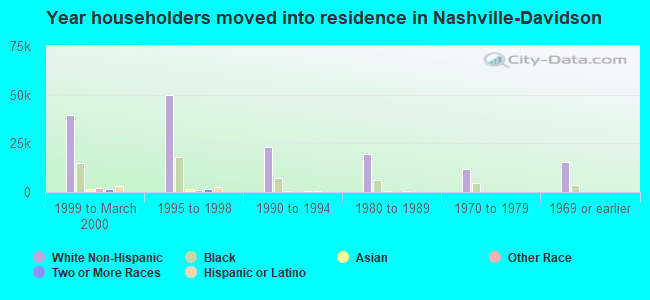
Year householder moved into unit - Moved in 1999 to March 2000 (%)
Year householder moved into unit - Moved in 1999 to March 2000 (%) - White
Year householder moved into unit - Moved in 1999 to March 2000 (%) - Black or African American
Year householder moved into unit - Moved in 1999 to March 2000 (%) - Asian
Year householder moved into unit - Moved in 1999 to March 2000 (%) - Hispanic or Latino
Year householder moved into unit - Moved in 1999 to March 2000 (%) - American Indian and Alaska Native
Year householder moved into unit - Moved in 1999 to March 2000 (%) - Multirace
Year householder moved into unit - Moved in 1999 to March 2000 (%) - Other Race
Year householder moved into unit - Moved in 1995 to 1998 (%)
Year householder moved into unit - Moved in 1995 to 1998 (%) - White
Year householder moved into unit - Moved in 1995 to 1998 (%) - Black or African American
Year householder moved into unit - Moved in 1995 to 1998 (%) - Asian
Year householder moved into unit - Moved in 1995 to 1998 (%) - Hispanic or Latino
Year householder moved into unit - Moved in 1995 to 1998 (%) - American Indian and Alaska Native
Year householder moved into unit - Moved in 1995 to 1998 (%) - Multirace
Year householder moved into unit - Moved in 1995 to 1998 (%) - Other Race
Year householder moved into unit - Moved in 1990 to 1994 (%)
Year householder moved into unit - Moved in 1990 to 1994 (%) - White
Year householder moved into unit - Moved in 1990 to 1994 (%) - Black or African American
Year householder moved into unit - Moved in 1990 to 1994 (%) - Asian
Year householder moved into unit - Moved in 1990 to 1994 (%) - Hispanic or Latino
Year householder moved into unit - Moved in 1990 to 1994 (%) - American Indian and Alaska Native
Year householder moved into unit - Moved in 1990 to 1994 (%) - Multirace
Year householder moved into unit - Moved in 1990 to 1994 (%) - Other Race
Year householder moved into unit - Moved in 1980 to 1989 (%)
Year householder moved into unit - Moved in 1980 to 1989 (%) - White
Year householder moved into unit - Moved in 1980 to 1989 (%) - Black or African American
Year householder moved into unit - Moved in 1980 to 1989 (%) - Asian
Year householder moved into unit - Moved in 1980 to 1989 (%) - Hispanic or Latino
Year householder moved into unit - Moved in 1980 to 1989 (%) - American Indian and Alaska Native
Year householder moved into unit - Moved in 1980 to 1989 (%) - Multirace
Year householder moved into unit - Moved in 1980 to 1989 (%) - Other Race
Year householder moved into unit - Moved in 1970 to 1979 (%)
Year householder moved into unit - Moved in 1970 to 1979 (%) - White
Year householder moved into unit - Moved in 1970 to 1979 (%) - Black or African American
Year householder moved into unit - Moved in 1970 to 1979 (%) - Asian
Year householder moved into unit - Moved in 1970 to 1979 (%) - Hispanic or Latino
Year householder moved into unit - Moved in 1970 to 1979 (%) - American Indian and Alaska Native
Year householder moved into unit - Moved in 1970 to 1979 (%) - Multirace
Year householder moved into unit - Moved in 1970 to 1979 (%) - Other Race
Year householder moved into unit - Moved in 1969 or earlier (%)
Year householder moved into unit - Moved in 1969 or earlier (%) - White
Year householder moved into unit - Moved in 1969 or earlier (%) - Black or African American
Year householder moved into unit - Moved in 1969 or earlier (%) - Asian
Year householder moved into unit - Moved in 1969 or earlier (%) - Hispanic or Latino
Year householder moved into unit - Moved in 1969 or earlier (%) - American Indian and Alaska Native
Year householder moved into unit - Moved in 1969 or earlier (%) - Multirace
Year householder moved into unit - Moved in 1969 or earlier (%) - Other Race
Housing units lacking complete plumbing facilities (%)
Housing units lacking complete kitchen facilities (%)
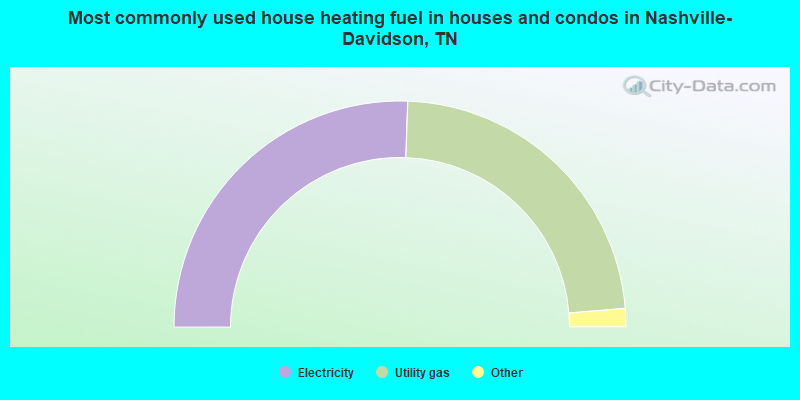
House heating fuel used in houses and condos - Utility gas (%)
House heating fuel used in houses and condos - Bottled, tank, or LP gas (%)
House heating fuel used in houses and condos - Electricity (%)
House heating fuel used in houses and condos - Fuel oil, kerosene, etc. (%)
House heating fuel used in houses and condos - Coal or coke (%)
House heating fuel used in houses and condos - Wood (%)
House heating fuel used in houses and condos - Solar energy (%)
House heating fuel used in houses and condos - Other fuel (%)
House heating fuel used in houses and condos - No fuel used (%)
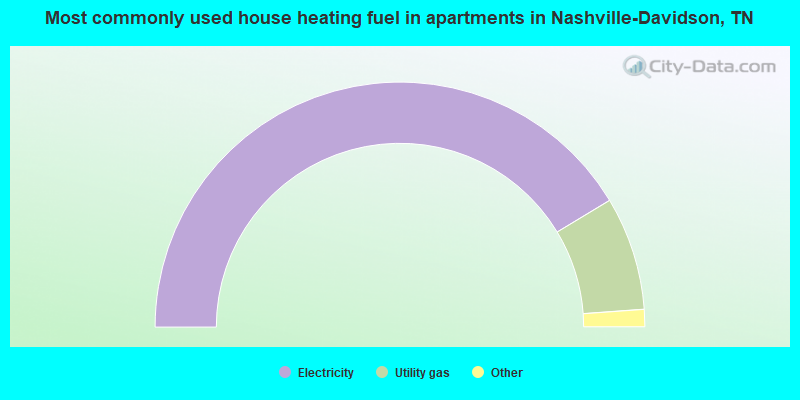
House heating fuel used in apartments - Utility gas (%)
House heating fuel used in apartments - Bottled, tank, or LP gas (%)
House heating fuel used in apartments - Electricity (%)
House heating fuel used in apartments - Fuel oil, kerosene, etc. (%)
House heating fuel used in apartments - Coal or coke (%)
House heating fuel used in apartments - Wood (%)
House heating fuel used in apartments - Solar energy (%)
House heating fuel used in apartments - Other fuel (%)
House heating fuel used in apartments - No fuel used (%)
Latest news about housing in Nashville-Davidson, TN collected exclusively by city-data.com from local newspapers, TV, and radio stations
Median year house/condo built: 1986Median year apartment built: 1989Household type by relationship:
Households: 683,639
Male householders: 151,191 (57,098 living alone ), Female householders: 166,626 (63,780 living alone )108,609 spouses (107,002 opposite-sex spouses ), 28,820 unmarried partners , (25,996 opposite-sex unmarried partners ), 146,230 children (138,272 natural , 4,350 adopted , 3,608 stepchildren ), 13,425 grandchildren , 7,551 brothers or sisters , 5,978 parents , 743 foster children , 11,374 other relatives , 22,413 non-relatives In group quarters: 20,679
Size of family households: 75,387 2-persons , 35,510 3-persons , 26,127 4-persons , 13,438 5-persons , 4,452 6-persons , 3,632 7-or-more-persons .
Size of nonfamily households: 120,878 1-person , 31,429 2-persons , 5,101 3-persons , 1,033 4-persons , 495 5-persons , 335 6-persons .
72,796 married couples with children. single-parent households (7,604 men , 34,509 women ).
83.3% of residents of Nashville-Davidson speak English at home. of residents speak Spanish at home (32% speak English very well , 26% speak English well , 30% speak English not well , 12% don't speak English at all ).of residents speak other Indo-European language at home (67% speak English very well , 22% speak English well , 10% speak English not well , 1% don't speak English at all ).of residents speak Asian or Pacific Island language at home (51% speak English very well , 32% speak English well , 15% speak English not well , 2% don't speak English at all ).of residents speak other language at home (51% speak English very well , 25% speak English well , 23% speak English not well , 1% don't speak English at all ).
Foreign born population: 88,530 (12.9%)of them are naturalized citizens )
Median number of rooms in houses and condos:
Median number of rooms in apartments
Owner-occupied Renter-occupied
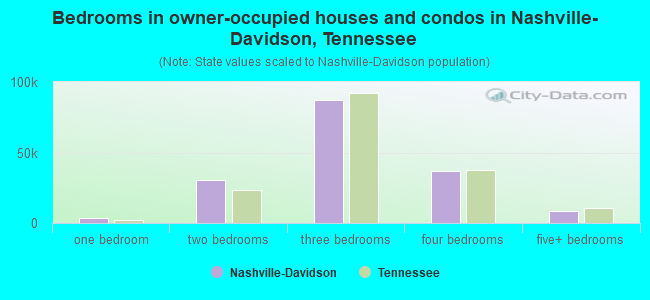
Bedrooms in owner-occupied houses and condos in Nashville-Davidson, Tennessee
686 no bedroom 3,267 1 bedroom 30,201 2 bedrooms 87,094 3 bedrooms 36,912 4 bedrooms 8,372 5+ bedrooms
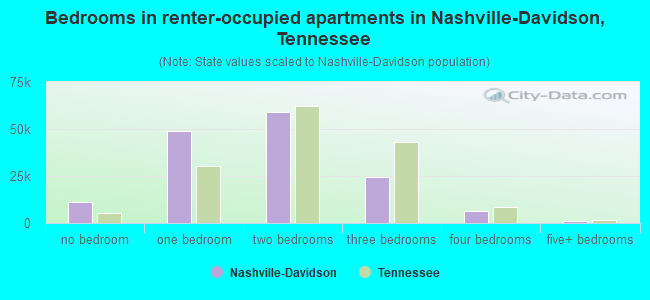
Bedrooms in renter-occupied apartments in Nashville-Davidson, Tennessee
11,076 no bedroom 49,022 1 bedroom 59,144 2 bedrooms 24,327 3 bedrooms 6,534 4 bedrooms 1,182 5+ bedrooms
Owner-occupied Renter-occupied
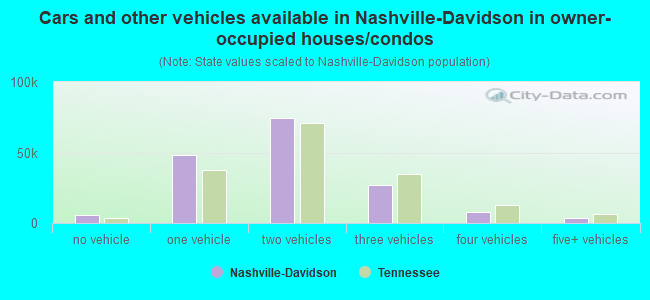
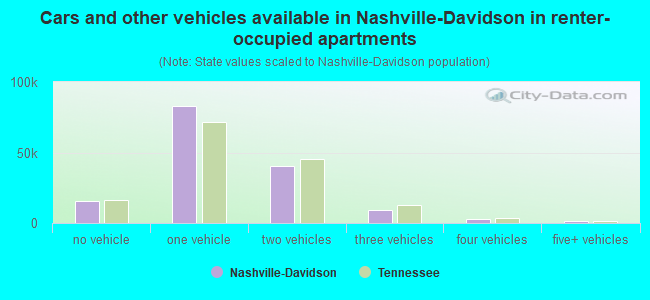
Cars and other vehicles available in Nashville-Davidson in owner-occupied houses/condos
5,878 no vehicle 48,418 1 vehicle 74,117 2 vehicles 27,126 3 vehicles 7,690 4 vehicles 3,303 5+ vehicles
Cars and other vehicles available in Nashville-Davidson in renter-occupied apartments
15,267 no vehicle 82,943 1 vehicle 40,081 2 vehicles 9,007 3 vehicles 2,912 4 vehicles 1,075 5+ vehicles
Owner-occupied Renter-occupied
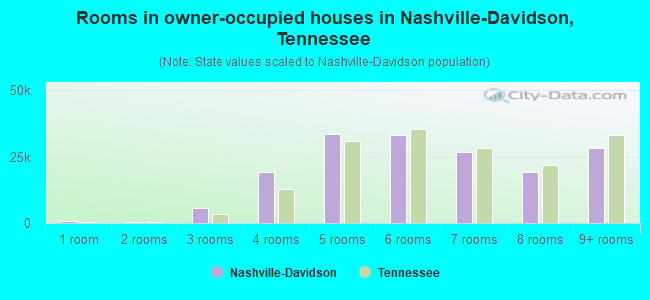
Rooms in owner-occupied houses in Nashville-Davidson, Tennessee
686 1 room 364 2 rooms 5,589 3 rooms 19,119 4 rooms 33,590 5 rooms 33,007 6 rooms 26,656 7 rooms 19,315 8 rooms 28,206 9+ rooms
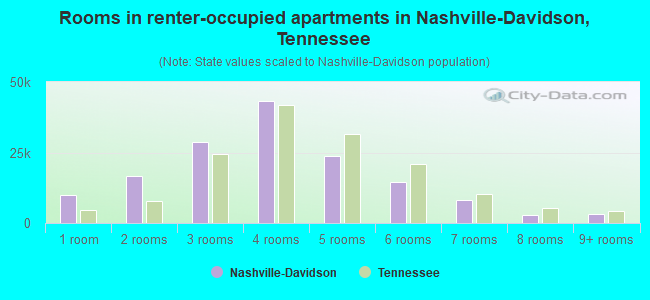
Rooms in renter-occupied apartments in Nashville-Davidson, Tennessee
9,817 1 room 16,811 2 rooms 28,578 3 rooms 43,435 4 rooms 23,594 5 rooms 14,593 6 rooms 8,222 7 rooms 2,880 8 rooms 3,355 9+ rooms
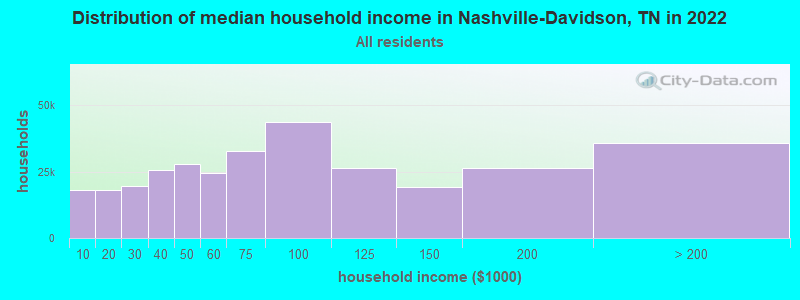
Nashville-Davidson, TN household income distribution 18,186 Less than $10,00018,111 $10,000 to $19,99919,710 $20,000 to $29,99925,564 $30,000 to $39,99927,710 $40,000 to $49,99924,328 $50,000 to $59,99932,655 $60,000 to $74,99943,610 $75,000 to $99,99926,336 $100,000 to $124,99919,289 $125,000 to $149,99926,422 $150,000 to $199,99935,896 $200,000 or more
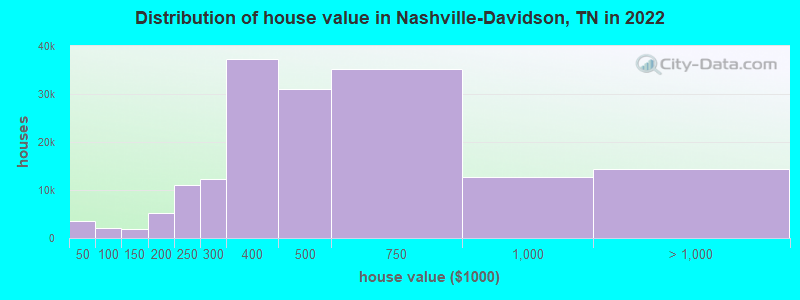
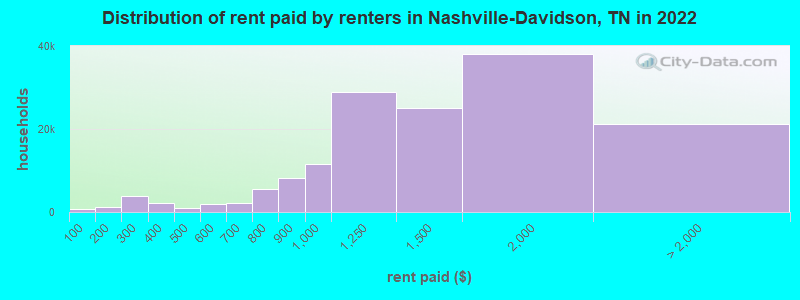
Home value of owner - occupied houses in 2022 in Nashville-Davidson, TN 1,034 Less than $10,000498 $10,000 to $14,999534 $15,000 to $19,99955 $20,000 to $24,999309 $25,000 to $29,999505 $30,000 to $34,999412 $35,000 to $39,999289 $40,000 to $49,999330 $50,000 to $59,999544 $60,000 to $69,999733 $70,000 to $79,999228 $80,000 to $89,99955 $90,000 to $99,9991,335 $100,000 to $124,999617 $125,000 to $149,9993,043 $150,000 to $174,9992,154 $175,000 to $199,99911,002 $200,000 to $249,99912,361 $250,000 to $299,99937,194 $300,000 to $399,99930,979 $400,000 to $499,99935,209 $500,000 to $749,99912,682 $750,000 to $999,9998,344 $1,000,000 to $1,499,9992,445 $1,500,000 to $1,999,9993,641 $2,000,000 or moreRent paid by renters in 2022 in Nashville-Davidson, TN 755 Less than $100846 $100 to $149347 $150 to $1992,987 $200 to $249958 $250 to $2991,534 $300 to $349671 $350 to $399593 $400 to $449292 $450 to $4991,127 $500 to $549725 $550 to $5991,197 $600 to $6491,023 $650 to $6993,027 $700 to $7492,501 $750 to $7998,142 $800 to $89911,453 $900 to $99928,959 $1,000 to $1,24924,983 $1,250 to $1,49937,985 $1,500 to $1,9999,448 $2,000 to $2,4993,258 $2,500 to $2,9991,751 $3,000 to $3,4992,319 $3,500 or more4,404 No cash rent
Percentage of workers working in this county: 84.6%Number of people working at home: 85,001 (22.0% of all workers )
Travel time to work (commute)
Less than 5 minutes: 7,4825 to 9 minutes: 21,15210 to 14 minutes: 36,95715 to 19 minutes: 50,90120 to 24 minutes: 53,70225 to 29 minutes: 31,28930 to 34 minutes: 49,02235 to 39 minutes: 10,74840 to 44 minutes: 7,90745 to 59 minutes: 21,00460 to 89 minutes: 7,68090 or more minutes: 3,461
Means of transportation to work:
Drove a car alone: 357,089 (72.0%)Carpooled: 32,279 (6.5%)Bus : 5,734 (1.2%)Long-distance train or commuter rail : 388 (0.1%)Light rail, streetcar or trolley : 102 (0.0%)Taxi: 6,075 (1.2%)Bicycle: 1,688 (0.3%)Walked: 7,369 (1.5%)Worked at home: 85,001 (17.1%)
Unemployment by race in 2022
Unemployment rate for White non-Hispanic residents 1.6% Males2.0% FemalesUnemployment rate for Black residents 8.7% Males6.6% FemalesUnemployment rate for American Indian and Alaska Native residents 0.9% FemalesUnemployment rate for Asian residents 1.0% Males3.7% FemalesUnemployment rate for other race residents 2.0% Males9.5% FemalesUnemployment rate for two or more race residents 3.5% Males5.1% FemalesUnemployment rate for Hispanic or Latino residents 2.9% Males2.4% Females
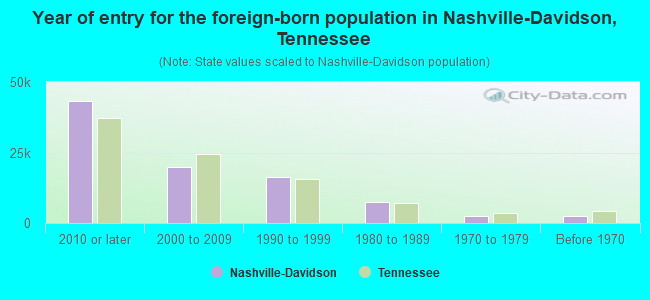
Year of entry for the foreign-born population in Nashville-Davidson, Tennessee
43,259 2010 or later 19,969 2000 to 2009 16,297 1990 to 1999 7,566 1980 to 1989 2,602 1970 to 1979 2,418 Before 1970
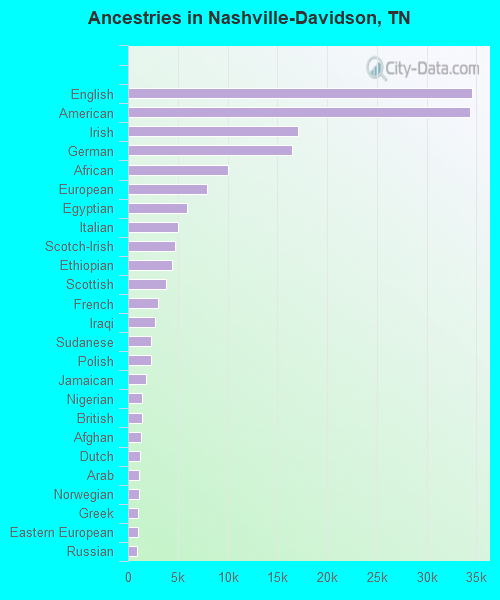
First ancestries reported:
English: 34,548 (8.9%)
American: 34,390 (8.9%)
Irish: 17,130 (4.4%)
German: 16,489 (4.3%)
African: 10,083 (2.6%)
European: 7,967 (2.1%)
Egyptian: 5,889 (1.5%)
Italian: 5,072 (1.3%)
Scotch-Irish: 4,759 (1.2%)
Ethiopian: 4,409 (1.1%)
Scottish: 3,778 (1.0%)
French: 3,009 (0.8%)
Iraqi: 2,721 (0.7%)
Sudanese: 2,319 (0.6%)
Polish: 2,308 (0.6%)
Jamaican: 1,837 (0.5%)
Nigerian: 1,427 (0.4%)
British: 1,418 (0.4%)
Afghan: 1,324 (0.3%)
Dutch: 1,242 (0.3%)
Arab: 1,097 (0.3%)
Norwegian: 1,080 (0.3%)
Greek: 1,050 (0.3%)
Eastern European: 1,036 (0.3%)
Russian: 935 (0.2%)
Haitian: 800 (0.2%)
Scandinavian: 789 (0.2%)
Swedish: 747 (0.2%)
French Canadian: 715 (0.2%)
Somali: 698 (0.2%)
Welsh: 604 (0.2%)
Iranian: 509 (0.1%)
Kenyan: 493 (0.1%)
Palestinian: 436 (0.1%)
Canadian: 400 (0.1%)
Albanian: 396 (0.1%)
Portuguese: 355 (0.09%)
Danish: 350 (0.09%)
Swiss: 349 (0.09%)
Yugoslavian: 337 (0.09%)
Ghanaian: 311 (0.08%)
Turkish: 309 (0.08%)
Ukrainian: 299 (0.08%)
British West Indian: 276 (0.07%)
Armenian: 268 (0.07%)
Northern European: 263 (0.07%)
Moroccan: 257 (0.07%)
Czech: 253 (0.07%)
Guyanese: 235 (0.06%)
Syrian: 229 (0.06%)
Trinidadian and Tobagonian: 228 (0.06%)
Croatian: 225 (0.06%)
Romanian: 222 (0.06%)
Lithuanian: 219 (0.06%)
West Indian: 201 (0.05%)
Austrian: 196 (0.05%)
Lebanese: 192 (0.05%)
Australian: 191 (0.05%)
Hungarian: 165 (0.04%)
Senegalese: 158 (0.04%)
Brazilian: 157 (0.04%)
Ugandan: 152 (0.04%)
Belizean: 140 (0.04%)
Liberian: 122 (0.03%)
Slovak: 119 (0.03%)
Serbian: 111 (0.03%)
Finnish: 95 (0.02%)
Bulgarian: 94 (0.02%)
South African: 87 (0.02%)
Slovene: 82 (0.02%)
U.S. Virgin Islander: 75 (0.02%)
Belgian: 71 (0.02%)
Israeli: 63 (0.02%)
Cajun: 57 (0.01%)
Czechoslovakian: 51 (0.01%)
Jordanian: 45 (0.01%)
Zimbabwean: 41 (0.01%)
Latvian: 32 (0.01%)
New Zealander: 31 (0.01%)
Bahamian: 31 (0.01%)
German Russian: 21 (0.01%)
Slavic: 20 (0.01%)
Most common places of birth for foreign-born residents (%): Mexico Nashville-Davidson:
17.1% (16,693)Tennessee:
23.0% (86,435)
Egypt Nashville-Davidson:
8.7% (8,508)Tennessee:
3.1% (11,761)
Honduras Nashville-Davidson:
8.4% (8,233)Tennessee:
4.6% (17,433)
Guatemala Nashville-Davidson:
5.5% (5,415)Tennessee:
5.7% (21,286)
Ethiopia Nashville-Davidson:
3.7% (3,641)Tennessee:
1.4% (5,265)
El Salvador Nashville-Davidson:
3.5% (3,455)Tennessee:
2.7% (10,313)
Iraq Nashville-Davidson:
3.3% (3,185)Tennessee:
2.0% (7,701)
China, excluding Hong Kong and Taiwan Nashville-Davidson:
3.0% (2,916)Tennessee:
3.3% (12,582)
India Nashville-Davidson:
2.7% (2,674)Tennessee:
6.1% (23,079)
Burma (Myanmar) Nashville-Davidson:
2.6% (2,502)Tennessee:
0.7% (2,485)
Canada Nashville-Davidson:
2.4% (2,348)Tennessee:
2.7% (10,295)
Korea Nashville-Davidson:
2.0% (1,973)Tennessee:
2.3% (8,490)
Afghanistan Nashville-Davidson:
1.6% (1,558)Tennessee:
0.3% (1,254)
Nigeria Nashville-Davidson:
1.6% (1,550)Tennessee:
1.2% (4,662)
Cuba Nashville-Davidson:
1.6% (1,518)Tennessee:
1.3% (4,841)
Vietnam Nashville-Davidson:
1.5% (1,492)Tennessee:
2.4% (8,894)
Place of birth for U.S.-born residents:
This state: 307,573Other state: 278,391Northeast: 38,883Midwest: 77,478South: 125,957West: 36,073 80.6% of Nashville-Davidson residents lived in the same house 1 years ago.
Out of people who lived in different houses, 36.3% lived in this county.
Out of people who lived in different counties, 27.7% lived in Tennessee.
Nashville-Davidson:
80.6%State average:
87.0%
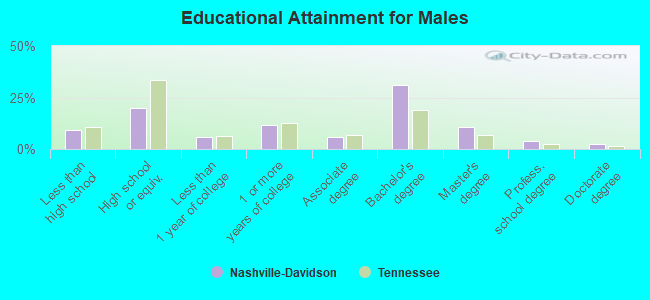
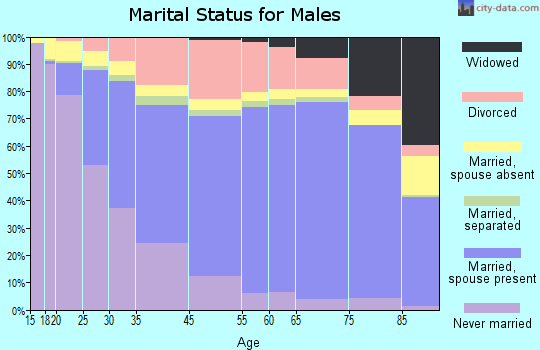
Education attainment for males 25 years and older:
No schooling: 4,539Nursery to 4th grade: 6005th and 6th grade: 2,1707th and 8th grade: 1,2229th grade: 2,62310th grade: 1,10311th grade: 3,78712th grade, no diploma: 5,789High school graduate (or equivalency): 45,665Less than 1 year of college: 13,736Some college more than 1 year, no degree: 26,705Associate degree: 13,301Bachelor's degree: 71,607Master's degree: 24,806Professional school degree: 9,132Doctorate degree: 5,308
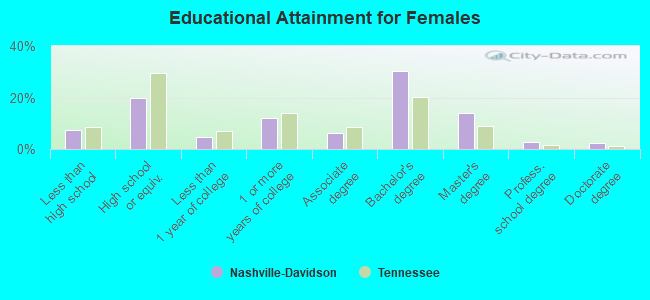
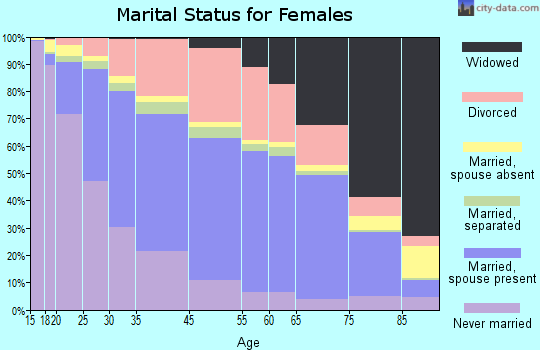
Education attainment for females 25 years and older:
No schooling: 3,142Nursery to 4th grade: 9755th and 6th grade: 2,1957th and 8th grade: 1,3289th grade: 2,10010th grade: 1,40111th grade: 1,79912th grade, no diploma: 5,996High school graduate (or equivalency): 50,238Less than 1 year of college: 11,807Some college more than 1 year, no degree: 30,327Associate degree: 15,345Bachelor's degree: 76,332Master's degree: 35,492Professional school degree: 7,024Doctorate degree: 5,851
Housing units in structures:
One, detached: 173,636One, attached: 33,290Two: 11,2073 or 4: 10,6335 to 9: 22,14410 to 19: 24,09520 to 49: 22,44350 or more: 47,090Mobile homes: 2,588Boats, RVs, vans, etc.: 568Median worth of mobile homes: $69,200
Housing units lacking complete plumbing facilities in 2022: 0.3%Housing units lacking complete kitchen facilities in 2022: 1.4%House/condo owner moved in on average 9 years ago
Renter moved in on average 2 years ago
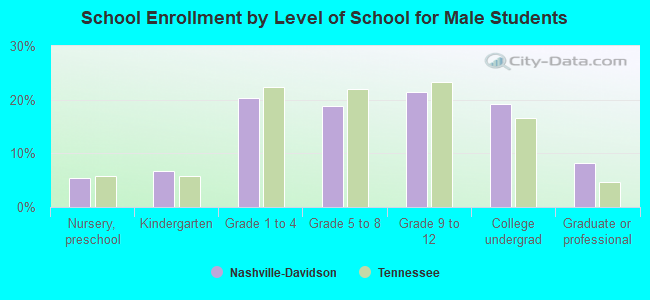
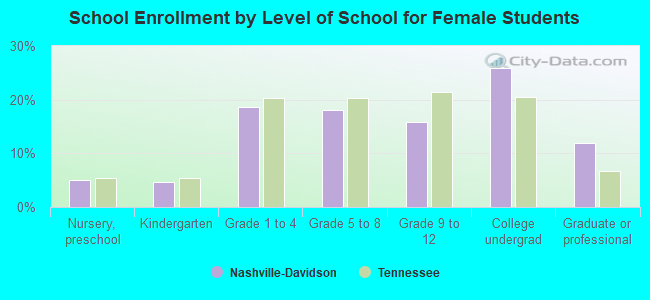
Private vs. public school enrollment:
Students in private schools in grades 1 to 8 (elementary and middle school): 16,910 Here:
31.0%Tennessee:
15.0%
Students in private schools in grades 9 to 12 (high school): 4,964 Here:
18.6%Tennessee:
16.2%
Students in private undergraduate colleges: 17,505 Here:
53.6%Tennessee:
23.5%