New Hope, TN (Tennessee) Houses and Residents
| New Hope: | $165,285 |
| Tennessee: | $284,800 |
Mean price in 2022:
Detached houses: $246,526
Here: $246,526 State: $374,382 Mobile homes: $94,761
Here: $94,761 State: $101,421
Total population: 1,070 (Urban population: 0, Rural population: 1,043 (12 farm, 1,031 nonfarm))
Houses: 410 (380 occupied: 330 owner occupied, 56 renter occupied)
| % of renters here: | 15% |
| State: | 33% |
Housing density: 40 houses/condos per square mile
Median price asked for vacant for-sale houses and condos in 2022 in this county: $176,029.
Median gross rent in New Hope, TN in 2022: $994
Housing units in New Hope with a mortgage: 129 (7 second mortgage, 0 home equity loan, 4 both second mortgage and home equity loan)
Houses without a mortgage: 0
Median household income for houses/condos with a mortgage: $74,099
Median household income for apartments without a mortgage: $34,473
Median monthly housing costs: $582
Compare current foreclosures near New Hope, TN:
| Photo | Address | Area | Beds / Baths | Price | Details |
|---|---|---|---|---|---|

|
#1
Sweetens Cove Rd
South Pittsburg, TN 37380
|
1,650 sq. feet
|
2 baths 2 beds |
show details | |

|
#2
Hass Rd
Jasper, TN 37347
|
1,680 sq. feet
|
2 baths 3 beds |
show details | |

|
#3
Creek Rd
Wildwood, GA 30757
|
1,560 sq. feet
|
2 baths 3 beds |
show details | |

|
#4
Shellmound Rd
Jasper, TN 37347
|
1,107 sq. feet
|
1 baths - beds |
show details | |

|
#5
County Road 96
Stevenson, AL 35772
|
2,439 sq. feet
|
1 baths 3 beds |
show details | |

|
#6
Gail Ln
Jasper, TN 37347
|
900 sq. feet
|
2 baths - beds |
show details | |

|
#7
Bernice Dr
Trenton, GA 30752
|
1,270 sq. feet
|
2 baths - beds |
show details | |

|
#8
Pryor Cove Rd
Jasper, TN 37347
|
1,392 sq. feet
|
2 baths - beds |
show details | |

|
#9
Bernice Dr
Trenton, GA 30752
|
1,352 sq. feet
|
2 baths - beds |
show details | |

|
#10
Chicken Dave Rd
Whitwell, TN 37397
|
1,722 sq. feet
|
1 baths - beds |
show details |
| Photo | Address | Area | Beds / Baths | Price | Details |
|---|---|---|---|---|---|

|
#11
Highland Ave
Jasper, TN 37347
|
864 sq. feet
|
1 baths - beds |
show details | |

|
#12
Tony Rd
Trenton, GA 30752
|
- sq. feet
|
1 baths 3 beds |
show details | |

|
#13
Riverbend Dr
Jasper, TN 37347
|
2,856 sq. feet
|
2 baths - beds |
show details | |

|
#14
Belree Rd
Wildwood, GA 30757
|
2,036 sq. feet
|
2 baths - beds |
show details | |

|
#15
Prater Rd
Trenton, GA 30752
|
1,248 sq. feet
|
1 baths - beds |
show details | |

|
#16
Alabama Ave
Bridgeport, AL 35740
|
1,392 sq. feet
|
2 baths - beds |
show details | |

|
#17
Glendale Ct
Trenton, GA 30752
|
2,011 sq. feet
|
2 baths - beds |
show details | |

|
#18
Gold Rd
Jasper, TN 37347
|
1,100 sq. feet
|
1 baths - beds |
show details | |

|
#19
S Pittsburg Mountain Rd
South Pittsburg, TN 37380
|
1,008 sq. feet
|
1 baths - beds |
show details | |

|
#20
Foster Falls Rd
Sequatchie, TN 37374
|
1,176 sq. feet
|
2 baths - beds |
show details |
| Photo | Address | Area | Beds / Baths | Price | Details |
|---|---|---|---|---|---|

|
#21
Francis Spring Rd
Jasper, TN 37347
|
1,456 sq. feet
|
2 baths - beds |
show details | |

|
#22
Bolton Rd
Trenton, GA 30752
|
3,760 sq. feet
|
1 baths - beds |
show details | |

|
#23
Scratch Ankle Rd
Trenton, GA 30752
|
- sq. feet
|
1 baths 2 beds |
show details | |

|
#24
Poplar Ave
Trenton, GA 30752
|
1,416 sq. feet
|
1 baths - beds |
show details | |

|
#25
Sequatchie Mountain Rd
Sequatchie, TN 37374
|
1,068 sq. feet
|
2 baths - beds |
show details | |

|
#26
Highway 301
Trenton, GA 30752
|
1,178 sq. feet
|
1 baths - beds |
show details | |

|
#27
Vineyard Point Rd
Sequatchie, TN 37374
|
1,144 sq. feet
|
1 baths - beds |
show details | |

|
#28
Sweetens Cove Rd
South Pittsburg, TN 37380
|
1,960 sq. feet
|
1 baths - beds |
show details | |

|
#29
Highway 150
Sequatchie, TN 37374
|
1,344 sq. feet
|
1 baths - beds |
show details | |

|
#30
N Case Ave
Trenton, GA 30752
|
1,320 sq. feet
|
2 baths - beds |
show details |
| Photo | Address | Area | Beds / Baths | Price | Details |
|---|---|---|---|---|---|

|
#31
N Main St
Trenton, GA 30752
|
1,594 sq. feet
|
1 baths - beds |
show details | |

|
#32
Francis Spring Rd
Whitwell, TN 37397
|
1,204 sq. feet
|
1 baths - beds |
show details | |

|
#33
Connecticut Ave
Trenton, GA 30752
|
1,175 sq. feet
|
1 baths - beds |
show details | |

|
#34
Pleasant Grove Rd
Jasper, TN 37347
|
1,025 sq. feet
|
1 baths - beds |
show details | |

|
#35
Woodmont Dr
Whitwell, TN 37397
|
1,144 sq. feet
|
1 baths - beds |
show details | |

|
#36
E Georgia Ave
Whitwell, TN 37397
|
1,923 sq. feet
|
1 baths - beds |
show details | |

|
#37
Highway 157
Lookout Mountain, GA 30750
|
1,466 sq. feet
|
2 baths - beds |
show details | |

|
#38
Marion Ave
South Pittsburg, TN 37380
|
1,768 sq. feet
|
1 baths - beds |
show details | |

|
#39
W Kansas Ave
Whitwell, TN 37397
|
1,380 sq. feet
|
1 baths - beds |
show details | |

|
#40
Industrial Blvd
Jasper, TN 37347
|
1,304 sq. feet
|
1 baths - beds |
show details |
| Photo | Address | Area | Beds / Baths | Price | Details |
|---|---|---|---|---|---|

|
#41
Nickajack Cir
Jasper, TN 37347
|
1,224 sq. feet
|
2 baths - beds |
show details | |

|
#42
Kelly St
Whitwell, TN 37397
|
1,004 sq. feet
|
1 baths - beds |
show details | |

|
#43
View St
Jasper, TN 37347
|
3,281 sq. feet
|
1 baths - beds |
show details | |

|
#44
Main St
Jasper, TN 37347
|
1,073 sq. feet
|
1 baths - beds |
show details | |

|
#45
S Pittsburg Mountain Rd
Sewanee, TN 37375
|
2,576 sq. feet
|
2 baths - beds |
show details | |

|
#46
Laurel Ave
South Pittsburg, TN 37380
|
1,645 sq. feet
|
1 baths - beds |
show details | |

|
#47
Lula Lake Rd
Lookout Mountain, GA 30750
|
1,430 sq. feet
|
1 baths - beds |
show details | |

|
#48
Patton School Rd
South Pittsburg, TN 37380
|
1,056 sq. feet
|
2 baths - beds |
show details | |

|
#49
Laurel Ave
South Pittsburg, TN 37380
|
1,025 sq. feet
|
1 baths - beds |
show details | |

|
Check over 1 million property listings on Foreclosure.com!
|
browse all offers | |||


Median year apartment built: 2002
Household type by relationship:
Households: 854- Male householders: 214 (51 living alone), Female householders: 160 (61 living alone)
183 spouses (183 opposite-sex spouses), 21 unmarried partners, (21 opposite-sex unmarried partners), 168 children (168 natural, 0 adopted, 0 stepchildren), 66 grandchildren, 3 brothers or sisters, 5 parents, 0 foster children, 3 other relatives, 28 non-relatives
Size of family households: 125 2-persons, 35 3-persons, 34 4-persons, 39 5-persons, 6 6-persons.
Size of nonfamily households: 115 1-person, 26 2-persons, 5 3-persons.
34 married couples with children.
55 single-parent households (38 men, 17 women).
100.1% of residents of New Hope speak English at home.
| Here: | 6.2 |
| State: | 6.5 |
| Here: | 5.1 |
| State: | 4.4 |

- Bedrooms in owner-occupied houses and condos in New Hope, Tennessee
- 8no bedroom
- 01 bedroom
- 512 bedrooms
- 2063 bedrooms
- 264 bedrooms
- 395+ bedrooms

- Bedrooms in renter-occupied apartments in New Hope, Tennessee
- 0no bedroom
- 41 bedroom
- 152 bedrooms
- 283 bedrooms
- 94 bedrooms
- 05+ bedrooms

- Cars and other vehicles available in New Hope in owner-occupied houses/condos
- 7no vehicle
- 481 vehicle
- 1252 vehicles
- 993 vehicles
- 234 vehicles
- 285+ vehicles

- Cars and other vehicles available in New Hope in renter-occupied apartments
- 0no vehicle
- 181 vehicle
- 262 vehicles
- 93 vehicles
- 04 vehicles
- 35+ vehicles

- Rooms in owner-occupied houses in New Hope, Tennessee
- 81 room
- 02 rooms
- 03 rooms
- 554 rooms
- 575 rooms
- 696 rooms
- 597 rooms
- 218 rooms
- 629+ rooms

- Rooms in renter-occupied apartments in New Hope, Tennessee
- 01 room
- 42 rooms
- 33 rooms
- 44 rooms
- 255 rooms
- 86 rooms
- 27 rooms
- 08 rooms
- 99+ rooms


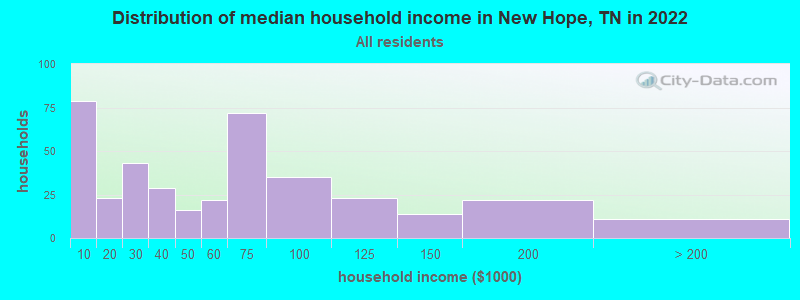
New Hope, TN household income distribution

- 79Less than $10,000
- 23$10,000 to $19,999
- 43$20,000 to $29,999
- 29$30,000 to $39,999
- 16$40,000 to $49,999
- 22$50,000 to $59,999
- 72$60,000 to $74,999
- 35$75,000 to $99,999
- 23$100,000 to $124,999
- 14$125,000 to $149,999
- 22$150,000 to $199,999
- 11$200,000 or more
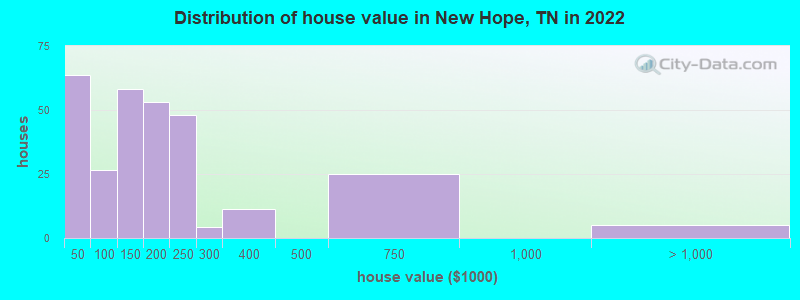
Home value of owner - occupied houses in 2022 in New Hope, TN
-
- 30$20,000 to $24,999
- 6$25,000 to $29,999
- 5$30,000 to $34,999
- 12$35,000 to $39,999
- 8$40,000 to $49,999
- 4$50,000 to $59,999
- 2$60,000 to $69,999
- 7$70,000 to $79,999
- 2$90,000 to $99,999
- 52$100,000 to $124,999
- 5$125,000 to $149,999
- 20$150,000 to $174,999
- 32$175,000 to $199,999
- 47$200,000 to $249,999
- 4$250,000 to $299,999
- 11$300,000 to $399,999
- 24$500,000 to $749,999
- 4$2,000,000 or more
Rent paid by renters in 2022 in New Hope, TN
-
- 2$450 to $499
- 3$500 to $549
- 3$550 to $599
- 1$650 to $699
- 3$800 to $899
- 12$2,000 to $2,499
- 30No cash rent


Percentage of workers working in this county: 71.2%
Number of people working at home: 41 (10.6% of all workers)
Travel time to work (commute)
- Less than 5 minutes: 4
- 5 to 9 minutes: 8
- 10 to 14 minutes: 115
- 15 to 19 minutes: 77
- 20 to 24 minutes: 25
- 25 to 29 minutes: 1
- 30 to 34 minutes: 13
- 35 to 39 minutes: 50
- 40 to 44 minutes: 11
- 45 to 59 minutes: 20
- 60 to 89 minutes: 6
- 90 or more minutes: 4
Means of transportation to work:
- Drove a car alone: 385 (83.9%)
- Carpooled: 59 (12.9%)
- Walked: 2 (0.4%)
- Other means: 3 (0.7%)
- Worked at home: 10 (2.2%)

- Unemployment by race in 2022
- Unemployment rate for White non-Hispanic residents
- 1.5%Males
- 11.1%Females

- Year of entry for the foreign-born population in New Hope, Tennessee
- 01995 to March 2000
- 01990 to 1994
- 01985 to 1989
- 01980 to 1984
- 01975 to 1979
- 21970 to 1974
- 01965 to 1969
- 0Before 1965

First ancestries reported:
- English: 176 (46.5%)
- American: 106 (28.0%)
- Irish: 28 (7.4%)
- German: 23 (6.1%)
- Scotch-Irish: 11 (2.9%)
- Scottish: 10 (2.6%)
- Italian: 4 (1.1%)
- Polish: 4 (1.1%)
- British: 2 (0.5%)
- Celtic: 2 (0.5%)
Most common places of birth for foreign-born residents (%):
| New Hope: | 100.0% (2) |
| Tennessee: | 3.8% (6,106) |
Place of birth for U.S.-born residents:
- This state: 530
- Other state: 319
- Northeast: 14
- Midwest: 58
- South: 233
- West: 10
91.7% of New Hope residents lived in the same house 1 years ago.
Out of people who lived in different houses, 36.9% lived in this county.
Out of people who lived in different counties, 100.0% lived in Tennessee.
| New Hope: | 91.7% |
| State average: | 87.0% |
Education attainment for males 25 years and older:
- No schooling: 2
- Nursery to 4th grade: 0
- 5th and 6th grade: 3
- 7th and 8th grade: 4
- 9th grade: 5
- 10th grade: 13
- 11th grade: 15
- 12th grade, no diploma: 8
- High school graduate (or equivalency): 81
- Less than 1 year of college: 36
- Some college more than 1 year, no degree: 29
- Associate degree: 75
- Bachelor's degree: 11
- Master's degree: 0
- Professional school degree: 1
- Doctorate degree: 0

Education attainment for females 25 years and older:
- No schooling: 0
- Nursery to 4th grade: 0
- 5th and 6th grade: 0
- 7th and 8th grade: 5
- 9th grade: 11
- 10th grade: 11
- 11th grade: 6
- 12th grade, no diploma: 6
- High school graduate (or equivalency): 73
- Less than 1 year of college: 42
- Some college more than 1 year, no degree: 120
- Associate degree: 36
- Bachelor's degree: 22
- Master's degree: 4
- Professional school degree: 0
- Doctorate degree: 0


Housing units in structures:
- One, detached: 284
- Two: 3
- Mobile homes: 118
- Boats, RVs, vans, etc.: 4
Median worth of mobile homes: $41,845
Housing units lacking complete kitchen facilities in 2022: 2.5%
House/condo owner moved in on average 11 years ago
Renter moved in on average 8 years ago

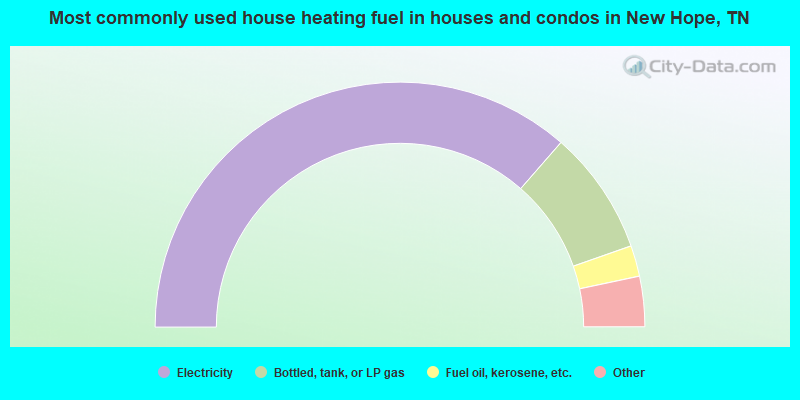
- 73.3%Electricity
- 16.5%Bottled, tank, or LP gas
- 4.1%Fuel oil, kerosene, etc.
- 3.5%Utility gas
- 2.5%Wood
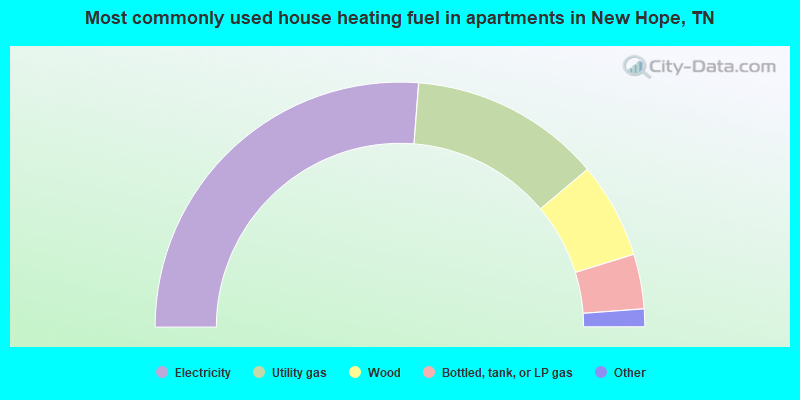
- 53.7%Electricity
- 25.9%Utility gas
- 13.0%Wood
- 7.4%Bottled, tank, or LP gas
Private vs. public school enrollment:
| Here: | 0.0% |
| Tennessee: | 15.0% |
| Here: | 0.0% |
| Tennessee: | 16.2% |
| Here: | 0.0% |
| Tennessee: | 23.5% |


