New Paltz, NY (New York) Houses and Residents
| New Paltz: | $388,764 |
| New York: | $400,400 |
Mean price in 2022:
Detached houses: $432,256
Here: $432,256 State: $476,719 Townhouses or other attached units: $380,465
Here: $380,465 State: $699,270 In 2-unit structures: $489,624
Here: $489,624 State: $713,077 In 3-to-4-unit structures: $141,714
Here: $141,714 State: $764,568 In 5-or-more-unit structures: $184,737
Here: $184,737 State: $912,009
Total population: 6,966 (Urban population: 5,983 (all inside urban clusters), Rural population: 54 (all nonfarm))
Houses: 2,376 (2,235 occupied: 672 owner occupied, 1,638 renter occupied)
| % of renters here: | 71% |
| State: | 46% |
Housing density: 1,371 houses/condos per square mile
Median price asked for vacant for-sale houses and condos in 2022 in this county: $213,181.
Median contract rent in 2022: $1,641 (lower quartile is $1,101, upper quartile is over $2,000)
Median rent asked for vacant for-rent units in 2022: $2,242
Median gross rent in New Paltz, NY in 2022: $1,867
Housing units in New Paltz with a mortgage: 392 (18 second mortgage, 0 home equity loan, 20 both second mortgage and home equity loan)
Houses without a mortgage: 0
Median household income for houses/condos with a mortgage: $101,863
Median household income for apartments without a mortgage: $103,012
Median monthly housing costs: $1,711
Compare current foreclosures near New Paltz, NY:
| Photo | Address | Area | Beds / Baths | Price | Details |
|---|---|---|---|---|---|

|
#1
Brunyswick
New Paltz, NY 12561
|
- sq. feet
|
1 baths 2 beds |
$104,900
|
show details |

|
#2
Wood Lot Rd
New Paltz, NY 12561
|
2,268 sq. feet
|
3 baths 3 beds |
show details | |

|
#3
Watch Hill Rd
New Paltz, NY 12561
|
1,729 sq. feet
|
2 baths 3 beds |
show details | |

|
#4
Hasbrouck Rd
New Paltz, NY 12561
|
1,812 sq. feet
|
2 baths 3 beds |
show details | |

|
#5
Orchard Knoll Ct
New Paltz, NY 12561
|
1,832 sq. feet
|
3 baths 3 beds |
show details | |

|
#6
Raymond Ln
New Paltz, NY 12561
|
1,537 sq. feet
|
2 baths 3 beds |
show details | |

|
#7
S Ohioville Rd
New Paltz, NY 12561
|
2,064 sq. feet
|
1 baths 4 beds |
show details | |

|
#8
N Ohioville Rd
New Paltz, NY 12561
|
1,387 sq. feet
|
1 baths 3 beds |
show details | |

|
#9
Floyd Ackert Rd
New Paltz, NY 12561
|
1,056 sq. feet
|
2 baths 3 beds |
show details | |

|
#10
Albany Post Rd
New Paltz, NY 12561
|
- sq. feet
|
- baths - beds |
show details |
| Photo | Address | Area | Beds / Baths | Price | Details |
|---|---|---|---|---|---|

|
#11
Meadowbrook Cir
New Paltz, NY 12561
|
- sq. feet
|
- baths - beds |
show details | |

|
#12
Old Kingston Rd
New Paltz, NY 12561
|
- sq. feet
|
- baths - beds |
show details | |

|
#13
Church St
Poughkeepsie, NY 12601
|
1,521 sq. feet
|
1 baths 4 beds |
$25,000
|
show details |

|
#14
Tinkertown Rd
Pleasant Valley, NY 12569
|
2,970 sq. feet
|
2 baths 3 beds |
$493,395
|
show details |

|
#15
James St
Rosendale, NY 12472
|
1,474 sq. feet
|
2 baths 4 beds |
$279,500
|
show details |

|
#16
Center Rd
High Falls, NY 12440
|
1,250 sq. feet
|
1 baths 2 beds |
$315,000
|
show details |

|
#17
Dorothy Hts
Wappingers Falls, NY 12590
|
1,113 sq. feet
|
1 baths 3 beds |
$389,900
|
show details |

|
#18
Penny Ln
Marlboro, NY 12542
|
2,514 sq. feet
|
2 baths 3 beds |
$299,900
|
show details |

|
#19
Lyons Ln
Milton, NY 12547
|
1,872 sq. feet
|
2 baths 3 beds |
$34,900
|
show details |

|
#20
Orchard St
Walden, NY 12586
|
1,236 sq. feet
|
1 baths 2 beds |
$89,900
|
show details |
| Photo | Address | Area | Beds / Baths | Price | Details |
|---|---|---|---|---|---|

|
#21
Cooper Rd
Fishkill, NY 12524
|
1,346 sq. feet
|
2 baths 2 beds |
show details | |

|
#22
Tow Path Rd
Accord, NY 12404
|
1,337 sq. feet
|
1 baths 2 beds |
show details | |

|
#23
Timber Ct
Highland, NY 12528
|
2,792 sq. feet
|
2 baths 3 beds |
show details | |

|
#24
Acorn Ct
Wappingers Falls, NY 12590
|
2,821 sq. feet
|
2 baths 4 beds |
show details | |

|
#25
Dogwood St
Kingston, NY 12401
|
1,751 sq. feet
|
2 baths 4 beds |
show details | |

|
#26
Route 376
Wappingers Falls, NY 12590
|
1,894 sq. feet
|
1 baths 3 beds |
show details | |

|
#27
Ramblewood Dr
Newburgh, NY 12550
|
1,274 sq. feet
|
2 baths 3 beds |
show details | |

|
#28
All Angels Hill Rd
Wappingers Falls, NY 12590
|
1,196 sq. feet
|
2 baths 3 beds |
show details | |

|
#29
Pine Hill Rd
Pleasant Valley, NY 12569
|
2,000 sq. feet
|
3 baths 3 beds |
show details | |

|
#30
Carmine Dr C-8
Wappingers Falls, NY 12590
|
1,064 sq. feet
|
2 baths 2 beds |
show details |
| Photo | Address | Area | Beds / Baths | Price | Details |
|---|---|---|---|---|---|

|
#31
Irish Cape Rd
Napanoch, NY 12458
|
1,128 sq. feet
|
1 baths 2 beds |
show details | |

|
#32
Cardinal Rd
Hyde Park, NY 12538
|
2,692 sq. feet
|
2 baths 3 beds |
show details | |

|
#33
Highland Ave
Kerhonkson, NY 12446
|
1,012 sq. feet
|
1 baths 3 beds |
show details | |

|
#34
Ashorkan Rd
Kingston, NY 12401
|
960 sq. feet
|
1 baths 3 beds |
show details | |

|
#35
S Quaker Ln
Hyde Park, NY 12538
|
1,300 sq. feet
|
2 baths 3 beds |
show details | |

|
#36
Summit Ave
Hurley, NY 12443
|
3,548 sq. feet
|
3 baths 4 beds |
show details | |

|
#37
Ferrara Dr
Rhinebeck, NY 12572
|
1,530 sq. feet
|
2 baths 3 beds |
show details | |

|
#38
Gray St
Poughkeepsie, NY 12603
|
2,880 sq. feet
|
2 baths 4 beds |
show details | |

|
#39
Route 209
Kerhonkson, NY 12446
|
1,200 sq. feet
|
1 baths 3 beds |
show details | |

|
#40
Mountain Rd
Shokan, NY 12481
|
1,272 sq. feet
|
1 baths 3 beds |
show details |
| Photo | Address | Area | Beds / Baths | Price | Details |
|---|---|---|---|---|---|

|
#41
N Elting Corners Rd
Highland, NY 12528
|
2,408 sq. feet
|
2 baths 4 beds |
show details | |

|
#42
Roe St
Newburgh, NY 12550
|
1,588 sq. feet
|
1 baths 3 beds |
show details | |

|
#43
Market St
Wappingers Falls, NY 12590
|
1,802 sq. feet
|
1 baths 4 beds |
show details | |

|
#44
Wileman Ave
Walden, NY 12586
|
1,152 sq. feet
|
2 baths 4 beds |
show details | |

|
#45
Donny Dr
Wappingers Falls, NY 12590
|
1,512 sq. feet
|
2 baths 3 beds |
show details | |

|
#46
Downs St
Kingston, NY 12401
|
1,176 sq. feet
|
1 baths 2 beds |
show details | |

|
#47
3rd Ave
Kingston, NY 12401
|
1,402 sq. feet
|
1 baths 2 beds |
show details | |

|
#48
Union Ave
Newburgh, NY 12550
|
1,152 sq. feet
|
1 baths 3 beds |
show details | |

|
#49
Ramblewood Dr
Newburgh, NY 12550
|
2,352 sq. feet
|
2 baths 4 beds |
show details | |

|
Check over 1 million property listings on Foreclosure.com!
|
browse all offers | |||


 | Rental communities or condo communties Upstate NY (58 replies) |
| New Paltz’s deputy mayor can’t find a place to live (13 replies) |
| Dream house but what's the neighborhood/school situation? (19 replies) |
| For those interested in state political issues (426 replies) |
| Why don't we have a Hudson Valley forum? (67 replies) |
| Inno has arrived in Albany. Here's what to expect... (104 replies) |

Median year apartment built: 1975
Household type by relationship:
Households: 7,739- Male householders: 999 (564 living alone), Female householders: 1,223 (393 living alone)
451 spouses (451 opposite-sex spouses), 307 unmarried partners, (307 opposite-sex unmarried partners), 553 children (545 natural, 0 adopted, 8 stepchildren), 111 grandchildren, 6 brothers or sisters, 76 parents, 0 foster children, 0 other relatives, 1,195 non-relatives
- In group quarters: 2,815
Size of family households: 472 2-persons, 114 3-persons, 88 4-persons, 10 5-persons, 8 6-persons, 21 7-or-more-persons.
Size of nonfamily households: 920 1-person, 460 2-persons, 182 3-persons, 44 5-persons, 54 6-persons, 64 7-or-more-persons.
183 married couples with children.
220 single-parent households (67 men, 153 women).
82.9% of residents of New Paltz speak English at home.
8.9% of residents speak Spanish at home (78% speak English very well, 19% speak English well, 3% speak English not well).
2.5% of residents speak other Indo-European language at home (88% speak English very well, 12% speak English well).
4.3% of residents speak Asian or Pacific Island language at home (63% speak English very well, 20% speak English well, 17% speak English not well).
0.7% of residents speak other language at home (100% speak English very well).
Foreign born population: 727 (9.4%)
(27.9% of them are naturalized citizens)
| Here: | 5.8 |
| State: | 6.3 |
| Here: | 3.5 |
| State: | 3.8 |
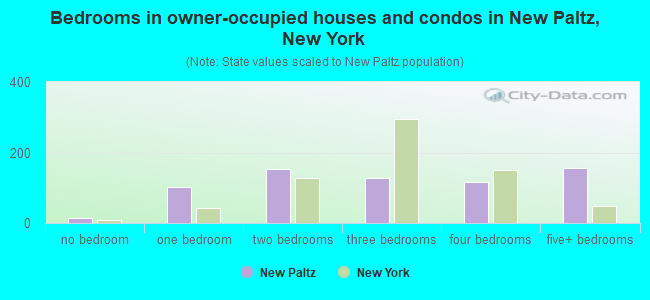
- Bedrooms in owner-occupied houses and condos in New Paltz, New York
- 14no bedroom
- 1031 bedroom
- 1542 bedrooms
- 1293 bedrooms
- 1154 bedrooms
- 1575+ bedrooms
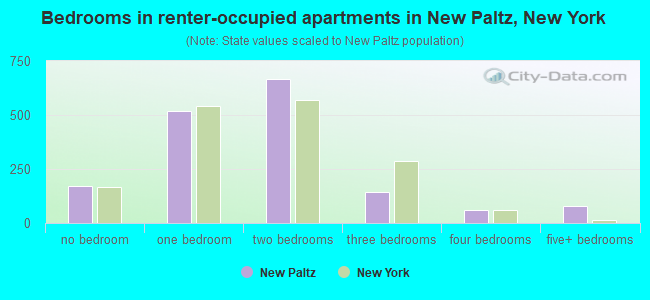
- Bedrooms in renter-occupied apartments in New Paltz, New York
- 169no bedroom
- 5171 bedroom
- 6682 bedrooms
- 1433 bedrooms
- 614 bedrooms
- 815+ bedrooms
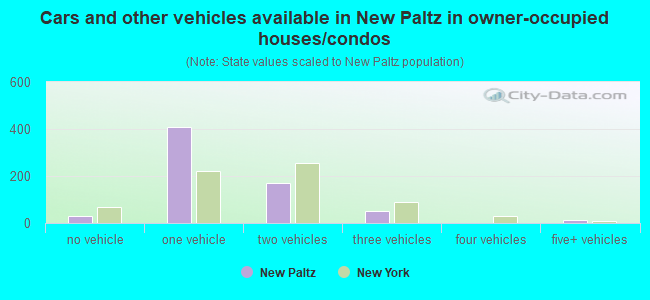
- Cars and other vehicles available in New Paltz in owner-occupied houses/condos
- 31no vehicle
- 4071 vehicle
- 1712 vehicles
- 513 vehicles
- 04 vehicles
- 125+ vehicles
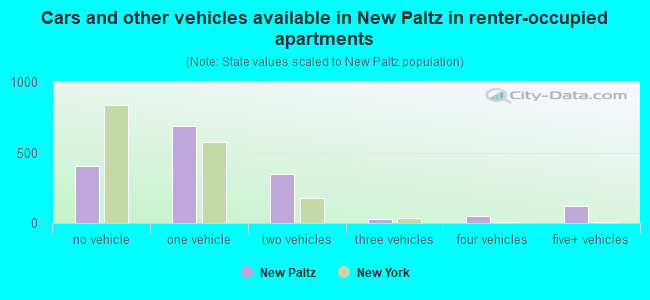
- Cars and other vehicles available in New Paltz in renter-occupied apartments
- 401no vehicle
- 6881 vehicle
- 3502 vehicles
- 283 vehicles
- 514 vehicles
- 1225+ vehicles
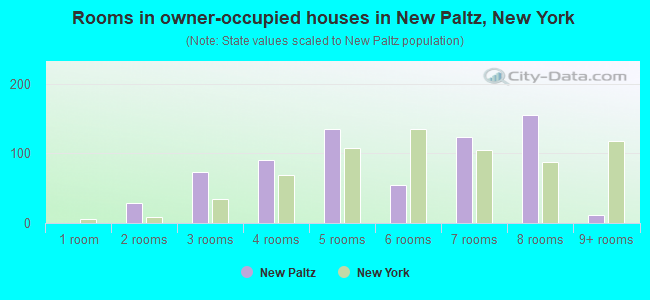
- Rooms in owner-occupied houses in New Paltz, New York
- 01 room
- 282 rooms
- 733 rooms
- 914 rooms
- 1355 rooms
- 556 rooms
- 1237 rooms
- 1558 rooms
- 129+ rooms
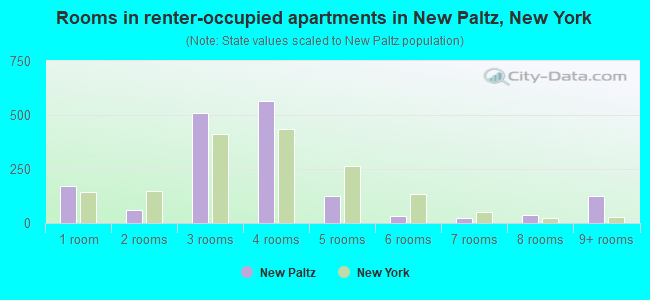
- Rooms in renter-occupied apartments in New Paltz, New York
- 1691 room
- 582 rooms
- 5093 rooms
- 5634 rooms
- 1245 rooms
- 316 rooms
- 227 rooms
- 388 rooms
- 1259+ rooms
New Paltz, NY household income distribution

- 342Less than $10,000
- 164$10,000 to $19,999
- 195$20,000 to $29,999
- 243$30,000 to $39,999
- 54$40,000 to $49,999
- 101$50,000 to $59,999
- 142$60,000 to $74,999
- 324$75,000 to $99,999
- 317$100,000 to $124,999
- 125$125,000 to $149,999
- 173$150,000 to $199,999
- 93$200,000 or more
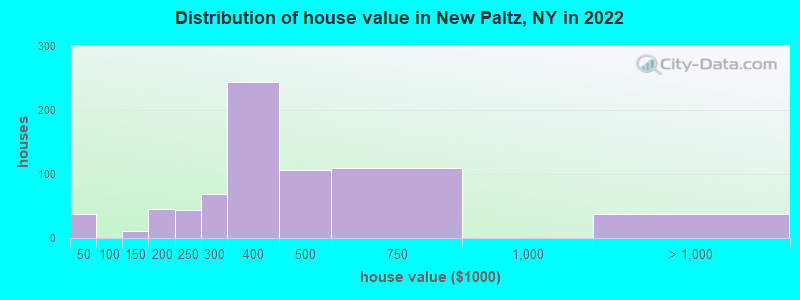
Home value of owner - occupied houses in 2022 in New Paltz, NY
-
- 36Less than $10,000
- 10$100,000 to $124,999
- 46$150,000 to $174,999
- 43$200,000 to $249,999
- 69$250,000 to $299,999
- 243$300,000 to $399,999
- 106$400,000 to $499,999
- 110$500,000 to $749,999
- 14$1,000,000 to $1,499,999
- 21$2,000,000 or more
Rent paid by renters in 2022 in New Paltz, NY
-
- 12$500 to $549
- 59$600 to $649
- 67$750 to $799
- 198$800 to $899
- 12$900 to $999
- 289$1,000 to $1,249
- 168$1,250 to $1,499
- 646$1,500 to $1,999
- 14$2,000 to $2,499
- 95$2,500 to $2,999
- 65$3,000 to $3,499
- 11$3,500 or more
- 15No cash rent
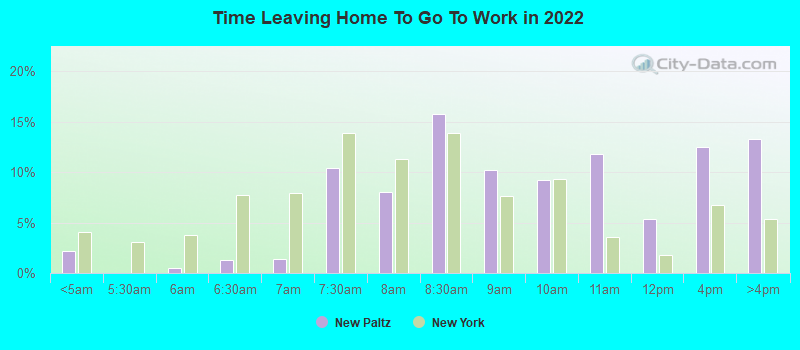
Percentage of workers working in this county: 73.7%
Number of people working at home: 445 (15.1% of all workers)
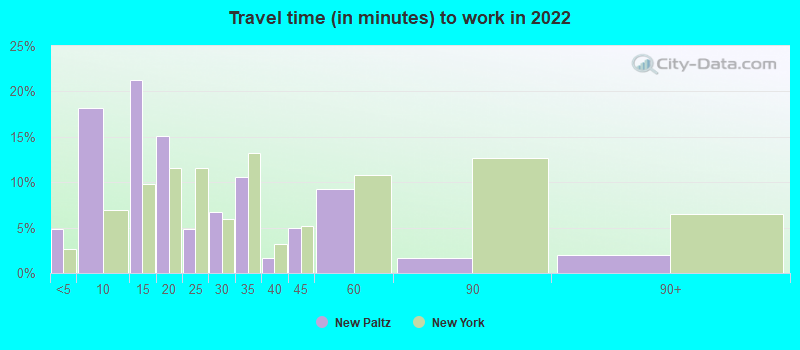
Travel time to work (commute)
- Less than 5 minutes: 148
- 5 to 9 minutes: 521
- 10 to 14 minutes: 615
- 15 to 19 minutes: 97
- 20 to 24 minutes: 168
- 25 to 29 minutes: 177
- 30 to 34 minutes: 270
- 35 to 39 minutes: 98
- 40 to 44 minutes: 29
- 45 to 59 minutes: 257
- 60 to 89 minutes: 101
- 90 or more minutes: 40
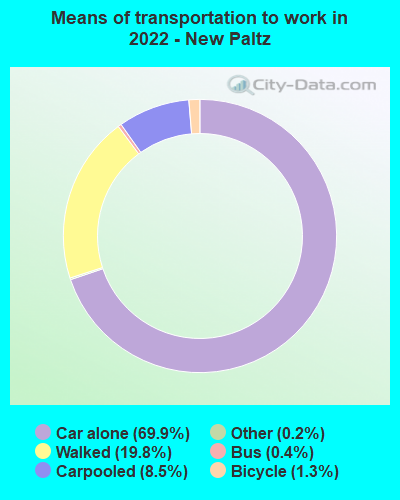
Means of transportation to work:
- Drove a car alone: 2,701 (62.5%)
- Carpooled: 348 (8.0%)
- Bus: 13 (0.3%)
- Taxi: 7 (0.2%)
- Bicycle: 56 (1.3%)
- Walked: 776 (18.0%)
- Worked at home: 440 (10.2%)
- Unemployment by race in 2022
- Unemployment rate for White non-Hispanic residents
- 6.5%Males
- 3.1%Females
- Unemployment rate for Black residents
- 60.0%Males
- 20.8%Females
- Unemployment rate for American Indian and Alaska Native residents
- 85.8%Females
- Unemployment rate for Asian residents
- 14.2%Males
- 19.4%Females
- Unemployment rate for other race residents
- 16.8%Males
- Unemployment rate for Hispanic or Latino residents
- 19.5%Males
- 19.1%Females
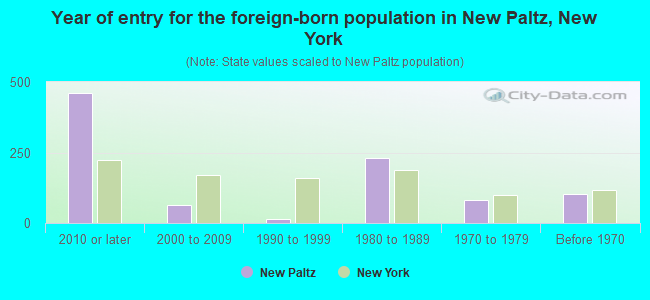
- Year of entry for the foreign-born population in New Paltz, New York
- 4602010 or later
- 652000 to 2009
- 151990 to 1999
- 2291980 to 1989
- 831970 to 1979
- 103Before 1970
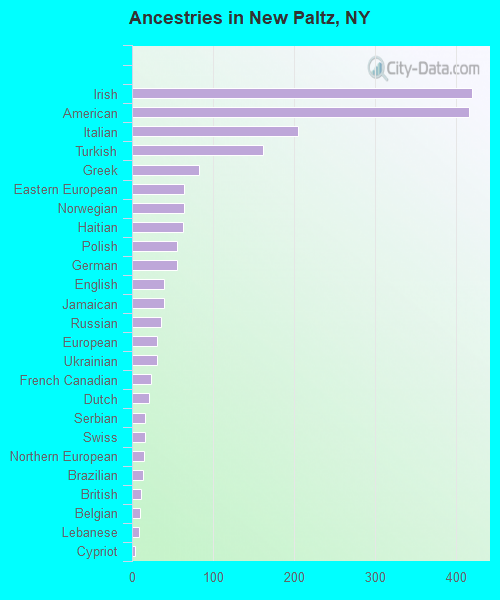
First ancestries reported:
- Irish: 420 (13.8%)
- American: 416 (13.7%)
- Italian: 205 (6.8%)
- Turkish: 162 (5.3%)
- Greek: 83 (2.7%)
- Eastern European: 64 (2.1%)
- Norwegian: 64 (2.1%)
- Haitian: 63 (2.1%)
- Polish: 56 (1.8%)
- German: 55 (1.8%)
- English: 40 (1.3%)
- Jamaican: 39 (1.3%)
- Russian: 36 (1.2%)
- European: 31 (1.0%)
- Ukrainian: 31 (1.0%)
- French Canadian: 23 (0.8%)
- Dutch: 21 (0.7%)
- Serbian: 16 (0.5%)
- Swiss: 16 (0.5%)
- Northern European: 15 (0.5%)
- Brazilian: 14 (0.5%)
- British: 11 (0.4%)
- Belgian: 10 (0.3%)
- Lebanese: 9 (0.3%)
- Cypriot: 4 (0.1%)
- Scottish: 4 (0.1%)
Most common places of birth for foreign-born residents (%):
| New Paltz: | 25.0% (154) |
| New York: | 0.5% (21,009) |
| New Paltz: | 11.7% (72) |
| New York: | 3.5% (158,432) |
| New Paltz: | 9.1% (56) |
| New York: | 2.8% (126,936) |
| New Paltz: | 6.3% (39) |
| New York: | 9.1% (410,910) |
| New Paltz: | 5.0% (31) |
| New York: | 0.6% (25,124) |
| New Paltz: | 4.5% (28) |
| New York: | 1.3% (59,107) |
| New Paltz: | 3.4% (21) |
| New York: | 11.1% (501,040) |
| New Paltz: | 3.1% (19) |
| New York: | 0.1% (3,853) |
| New Paltz: | 2.9% (18) |
| New York: | 0.4% (16,179) |
| New Paltz: | 2.9% (18) |
| New York: | 0.6% (28,472) |
| New Paltz: | 2.9% (18) |
| New York: | 0.1% (4,429) |
| New Paltz: | 1.9% (12) |
| New York: | 0.5% (23,242) |
| New Paltz: | 1.8% (11) |
| New York: | 0.8% (33,869) |
| New Paltz: | 1.8% (11) |
| New York: | 4.8% (214,559) |
| New Paltz: | 1.6% (10) |
| New York: | 0.1% (2,409) |
Place of birth for U.S.-born residents:
- This state: 5,178
- Other state: 1,809
- Northeast: 665
- Midwest: 518
- South: 476
- West: 167
61.1% of New Paltz residents lived in the same house 1 years ago.
Out of people who lived in different houses, 26.9% lived in this county.
Out of people who lived in different counties, 84.2% lived in New York.
| New Paltz: | 61.1% |
| State average: | 89.6% |
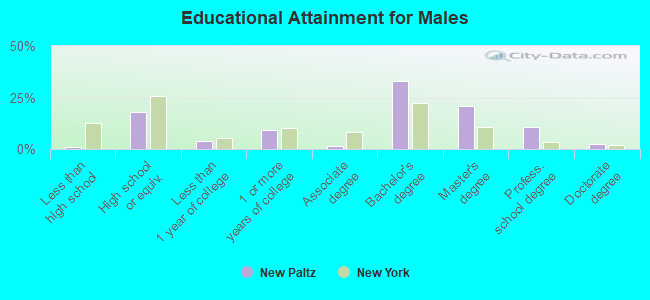
Education attainment for males 25 years and older:
- No schooling: 0
- Nursery to 4th grade: 0
- 5th and 6th grade: 8
- 7th and 8th grade: 1
- 9th grade: 1
- 10th grade: 0
- 11th grade: 0
- 12th grade, no diploma: 0
- High school graduate (or equivalency): 220
- Less than 1 year of college: 47
- Some college more than 1 year, no degree: 115
- Associate degree: 16
- Bachelor's degree: 406
- Master's degree: 255
- Professional school degree: 130
- Doctorate degree: 31
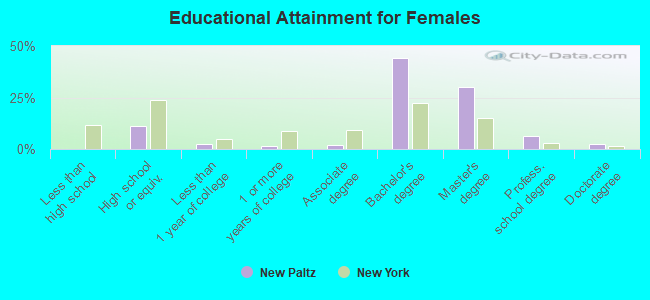
Education attainment for females 25 years and older:
- No schooling: 0
- Nursery to 4th grade: 0
- 5th and 6th grade: 0
- 7th and 8th grade: 0
- 9th grade: 0
- 10th grade: 0
- 11th grade: 0
- 12th grade, no diploma: 0
- High school graduate (or equivalency): 145
- Less than 1 year of college: 34
- Some college more than 1 year, no degree: 18
- Associate degree: 24
- Bachelor's degree: 568
- Master's degree: 390
- Professional school degree: 79
- Doctorate degree: 30
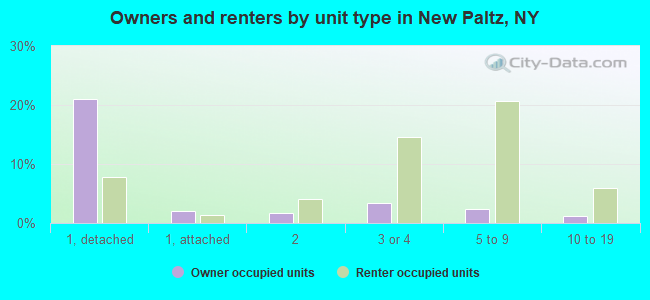
Housing units in structures:
- One, detached: 645
- One, attached: 77
- Two: 220
- 3 or 4: 419
- 5 to 9: 339
- 10 to 19: 321
- 20 to 49: 52
- 50 or more: 300
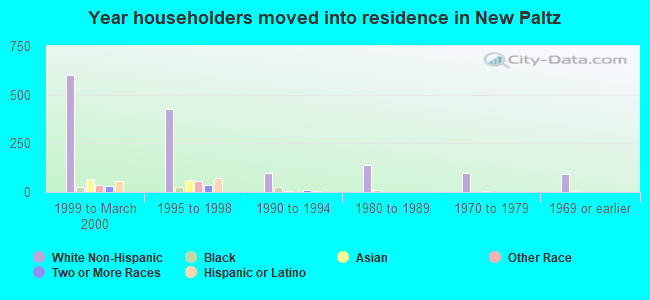
House/condo owner moved in on average 17 years ago
Renter moved in on average 0 years ago
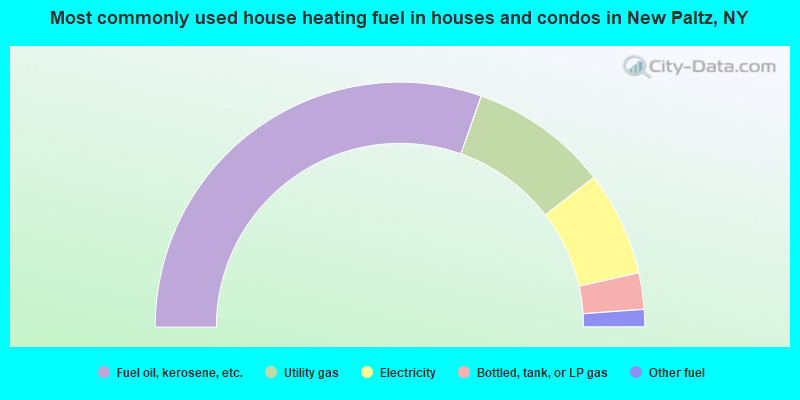
- 60.8%Fuel oil, kerosene, etc.
- 18.3%Utility gas
- 13.8%Electricity
- 4.8%Bottled, tank, or LP gas
- 2.3%Other fuel
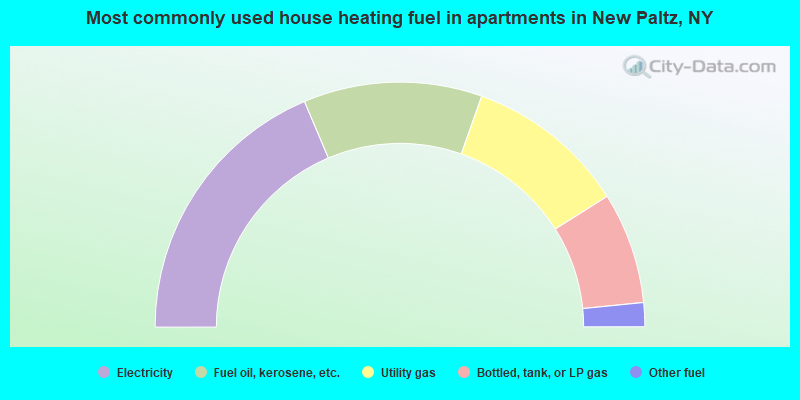
- 37.3%Electricity
- 23.6%Fuel oil, kerosene, etc.
- 21.3%Utility gas
- 14.7%Bottled, tank, or LP gas
- 3.2%Other fuel
Private vs. public school enrollment:
| Here: | 26.3% |
| New York: | 15.6% |
| Here: | 0.0% |
| New York: | 15.0% |
| Here: | 1.6% |
| New York: | 39.2% |