Jump to a detailed profile or search site with Google Custom Search

Newburg, KY (Kentucky) Houses and Residents

Estimated median house or condo value in 2022: $178,560 (it was $74,100 in 2000)
Newburg:

$178,560
Kentucky:

$196,300
Lower value quartile - upper value quartile: $118,614 - $210,964

Total population: 21,162 (Urban population: 20,688, Rural population: 0)

Houses: 8,391 (7,948 occupied: 4,449 owner occupied, 3,499 renter occupied)

% of renters here:

44%
State:

31%

Housing density: 1,463 houses/condos per square mile

Median price asked for vacant for-sale houses and condos in 2022 in this county: $108,908.

Median contract rent in 2022: $865 (lower quartile is $678, upper quartile is $1,032)


Median rent asked for vacant for-rent units in 2022: $954


Median gross rent in Newburg, KY in 2022: $1,027

Housing units in Newburg with a mortgage: 2,975 (514 second mortgage, 370 home equity loan, 27 both second mortgage and home equity loan)
Houses without a mortgage: 1,327

Compare current foreclosures near Newburg, KY:

Check out more offers near Newburg, KY.
Powered by Foreclosure.com


Latest news about housing in Newburg, KY collected exclusively by city-data.com from local newspapers, TV, and radio stations

Newburg, Kentucky Age and Sex of Residents

Household type by relationship:

Households: 726,943
  • In family households: 580,435 (118,887 male householders, 70,095 female householders)
    126,329 spouses, 205,111 children (190,669 natural, 5,126 adopted, 9,316 stepchildren), 18,004 grandchildren, 7,360 brothers or sisters, 5,615 parents, foster children, 8,500 other relatives, 17,409 non-relatives
  • In nonfamily households: 146,508 (55,241 male householders (43,300 living alone)), 64,952 female householders (55,543 living alone)), 26,315 nonrelatives
  • In group quarters: 14,153 (8,529 institutionalized population)

98,371 married couples with children.
51,135 single-parent households (8,275 men, 42,860 women).

94.3% of residents of Newburg speak English at home.
2.8% of residents speak Spanish at home (46% speak English very well, 23% speak English well, 26% speak English not well, 5% don't speak English at all).
0.8% of residents speak other Indo-European language at home (88% speak English very well, 12% speak English well).
1.9% of residents speak Asian or Pacific Island language at home (22% speak English very well, 46% speak English well, 32% speak English not well).
0.3% of residents speak other language at home (40% speak English very well, 38% speak English well, 21% speak English not well).

Foreign born population: 1,546 (6.7%)
(38.7% of them are naturalized citizens)

Median number of rooms in houses and condos:
Here:

5.4
State:

6.4

Median number of rooms in apartments
Here:

4.2
State:

4.4

Owner-occupied Renter-occupied
Bedrooms in owner-occupied houses and condos in Newburg, Kentucky
  • Bedrooms in owner-occupied houses and condos in Newburg, Kentucky
  • 47no bedroom
  • 1321 bedroom
  • 5592 bedrooms
  • 2,8343 bedrooms
  • 7534 bedrooms
  • 1245+ bedrooms
Bedrooms in renter-occupied apartments in Newburg, Kentucky
  • Bedrooms in renter-occupied apartments in Newburg, Kentucky
  • 144no bedroom
  • 1,0421 bedroom
  • 1,3772 bedrooms
  • 6743 bedrooms
  • 2574 bedrooms
  • 55+ bedrooms
Owner-occupied Renter-occupied
Cars and other vehicles available in Newburg in owner-occupied houses/condos
  • Cars and other vehicles available in Newburg in owner-occupied houses/condos
  • 328no vehicle
  • 1,3791 vehicle
  • 1,6912 vehicles
  • 8163 vehicles
  • 2064 vehicles
  • 295+ vehicles
Cars and other vehicles available in Newburg in renter-occupied apartments
  • Cars and other vehicles available in Newburg in renter-occupied apartments
  • 735no vehicle
  • 1,9211 vehicle
  • 6992 vehicles
  • 1183 vehicles
  • 114 vehicles
  • 155+ vehicles
Owner-occupied Renter-occupied
Rooms in owner-occupied houses in Newburg, Kentucky
  • Rooms in owner-occupied houses in Newburg, Kentucky
  • 01 room
  • 222 rooms
  • 1693 rooms
  • 2514 rooms
  • 1,5075 rooms
  • 1,3586 rooms
  • 6037 rooms
  • 3388 rooms
  • 2019+ rooms
Rooms in renter-occupied apartments in Newburg, Kentucky
  • Rooms in renter-occupied apartments in Newburg, Kentucky
  • 841 room
  • 3872 rooms
  • 6493 rooms
  • 1,2524 rooms
  • 6535 rooms
  • 3196 rooms
  • 647 rooms
  • 738 rooms
  • 189+ rooms
Year house built
Breakdown of mean house values by ages of householders
  • Newburg, KY household income distribution

  • Distribution of median household income in Newburg, KY in 2022
  • 17,161Less than $10,000
  • 20,459$10,000 to $19,999
  • 19,681$20,000 to $29,999
  • 21,707$30,000 to $39,999
  • 20,561$40,000 to $49,999
  • 18,673$50,000 to $59,999
  • 27,263$60,000 to $74,999
  • 31,348$75,000 to $99,999
  • 22,756$100,000 to $124,999
  • 16,866$125,000 to $149,999
  • 16,564$150,000 to $199,999
  • 21,316$200,000 or more

Percentage of workers working in this county: 92.9%
Number of people working at home: 1,462 (14.4% of all workers)

Travel time to work (commute)

  • Less than 5 minutes: 160
  • 5 to 9 minutes: 789
  • 10 to 14 minutes: 1,314
  • 15 to 19 minutes: 1,866
  • 20 to 24 minutes: 1,719
  • 25 to 29 minutes: 565
  • 30 to 34 minutes: 1,234
  • 35 to 39 minutes: 62
  • 40 to 44 minutes: 87
  • 45 to 59 minutes: 289
  • 60 to 89 minutes: 231
  • 90 or more minutes: 168

Means of transportation to work:

  • Drove a car alone: 6,535 (76.1%)
  • Carpooled: 1,382 (16.1%)
  • Bus or trolley bus: 317 (3.7%)
  • Bicycle: 40 (0.5%)
  • Walked: 113 (1.3%)
  • Other means: 97 (1.1%)
  • Worked at home: 108 (1.3%)
Class of Workers in 2000
Year of entry for the foreign-born population in Newburg, Kentucky
  • Year of entry for the foreign-born population in Newburg, Kentucky
  • 1871995 to March 2000
  • 2701990 to 1994
  • 381985 to 1989
  • 381980 to 1984
  • 81975 to 1979
  • 241970 to 1974
  • 71965 to 1969
  • 7Before 1965
Ancestries in Newburg, KY <small>(Other ancestries excluded from the graph)</small>

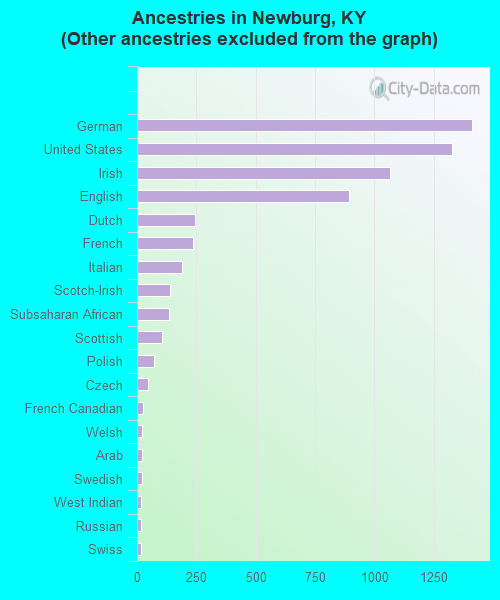
First ancestries reported:

  • Other: 12,319 (67.2%)
  • German: 1,412 (7.7%)
  • United States: 1,326 (7.2%)
  • Irish: 1,067 (5.8%)
  • English: 893 (4.9%)
  • Dutch: 244 (1.3%)
  • French: 234 (1.3%)
  • Italian: 188 (1.0%)
  • Scotch-Irish: 140 (0.8%)
  • Subsaharan African: 136 (0.7%)
  • Scottish: 105 (0.6%)
  • Polish: 73 (0.4%)
  • Czech: 45 (0.2%)
  • French Canadian: 24 (0.1%)
  • Welsh: 22 (0.1%)
  • Arab: 21 (0.1%)
  • Swedish: 19 (0.1%)
  • West Indian: 17 (0.09%)
  • Russian: 15 (0.08%)
  • Swiss: 15 (0.08%)
  • Norwegian: 10 (0.05%)
  • Danish: 7 (0.04%)
  • Portuguese: 7 (0.04%)
  • Hungarian: 1 (0.01%)

Most common places of birth for foreign-born residents (%):

Vietnam
Newburg:

48.2% (279)
Kentucky:

3.4% (2,702)

Mexico
Newburg:

11.9% (69)
Kentucky:

19.3% (15,511)

Cuba
Newburg:

7.4% (43)
Kentucky:

3.1% (2,459)

Laos
Newburg:

4.7% (27)
Kentucky:

0.3% (265)

Honduras
Newburg:

4.0% (23)
Kentucky:

0.6% (494)

Jordan
Newburg:

3.1% (18)
Kentucky:

0.3% (231)

Philippines
Newburg:

2.9% (17)
Kentucky:

3.2% (2,532)

Other Western Africa
Newburg:

1.9% (11)
Kentucky:

0.8% (623)

India
Newburg:

1.7% (10)
Kentucky:

6.2% (4,983)

Thailand
Newburg:

1.7% (10)
Kentucky:

0.4% (347)

Germany
Newburg:

1.6% (9)
Kentucky:

8.3% (6,658)

Other Northern Africa
Newburg:

1.6% (9)
Kentucky:

0.4% (281)

Place of birth for U.S.-born residents:

  • This state: 16,817
  • Other state: 3,220
  • Northeast: 410
  • Midwest: 872
  • South: 1,648
  • West: 290

55% of Newburg residents lived in the same house 5 years ago.
   Out of people who lived in different houses, 80% lived in this county.
   Out of people who lived in different counties, 32% lived in Kentucky.

Education attainment for males 25 years and older:

  • No schooling: 49
  • Nursery to 4th grade: 31
  • 5th and 6th grade: 71
  • 7th and 8th grade: 202
  • 9th grade: 262
  • 10th grade: 226
  • 11th grade: 334
  • 12th grade, no diploma: 302
  • High school graduate (or equivalency): 1,972
  • Less than 1 year of college: 400
  • Some college more than 1 year, no degree: 866
  • Associate degree: 311
  • Bachelor's degree: 300
  • Master's degree: 53
  • Professional school degree: 30
  • Doctorate degree: 20
Educational Attainment for Males

Education attainment for females 25 years and older:

  • No schooling: 67
  • Nursery to 4th grade: 21
  • 5th and 6th grade: 38
  • 7th and 8th grade: 270
  • 9th grade: 250
  • 10th grade: 443
  • 11th grade: 351
  • 12th grade, no diploma: 298
  • High school graduate (or equivalency): 2,298
  • Less than 1 year of college: 705
  • Some college more than 1 year, no degree: 1,112
  • Associate degree: 386
  • Bachelor's degree: 440
  • Master's degree: 163
  • Professional school degree: 45
  • Doctorate degree: 0
Educational Attainment for Females
Newburg marital status for males
Newburg marital status for females

Housing units in structures:

  • One, detached: 5,640
  • One, attached: 79
  • Two: 33
  • 3 or 4: 631
  • 5 to 9: 909
  • 10 to 19: 532
  • 20 to 49: 381
  • 50 or more: 173
  • Mobile homes: 13

Median worth of mobile homes: $26,491

Housing units lacking complete plumbing facilities: 0.3%

Housing units lacking complete kitchen facilities: 0.2%
Year householders moved into residence in Newburg
Houses and condos Apartments
Most commonly used house heating fuel in houses and condos in Newburg, KY
  • 80.5%Utility gas
  • 18.3%Electricity
  • 0.8%Bottled, tank, or LP gas
  • 0.3%No fuel used
  • 0.1%Fuel oil, kerosene, etc.
Most commonly used house heating fuel in apartments in Newburg, KY
  • 57.3%Electricity
  • 39.4%Utility gas
  • 1.9%Bottled, tank, or LP gas
  • 1.1%Other fuel
  • 0.3%No fuel used

Private vs. public school enrollment:

Students in private schools in grades 1 to 8 (elementary and middle school): 120
Here:

4.1%
Kentucky:

11.9%

Students in private schools in grades 9 to 12 (high school): 26
Here:

1.9%
Kentucky:

10.6%

Students in private undergraduate colleges: 152
Here:

16.2%
Kentucky:

18.1%
School Enrollment by Level of School for Male Students
School Enrollment by Level of School for Female Students
Age and Sex of Sensory-Disabled Noninstitutionalized Residents
Age and Sex of Physically-Disabled Noninstitutionalized Residents
Age and Sex of Mentally-Disabled Noninstitutionalized Residents
Age and Sex of Self-Care Disabled Noninstitutionalized Residents
Age and Sex of Go-Outside-Home Disabled Noninstitutionalized Residents
Age and Sex of Noninstitutionalized Residents with Employment Disability