Niverville, NY (New York) Houses and Residents
| Niverville: | $291,778 |
| New York: | $400,400 |
Mean price in 2022:
Detached houses: $295,911
Here: $295,911 State: $476,719
Total population: 1,662 (Urban population: 1,472 (all inside urban clusters), Rural population: 192 (all nonfarm))
Houses: 856 (517 occupied: 469 owner occupied, 54 renter occupied)
| % of renters here: | 10% |
| State: | 46% |
Housing density: 297 houses/condos per square mile
Median price asked for vacant for-sale houses and condos in 2022 in this county: $421,244.
Median contract rent in 2022: $1,671 (lower quartile is $1,498, upper quartile is $1,823)
Median rent asked for vacant for-rent units in 2022: $1,046
Median gross rent in Niverville, NY in 2022: over $2,000
Housing units in Niverville with a mortgage: 274 (37 second mortgage, 0 home equity loan, 37 both second mortgage and home equity loan)
Houses without a mortgage: 21
Median household income for houses/condos with a mortgage: $130,635
Median household income for apartments without a mortgage: $60,219
Median monthly housing costs: $1,356
Compare current foreclosures near Niverville, NY:
| Photo | Address | Area | Beds / Baths | Price | Details |
|---|---|---|---|---|---|

|
#1
Van Buren Ave
Niverville, NY 12130
|
- sq. feet
|
- baths - beds |
show details | |

|
#2
Van Buren Ave
Niverville, NY 12130
|
- sq. feet
|
- baths - beds |
show details | |

|
#3
Cedar Ln
Greenville, NY 12083
|
800 sq. feet
|
1 baths 2 beds |
$59,900
|
show details |

|
#4
N Allen St
Albany, NY 12206
|
2,464 sq. feet
|
2 baths 6 beds |
$74,900
|
show details |

|
#5
Marion Blvd
Valatie, NY 12184
|
1,180 sq. feet
|
2 baths 3 beds |
show details | |

|
#6
Beverly Ave
Albany, NY 12206
|
1,712 sq. feet
|
2 baths 4 beds |
show details | |

|
#7
Dunham Hollow Rd
East Nassau, NY 12062
|
1,640 sq. feet
|
2 baths 4 beds |
show details | |

|
#8
Mountain St
Albany, NY 12209
|
1,236 sq. feet
|
1 baths 3 beds |
show details | |

|
#9
Madison Ave West
New Baltimore, NY 12124
|
- sq. feet
|
1 baths 2 beds |
show details | |

|
#10
Jarvis Rd S
Ravena, NY 12143
|
1,431 sq. feet
|
2 baths 3 beds |
show details |
| Photo | Address | Area | Beds / Baths | Price | Details |
|---|---|---|---|---|---|

|
#11
2nd Ave
Rensselaer, NY 12144
|
1,648 sq. feet
|
1 baths 3 beds |
show details | |

|
#12
3rd St
Rensselaer, NY 12144
|
1,688 sq. feet
|
2 baths 3 beds |
show details | |

|
#13
S Pearl St
Albany, NY 12202
|
1,044 sq. feet
|
2 baths 6 beds |
show details | |

|
#14
Myrtle Ave
Albany, NY 12202
|
2,460 sq. feet
|
3 baths 6 beds |
show details | |

|
#15
Southern Blvd
Albany, NY 12209
|
2,264 sq. feet
|
2 baths 6 beds |
show details | |

|
#16
Southern Blvd
Albany, NY 12209
|
2,362 sq. feet
|
3 baths 6 beds |
show details | |

|
#17
N Washington St
Athens, NY 12015
|
1,313 sq. feet
|
1 baths 1 beds |
show details | |

|
#18
Marshall St
Albany, NY 12209
|
1,680 sq. feet
|
1 baths 3 beds |
show details | |

|
#19
Mann Ave
Rensselaer, NY 12144
|
1,876 sq. feet
|
1 baths 3 beds |
show details | |

|
#20
Delaware Ave
Albany, NY 12209
|
1,011 sq. feet
|
1 baths 3 beds |
show details |
| Photo | Address | Area | Beds / Baths | Price | Details |
|---|---|---|---|---|---|

|
#21
Fabiano Blvd
Hudson, NY 12534
|
1,437 sq. feet
|
1 baths 3 beds |
show details | |

|
#22
Clermont St # A
Delmar, NY 12054
|
1,960 sq. feet
|
2 baths 4 beds |
show details | |

|
#23
Union St
Hudson, NY 12534
|
1,800 sq. feet
|
1 baths 3 beds |
show details | |

|
#24
Sard Rd
Albany, NY 12209
|
861 sq. feet
|
1 baths 2 beds |
show details | |

|
#25
Wayne St
Athens, NY 12015
|
960 sq. feet
|
1 baths 3 beds |
show details | |

|
#26
Magnolia Ter
Albany, NY 12209
|
1,549 sq. feet
|
2 baths 4 beds |
show details | |

|
#27
2nd St
Athens, NY 12015
|
1,426 sq. feet
|
1 baths 3 beds |
show details | |

|
#28
Paul Ave
Hudson, NY 12534
|
1,132 sq. feet
|
1 baths 3 beds |
show details | |

|
#29
Broadway
Rensselaer, NY 12144
|
1,285 sq. feet
|
1 baths 3 beds |
show details | |

|
#30
Union St
Hudson, NY 12534
|
2,436 sq. feet
|
2 baths 6 beds |
show details |
| Photo | Address | Area | Beds / Baths | Price | Details |
|---|---|---|---|---|---|

|
#31
2nd Ave # 2
Albany, NY 12209
|
2,462 sq. feet
|
2 baths 6 beds |
show details | |

|
#32
Lucille Dr
Hudson, NY 12534
|
2,266 sq. feet
|
1 baths 3 beds |
show details | |

|
#33
Mount Hope Dr
Albany, NY 12202
|
1,200 sq. feet
|
1 baths 4 beds |
show details | |

|
#34
Broadway
Rensselaer, NY 12144
|
2,000 sq. feet
|
2 baths 2 beds |
show details | |

|
#35
Brackwyck Dr
Rensselaer, NY 12144
|
1,232 sq. feet
|
1 baths 3 beds |
show details | |

|
#36
Clinton St
Albany, NY 12202
|
2,536 sq. feet
|
2 baths 6 beds |
show details | |

|
#37
Montrose Dr
Delmar, NY 12054
|
2,012 sq. feet
|
2 baths 3 beds |
show details | |

|
#38
Tollgate Rd
Averill Park, NY 12018
|
2,088 sq. feet
|
2 baths 3 beds |
show details | |

|
#39
Leonard
Albany, NY 12202
|
1,600 sq. feet
|
2 baths 4 beds |
show details | |

|
#40
Union St
Athens, NY 12015
|
1,144 sq. feet
|
1 baths 3 beds |
show details |
| Photo | Address | Area | Beds / Baths | Price | Details |
|---|---|---|---|---|---|

|
#41
Delaware St
Albany, NY 12202
|
2,112 sq. feet
|
2 baths 5 beds |
show details | |

|
#42
Fish And Game Rd
Hudson, NY 12534
|
2,592 sq. feet
|
2 baths 4 beds |
show details | |

|
#43
Delaware St
Albany, NY 12202
|
2,112 sq. feet
|
2 baths 5 beds |
show details | |

|
#44
S Pearl St
Albany, NY 12202
|
1,044 sq. feet
|
1 baths 2 beds |
show details | |

|
#45
Murrlin Dr
Delmar, NY 12054
|
1,152 sq. feet
|
2 baths 3 beds |
show details | |

|
#46
Pinetree Dr
Delmar, NY 12054
|
1,812 sq. feet
|
1 baths 4 beds |
show details | |

|
#47
Elizabeth St
Albany, NY 12202
|
2,336 sq. feet
|
2 baths 6 beds |
show details | |

|
#48
Route 203
Valatie, NY 12184
|
1,271 sq. feet
|
2 baths 3 beds |
show details | |

|
#49
Osborne St
Albany, NY 12202
|
2,508 sq. feet
|
2 baths 5 beds |
show details | |

|
Check over 1 million property listings on Foreclosure.com!
|
browse all offers | |||

Latest news about housing in Niverville, NY collected exclusively by city-data.com from local newspapers, TV, and radio stations


Median year apartment built: 1961
Household type by relationship:
Households: 1,439- Male householders: 274 (24 living alone), Female householders: 229 (24 living alone)
258 spouses (258 opposite-sex spouses), 139 unmarried partners, (139 opposite-sex unmarried partners), 495 children (460 natural, 0 adopted, 34 stepchildren), 34 grandchildren, 0 brothers or sisters, 0 parents, 0 foster children, 0 other relatives, 7 non-relatives
Size of family households: 174 2-persons, 81 3-persons, 138 4-persons, 19 5-persons.
Size of nonfamily households: 52 1-person, 52 2-persons.
139 married couples with children.
243 single-parent households (147 men, 96 women).
99.3% of residents of Niverville speak English at home.
0.5% of residents speak Spanish at home (100% speak English very well).
| Here: | 6.8 |
| State: | 6.3 |
| Here: | 6.4 |
| State: | 3.8 |

- Bedrooms in owner-occupied houses and condos in Niverville, New York
- 0no bedroom
- 01 bedroom
- 1022 bedrooms
- 2973 bedrooms
- 414 bedrooms
- 295+ bedrooms

- Bedrooms in renter-occupied apartments in Niverville, New York
- 0no bedroom
- 01 bedroom
- 112 bedrooms
- 313 bedrooms
- 124 bedrooms
- 05+ bedrooms

- Cars and other vehicles available in Niverville in owner-occupied houses/condos
- 20no vehicle
- 781 vehicle
- 2142 vehicles
- 1133 vehicles
- 444 vehicles
- 05+ vehicles

- Cars and other vehicles available in Niverville in renter-occupied apartments
- 0no vehicle
- 311 vehicle
- 122 vehicles
- 113 vehicles
- 04 vehicles
- 05+ vehicles

- Rooms in owner-occupied houses in Niverville, New York
- 01 room
- 02 rooms
- 03 rooms
- 124 rooms
- 435 rooms
- 1356 rooms
- 1067 rooms
- 848 rooms
- 899+ rooms

- Rooms in renter-occupied apartments in Niverville, New York
- 01 room
- 02 rooms
- 03 rooms
- 04 rooms
- 05 rooms
- 316 rooms
- 117 rooms
- 08 rooms
- 129+ rooms


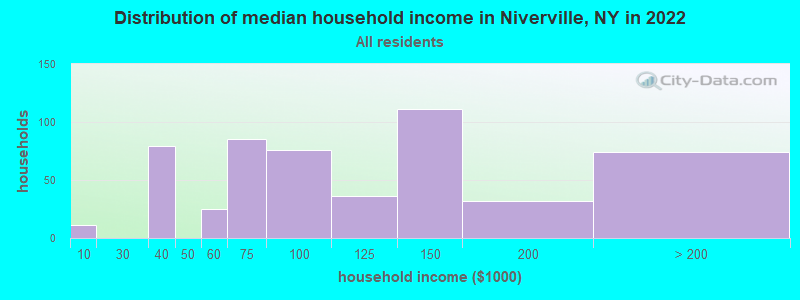
Niverville, NY household income distribution

- 11Less than $10,000
- 79$30,000 to $39,999
- 25$50,000 to $59,999
- 85$60,000 to $74,999
- 76$75,000 to $99,999
- 36$100,000 to $124,999
- 111$125,000 to $149,999
- 32$150,000 to $199,999
- 74$200,000 or more
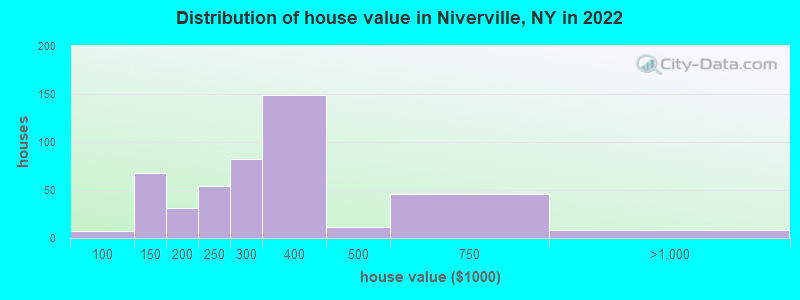
Home value of owner - occupied houses in 2022 in Niverville, NY
-
- 7$90,000 to $99,999
- 18$100,000 to $124,999
- 49$125,000 to $149,999
- 6$150,000 to $174,999
- 24$175,000 to $199,999
- 54$200,000 to $249,999
- 81$250,000 to $299,999
- 149$300,000 to $399,999
- 10$400,000 to $499,999
- 46$500,000 to $749,999
- 7$750,000 to $999,999
Rent paid by renters in 2022 in Niverville, NY
-
- 11$1,000 to $1,249
- 44$1,500 to $1,999


Percentage of workers working in this county: 71.5%
Number of people working at home: 127 (19.8% of all workers)
Travel time to work (commute)
- Less than 5 minutes: 0
- 5 to 9 minutes: 51
- 10 to 14 minutes: 10
- 15 to 19 minutes: 103
- 20 to 24 minutes: 95
- 25 to 29 minutes: 125
- 30 to 34 minutes: 65
- 35 to 39 minutes: 33
- 40 to 44 minutes: 0
- 45 to 59 minutes: 15
- 60 to 89 minutes: 27
- 90 or more minutes: 0
Means of transportation to work:
- Drove a car alone: 713 (86.6%)
- Carpooled: 82 (10.0%)
- Bus or trolley bus: 6 (0.7%)
- Walked: 5 (0.6%)
- Worked at home: 17 (2.1%)

- Unemployment by race in 2022
- Unemployment rate for White non-Hispanic residents
- 1.7%Males
- 16.9%Females

- Year of entry for the foreign-born population in Niverville, New York
- 01995 to March 2000
- 01990 to 1994
- 01985 to 1989
- 01980 to 1984
- 01975 to 1979
- 01970 to 1974
- 71965 to 1969
- 4Before 1965

First ancestries reported:
- American: 183 (31.1%)
- Italian: 98 (16.6%)
- English: 89 (15.1%)
- Hungarian: 80 (13.6%)
- Irish: 74 (12.6%)
- Russian: 22 (3.7%)
- German: 14 (2.4%)
- European: 12 (2.0%)
Most common places of birth for foreign-born residents (%):
| Niverville: | 63.6% (7) |
| New York: | 0.5% (18,889) |
| Niverville: | 36.4% (4) |
| New York: | 0.3% (13,246) |
Place of birth for U.S.-born residents:
- This state: 1,240
- Other state: 181
- Northeast: 110
- Midwest: 0
- South: 67
- West: 0
90.6% of Niverville residents lived in the same house 1 years ago.
Out of people who lived in different houses, 4.3% lived in this county.
Out of people who lived in different counties, 0.0% lived in New York.
| Niverville: | 90.6% |
| State average: | 89.6% |
Education attainment for males 25 years and older:
- No schooling: 0
- Nursery to 4th grade: 0
- 5th and 6th grade: 0
- 7th and 8th grade: 0
- 9th grade: 0
- 10th grade: 0
- 11th grade: 0
- 12th grade, no diploma: 12
- High school graduate (or equivalency): 240
- Less than 1 year of college: 5
- Some college more than 1 year, no degree: 6
- Associate degree: 10
- Bachelor's degree: 56
- Master's degree: 62
- Professional school degree: 21
- Doctorate degree: 0

Education attainment for females 25 years and older:
- No schooling: 0
- Nursery to 4th grade: 0
- 5th and 6th grade: 0
- 7th and 8th grade: 0
- 9th grade: 0
- 10th grade: 12
- 11th grade: 0
- 12th grade, no diploma: 0
- High school graduate (or equivalency): 33
- Less than 1 year of college: 34
- Some college more than 1 year, no degree: 79
- Associate degree: 117
- Bachelor's degree: 168
- Master's degree: 94
- Professional school degree: 23
- Doctorate degree: 0


Housing units in structures:
- One, detached: 856
Housing units lacking complete kitchen facilities in 2022: 7.2%

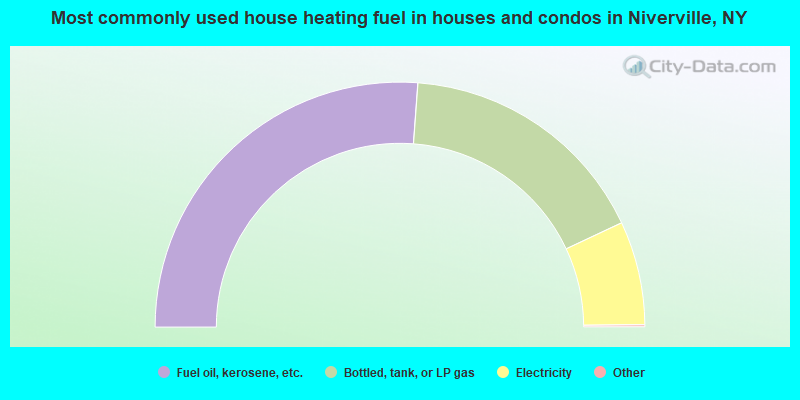
- 52.5%Fuel oil, kerosene, etc.
- 33.8%Bottled, tank, or LP gas
- 13.7%Electricity
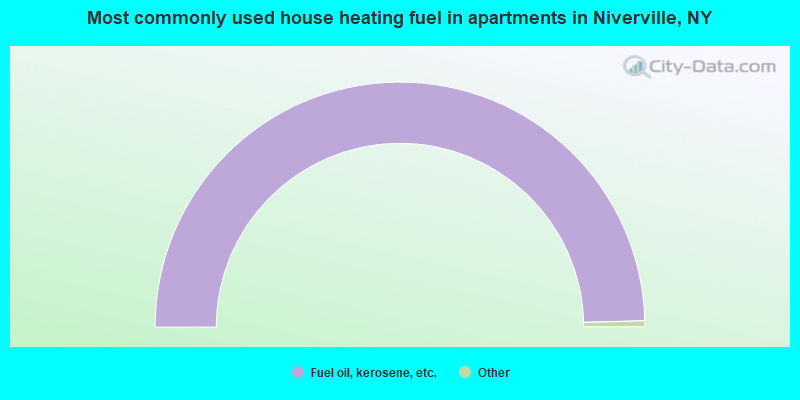
- 100.0%Fuel oil, kerosene, etc.
Private vs. public school enrollment:
| Here: | 8.1% |
| New York: | 15.6% |
| Here: | 0.0% |
| New York: | 15.0% |


