North Bellmore, NY (New York) Houses and Residents
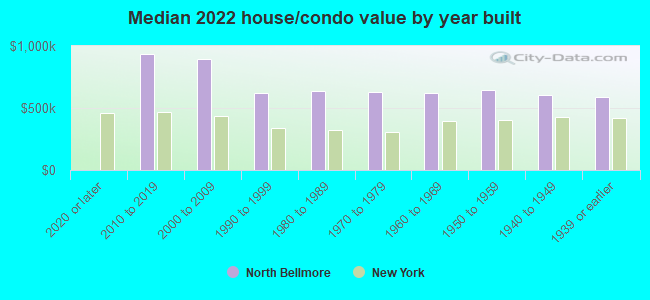
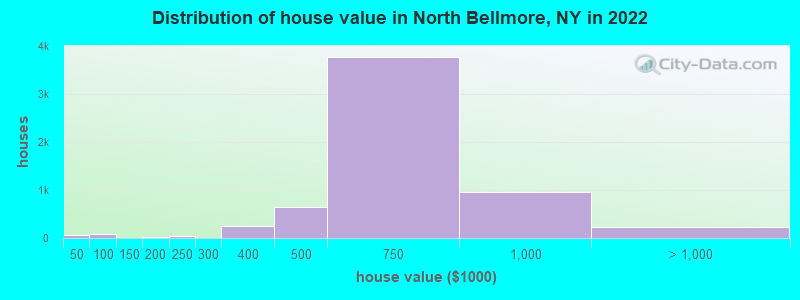
Estimated median house or condo value in 2022: $636,216 (it was $223,900 in 2000 )
North Bellmore:
$636,216New York:
$400,400
Lower value quartile - upper value quartile: $542,434 - $745,102Total population: 19,941 (All urban)
Houses: 6,717 (6,579 occupied: 6,055 owner occupied, 512 renter occupied )
% of renters here:
8%State:
46%
Housing density: 2,575 houses/condos per square mile
Median price asked for vacant for-sale houses and condos in 2022: $563,004.
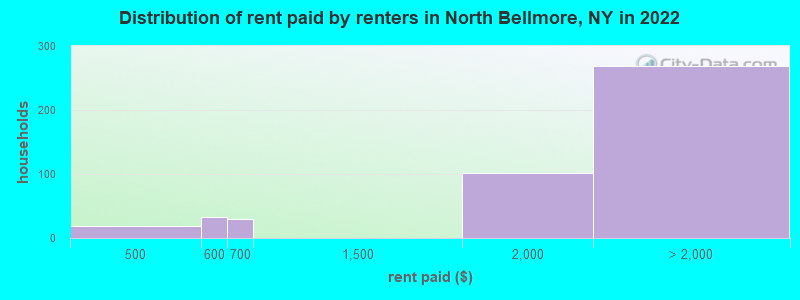
Median contract rent in 2022: over $2,000 (lower quartile is $1,553, upper quartile is over $2,000)
Median gross rent in North Bellmore, NY in 2022: over $2,000
Housing units in North Bellmore with a mortgage: 4,458 (575 second mortgage, 93 home equity loan, 452 both second mortgage and home equity loan )Houses without a mortgage: 85
Median household income for houses/condos with a mortgage: $196,051
Median household income for apartments without a mortgage: $111,002
Median monthly housing costs: $3,062
Data:
Median house or condo value ($)
Median house or condo value ($ change since 2000)
Median house or condo value ($) - White
Median house or condo value ($) - Black or African American
Median house or condo value ($) - Asian
Median house or condo value ($) - Hispanic or Latino
Median house or condo value ($) - American Indian and Alaska Native
Median house or condo value ($) - Multirace
Median house or condo value ($) - Other Race
Median price asked for mobile homes ($)
Household density (households per square mile)
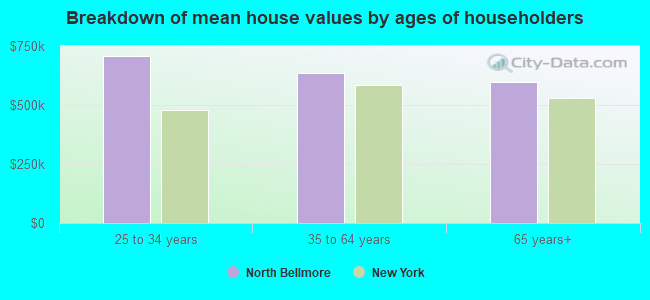
Mean house or condo value by units in structure - 1, detached ($)
Mean house or condo value by units in structure - 1, attached ($)
Mean house or condo value by units in structure - 2 ($)
Mean house or condo value by units in structure by units in structure - 3 or 4 ($)
Mean house or condo value by units in structure - 5 or more ($)
Mean house or condo value by units in structure - Boat, RV, van, etc. ($)
Mean house or condo value by units in structure - Mobile home ($)
Median contract rent ($)
Median contract rent - Lower quartile ($)
Median contract rent - Upper quartile ($)
Median gross rent ($)
Urban houses (%)
Rural houses (%)
Houses occupied (%)
Houses occupied (% change since 2000)
Houses owner occupied (%)
Houses owner occupied (% change since 2000)
Houses renter occupied (%)
Houses renter occupied (% change since 2000)
Vacant housing units - For rent (%)
Vacant housing units - For rent (% change since 2000)
Vacant housing units - For sale only (%)
Vacant housing units - For sale only (% change since 2000)
Vacant housing units - Rented or sold, not occupied (%)
Vacant housing units - Rented or sold, not occupied (% change since 2000)
Vacant housing units - For seasonal, recreational, or occasional use (%)
Vacant housing units - For seasonal, recreational, or occasional use (% change since 2000)
Vacant housing units - For migrant workers (%)
Vacant housing units - For migrant workers (% change since 2000)
Vacant housing units - Other vacant (%)
Vacant housing units - Other vacant (% change since 2000)
Median monthly housing costs ($)
Median household income for houses/condos with a mortgage ($)
Median household income for houses/condos without a mortgage ($)
Median household income ($)
Median household income ($) - White
Median household income ($) - Black or African American
Median household income ($) - Asian
Median household income ($) - Hispanic or Latino
Median household income ($) - American Indian and Alaska Native
Median household income ($) - Multirace
Median household income ($) - Other Race
Mortgage status - with mortgage (%)
Mortgage status - with second mortgage (%)
Mortgage status - with home equity loan (%)
Mortgage status - with both second mortgage and home equity loan (%)
Mortgage status - without a mortgage (%)
Median year house/condo built
Median year apartment built
Household type by relationship - Male householder living alone (%)
Household type by relationship - Male householder not living alone (%)
Household type by relationship - Female householder living alone (%)
Household type by relationship - Female householder not living alone (%)
Household type by relationship - Opposite-Sex spouse (%)
Household type by relationship - Same-Sex spouse (%)
Household type by relationship - Opposite-Sex unmarried partner (%)
Household type by relationship - Same-Sex unmarried partner (%)
Household type by relationship - In group quarters (%)
Size of family households - 2-person household (%)
Size of family households - 3-person household (%)
Size of family households - 4-person household (%)
Size of family households - 5-person household (%)
Size of family households - 6-person household (%)
Size of family households - 7-or-more-person household (%)
Size of nonfamily households - 1-person household (%)
Size of nonfamily households - 2-person household (%)
Size of nonfamily households - 3-person household (%)
Size of nonfamily households - 4-person household (%)
Size of nonfamily households - 5-person household (%)
Size of nonfamily households - 6-person household (%)
Size of nonfamily households - 7-or-moreperson household (%)
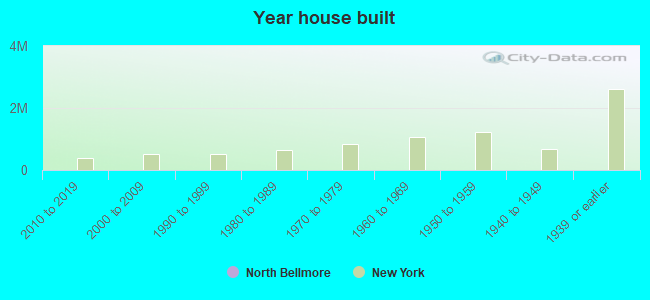
Year house built - Built 2010 or later (%)
Year house built - Built 2000 to 2009 (%)
Year house built - Built 1990 to 1999 (%)
Year house built - Built 1980 to 1989 (%)
Year house built - Built 1970 to 1979 (%)
Year house built - Built 1960 to 1969 (%)
Year house built - Built 1950 to 1959 (%)
Year house built - Built 1940 to 1949 (%)
Year house built - Built 1939 or earlier (%)
Median number of rooms in houses and condos
Median number of rooms in apartments
Median number of bedrooms in owner occupied houses
Mean number of bedrooms in owner occupied houses
Median number of bedrooms in renter occupied houses
Mean number of bedrooms in renter occupied houses
Median number of vehichles in owner occupied houses
Mean number of vehichles in owner occupied houses
Median number of vehichles in renter occupied houses
Mean number of vehichles in renter occupied houses
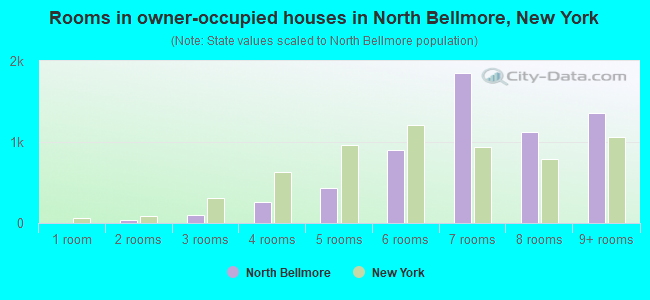
Rooms in owner-occupied houses - 1 room (%)
Rooms in owner-occupied houses - 2 rooms (%)
Rooms in owner-occupied houses - 3 rooms (%)
Rooms in owner-occupied houses - 4 rooms (%)
Rooms in owner-occupied houses - 5 rooms (%)
Rooms in owner-occupied houses - 6 rooms (%)
Rooms in owner-occupied houses - 7 rooms (%)
Rooms in owner-occupied houses - 8 rooms (%)
Rooms in owner-occupied houses - 9+ rooms (%)
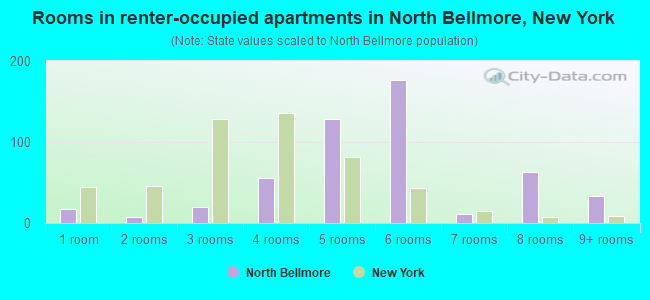
Rooms in renter-occupied houses - 1 room (%)
Rooms in renter-occupied houses - 2 rooms (%)
Rooms in renter-occupied houses - 3 rooms (%)
Rooms in renter-occupied houses - 4 rooms (%)
Rooms in renter-occupied houses - 5 rooms (%)
Rooms in renter-occupied houses - 6 rooms (%)
Rooms in renter-occupied houses - 7 rooms (%)
Rooms in renter-occupied houses - 8 rooms (%)
Rooms in renter-occupied houses - 9+ rooms (%)
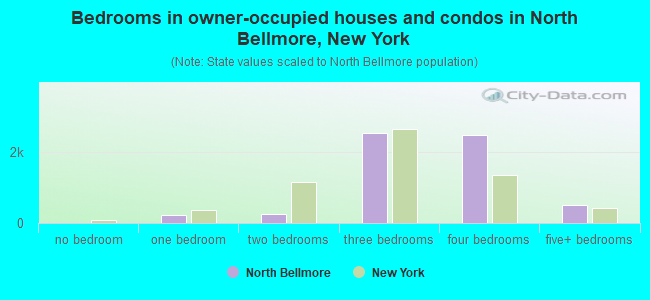
Bedrooms in owner-occupied houses - no bedrooms (%)
Bedrooms in owner-occupied houses - 1 bedroom (%)
Bedrooms in owner-occupied houses - 2 bedrooms (%)
Bedrooms in owner-occupied houses - 3 bedrooms (%)
Bedrooms in owner-occupied houses - 4 bedrooms (%)
Bedrooms in owner-occupied houses - 5+ bedrooms (%)
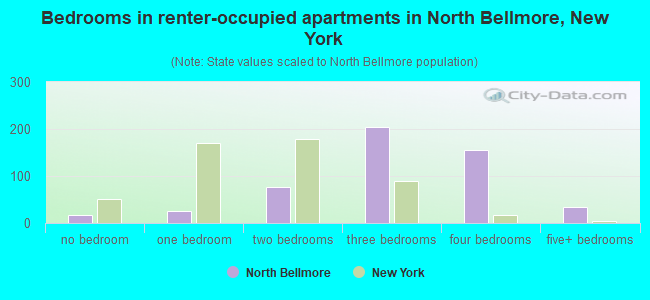
Bedrooms in renter-occupied houses - no bedrooms (%)
Bedrooms in renter-occupied houses - 1 bedroom (%)
Bedrooms in renter-occupied houses - 2 bedrooms (%)
Bedrooms in renter-occupied houses - 3 bedrooms (%)
Bedrooms in renter-occupied houses - 4 bedrooms (%)
Bedrooms in renter-occupied houses - 5+ bedrooms (%)
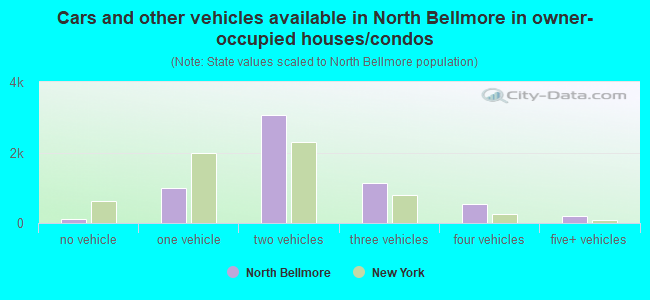
Vehicles available in owner-occupied houses - no vehicle available (%)
Vehicles available in owner-occupied houses - 1 vehicle available(%)
Vehicles available in owner-occupied houses - 2 Vehicles available (%)
Vehicles available in owner-occupied houses - 3 Vehicles available (%)
Vehicles available in owner-occupied houses - 4 Vehicles available (%)
Vehicles available in owner-occupied houses - 5+ Vehicles available (%)
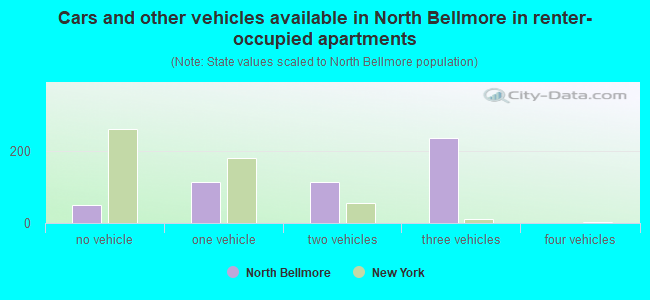
Vehicles available in renter-occupied houses - no vehicle available (%)
Vehicles available in renter-occupied houses - 1 vehicle available (%)
Vehicles available in renter-occupied houses - 2 Vehicles available (%)
Vehicles available in renter-occupied houses - 3 Vehicles available (%)
Vehicles available in renter-occupied houses - 4 Vehicles available (%)
Vehicles available in renter-occupied houses - 5+ Vehicles available (%)
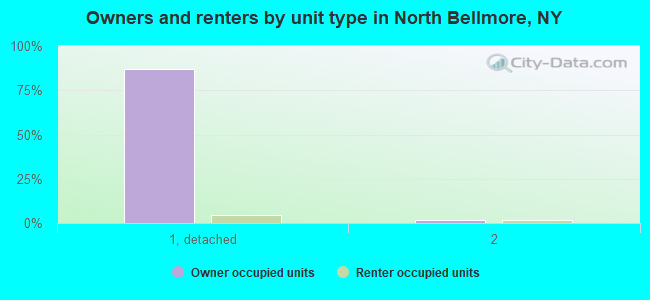
Housing units in structures - 1, detached (%)
Housing units in structures - 1, attached (%)
Housing units in structures - 2 (%)
Housing units in structures - 3 or 4 (%)
Housing units in structures - 5 to 9 (%)
Housing units in structures - 10 to 19 (%)
Housing units in structures - 20 to 49 (%)
Housing units in structures - 50 or more (%)
Housing units in structures - Mobile home (%)
Housing units in structures - Boat, RV, van, etc. (%)
Housing units in structures - Owners - 1, detached (%)
Housing units in structures - Owners - 1, attached (%)
Housing units in structures - Owners - 2 (%)
Housing units in structures - Owners - 3 or 4 (%)
Housing units in structures - Owners - 5 to 9 (%)
Housing units in structures - Owners - 10 to 19 (%)
Housing units in structures - Owners - 20 to 49 (%)
Housing units in structures - Owners - 50 or more (%)
Housing units in structures - Owners - Mobile home (%)
Housing units in structures - Owners - Boat, RV, van, etc. (%)
Housing units in structures - Renters - 1, detached (%)
Housing units in structures - Renters - 1, attached (%)
Housing units in structures - Renters - 2 (%)
Housing units in structures - Renters - 3 or 4 (%)
Housing units in structures - Renters - 5 to 9 (%)
Housing units in structures - Renters - 10 to 19 (%)
Housing units in structures - Renters - 20 to 49 (%)
Housing units in structures - Renters - 50 or more (%)
Housing units in structures - Renters - Mobile home (%)
Housing units in structures - Renters - Boat, RV, van, etc. (%)
House/condo owner moved in on average (years ago)
Renter moved in on average (years ago)
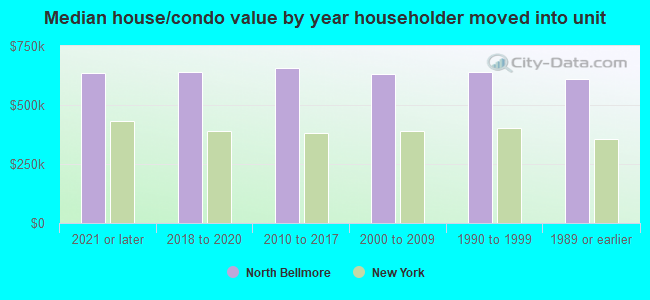
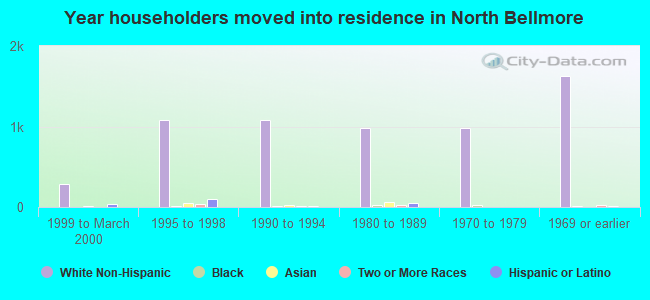
Year householder moved into unit - Moved in 1999 to March 2000 (%)
Year householder moved into unit - Moved in 1999 to March 2000 (%) - White
Year householder moved into unit - Moved in 1999 to March 2000 (%) - Black or African American
Year householder moved into unit - Moved in 1999 to March 2000 (%) - Asian
Year householder moved into unit - Moved in 1999 to March 2000 (%) - Hispanic or Latino
Year householder moved into unit - Moved in 1999 to March 2000 (%) - American Indian and Alaska Native
Year householder moved into unit - Moved in 1999 to March 2000 (%) - Multirace
Year householder moved into unit - Moved in 1999 to March 2000 (%) - Other Race
Year householder moved into unit - Moved in 1995 to 1998 (%)
Year householder moved into unit - Moved in 1995 to 1998 (%) - White
Year householder moved into unit - Moved in 1995 to 1998 (%) - Black or African American
Year householder moved into unit - Moved in 1995 to 1998 (%) - Asian
Year householder moved into unit - Moved in 1995 to 1998 (%) - Hispanic or Latino
Year householder moved into unit - Moved in 1995 to 1998 (%) - American Indian and Alaska Native
Year householder moved into unit - Moved in 1995 to 1998 (%) - Multirace
Year householder moved into unit - Moved in 1995 to 1998 (%) - Other Race
Year householder moved into unit - Moved in 1990 to 1994 (%)
Year householder moved into unit - Moved in 1990 to 1994 (%) - White
Year householder moved into unit - Moved in 1990 to 1994 (%) - Black or African American
Year householder moved into unit - Moved in 1990 to 1994 (%) - Asian
Year householder moved into unit - Moved in 1990 to 1994 (%) - Hispanic or Latino
Year householder moved into unit - Moved in 1990 to 1994 (%) - American Indian and Alaska Native
Year householder moved into unit - Moved in 1990 to 1994 (%) - Multirace
Year householder moved into unit - Moved in 1990 to 1994 (%) - Other Race
Year householder moved into unit - Moved in 1980 to 1989 (%)
Year householder moved into unit - Moved in 1980 to 1989 (%) - White
Year householder moved into unit - Moved in 1980 to 1989 (%) - Black or African American
Year householder moved into unit - Moved in 1980 to 1989 (%) - Asian
Year householder moved into unit - Moved in 1980 to 1989 (%) - Hispanic or Latino
Year householder moved into unit - Moved in 1980 to 1989 (%) - American Indian and Alaska Native
Year householder moved into unit - Moved in 1980 to 1989 (%) - Multirace
Year householder moved into unit - Moved in 1980 to 1989 (%) - Other Race
Year householder moved into unit - Moved in 1970 to 1979 (%)
Year householder moved into unit - Moved in 1970 to 1979 (%) - White
Year householder moved into unit - Moved in 1970 to 1979 (%) - Black or African American
Year householder moved into unit - Moved in 1970 to 1979 (%) - Asian
Year householder moved into unit - Moved in 1970 to 1979 (%) - Hispanic or Latino
Year householder moved into unit - Moved in 1970 to 1979 (%) - American Indian and Alaska Native
Year householder moved into unit - Moved in 1970 to 1979 (%) - Multirace
Year householder moved into unit - Moved in 1970 to 1979 (%) - Other Race
Year householder moved into unit - Moved in 1969 or earlier (%)
Year householder moved into unit - Moved in 1969 or earlier (%) - White
Year householder moved into unit - Moved in 1969 or earlier (%) - Black or African American
Year householder moved into unit - Moved in 1969 or earlier (%) - Asian
Year householder moved into unit - Moved in 1969 or earlier (%) - Hispanic or Latino
Year householder moved into unit - Moved in 1969 or earlier (%) - American Indian and Alaska Native
Year householder moved into unit - Moved in 1969 or earlier (%) - Multirace
Year householder moved into unit - Moved in 1969 or earlier (%) - Other Race
Housing units lacking complete plumbing facilities (%)
Housing units lacking complete kitchen facilities (%)
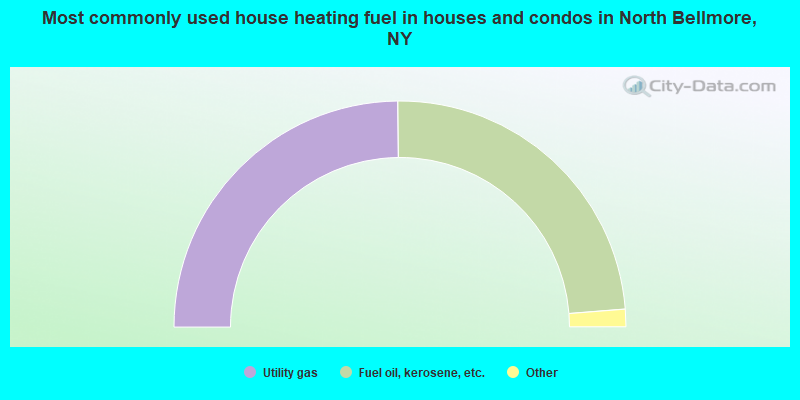
House heating fuel used in houses and condos - Utility gas (%)
House heating fuel used in houses and condos - Bottled, tank, or LP gas (%)
House heating fuel used in houses and condos - Electricity (%)
House heating fuel used in houses and condos - Fuel oil, kerosene, etc. (%)
House heating fuel used in houses and condos - Coal or coke (%)
House heating fuel used in houses and condos - Wood (%)
House heating fuel used in houses and condos - Solar energy (%)
House heating fuel used in houses and condos - Other fuel (%)
House heating fuel used in houses and condos - No fuel used (%)
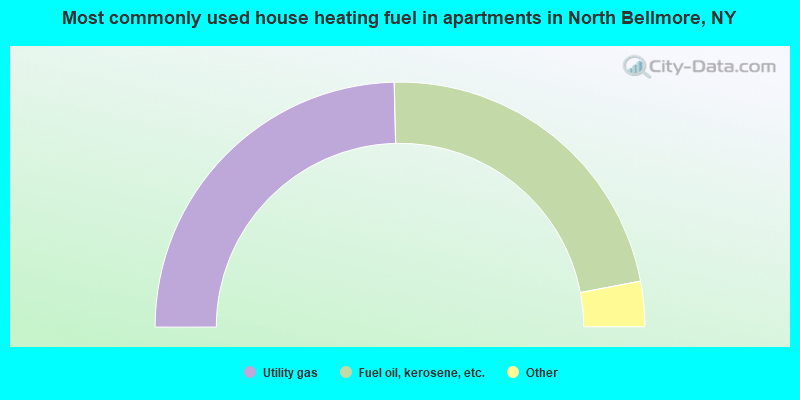
House heating fuel used in apartments - Utility gas (%)
House heating fuel used in apartments - Bottled, tank, or LP gas (%)
House heating fuel used in apartments - Electricity (%)
House heating fuel used in apartments - Fuel oil, kerosene, etc. (%)
House heating fuel used in apartments - Coal or coke (%)
House heating fuel used in apartments - Wood (%)
House heating fuel used in apartments - Solar energy (%)
House heating fuel used in apartments - Other fuel (%)
House heating fuel used in apartments - No fuel used (%)
Median year house/condo built: 1959Median year apartment built: 1954Household type by relationship:
Households: 20,987
Male householders: 3,644 (219 living alone ), Female householders: 2,877 (472 living alone )4,954 spouses (4,954 opposite-sex spouses ), 128 unmarried partners , (128 opposite-sex unmarried partners ), 7,580 children (7,223 natural , 192 adopted , 164 stepchildren ), 184 grandchildren , 189 brothers or sisters , 388 parents , 0 foster children , 513 other relatives , 373 non-relatives In group quarters: 152
Size of family households: 1,580 2-persons , 1,364 3-persons , 1,736 4-persons , 658 5-persons , 208 6-persons , 107 7-or-more-persons .
Size of nonfamily households: 720 1-person , 94 2-persons , 40 4-persons .
4,195 married couples with children. single-parent households (59 men , 202 women ).
80.6% of residents of North Bellmore speak English at home. of residents speak Spanish at home (75% speak English very well , 19% speak English well , 5% speak English not well ).of residents speak other Indo-European language at home (80% speak English very well , 16% speak English well , 2% speak English not well , 2% don't speak English at all ).of residents speak Asian or Pacific Island language at home (86% speak English very well , 11% speak English well , 2% speak English not well , 1% don't speak English at all ).of residents speak other language at home (65% speak English very well , 10% speak English well , 25% speak English not well ).
Foreign born population: 2,527 (12.0%)of them are naturalized citizens )
Median number of rooms in houses and condos:
Median number of rooms in apartments
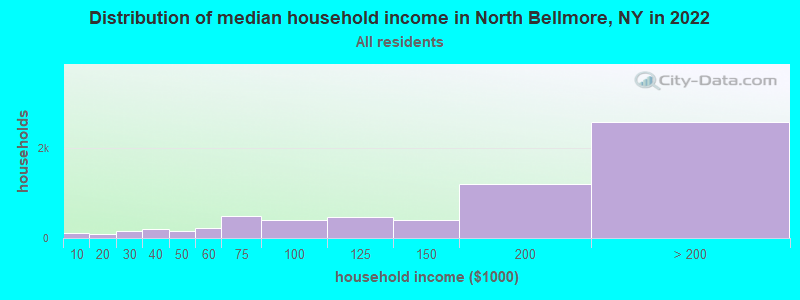
North Bellmore, NY household income distribution 119 Less than $10,00082 $10,000 to $19,999157 $20,000 to $29,999210 $30,000 to $39,999161 $40,000 to $49,999232 $50,000 to $59,999491 $60,000 to $74,999404 $75,000 to $99,999463 $100,000 to $124,999407 $125,000 to $149,9991,206 $150,000 to $199,9992,591 $200,000 or more
Home value of owner - occupied houses in 2022 in North Bellmore, NY 58 Less than $10,00038 $60,000 to $69,99938 $70,000 to $79,99931 $150,000 to $174,99941 $200,000 to $249,999253 $300,000 to $399,999650 $400,000 to $499,9993,767 $500,000 to $749,999958 $750,000 to $999,999229 $1,000,000 to $1,499,999Rent paid by renters in 2022 in North Bellmore, NY 19 $450 to $49933 $550 to $59930 $650 to $699102 $1,500 to $1,999171 $2,000 to $2,49916 $2,500 to $2,99924 $3,000 to $3,49927 $3,500 or more30 No cash rent
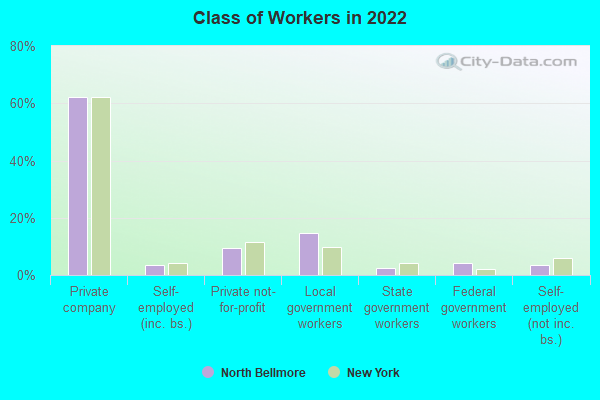
Percentage of workers working in this county: 60.3%Number of people working at home: 1,816 (17.0% of all workers )
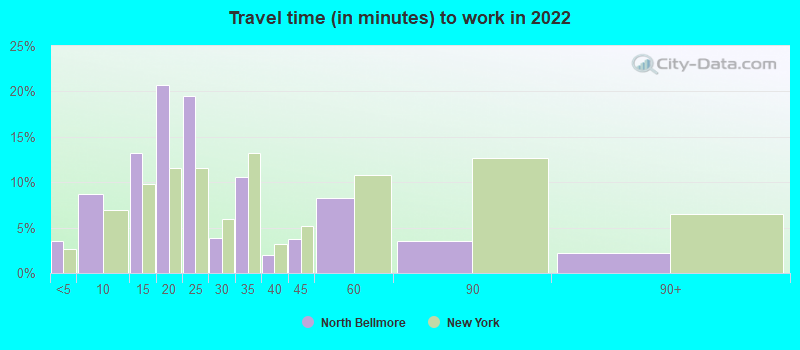
Travel time to work (commute)
Less than 5 minutes: 755 to 9 minutes: 34210 to 14 minutes: 77115 to 19 minutes: 99520 to 24 minutes: 1,33125 to 29 minutes: 58530 to 34 minutes: 1,07135 to 39 minutes: 21740 to 44 minutes: 27145 to 59 minutes: 87560 to 89 minutes: 1,64990 or more minutes: 736
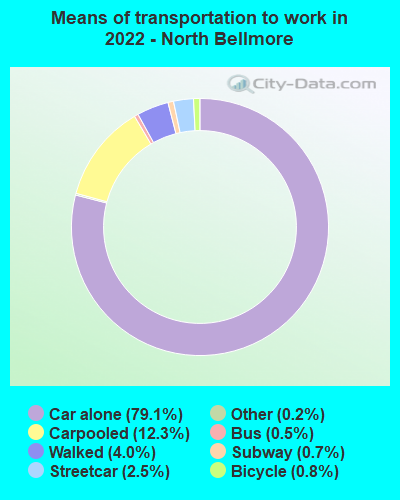
Means of transportation to work:
Drove a car alone: 2,287 (50.5%)Carpooled: 344 (7.6%)Bus : 14 (0.3%)Subway or elevated rail : 62 (1.4%)Long-distance train or commuter rail : 17 (0.4%)Taxi: 9 (0.2%)Bicycle: 35 (0.8%)Walked: 123 (2.7%)Worked at home: 1,816 (40.1%)
Unemployment by race in 2022
Unemployment rate for White non-Hispanic residents 5.0% Males1.1% FemalesUnemployment rate for Asian residents 1.9% MalesUnemployment rate for Hispanic or Latino residents 1.8% Males
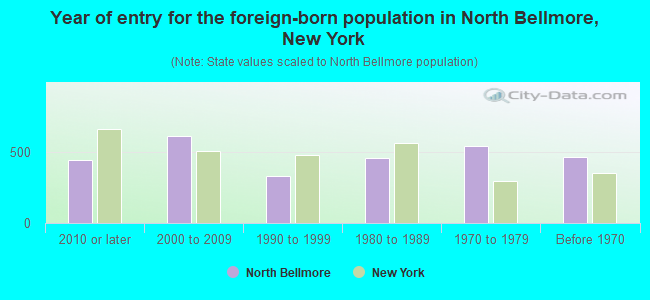
Year of entry for the foreign-born population in North Bellmore, New York
446 2010 or later 614 2000 to 2009 333 1990 to 1999 461 1980 to 1989 546 1970 to 1979 466 Before 1970
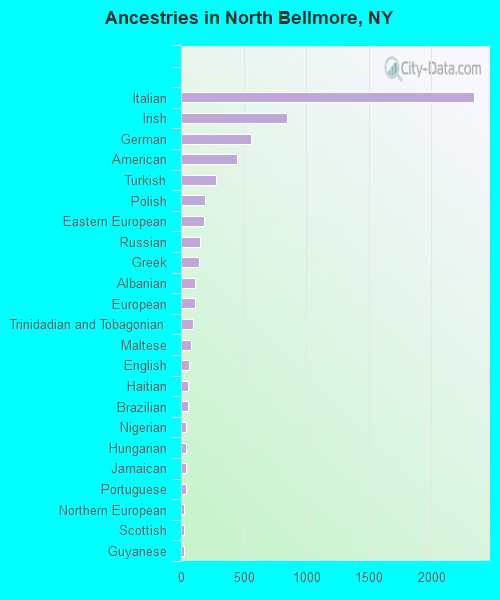
First ancestries reported:
Italian: 2,343 (27.2%)
Irish: 846 (9.8%)
German: 557 (6.5%)
American: 444 (5.1%)
Turkish: 280 (3.2%)
Polish: 192 (2.2%)
Eastern European: 186 (2.2%)
Russian: 151 (1.8%)
Greek: 143 (1.7%)
Albanian: 115 (1.3%)
European: 109 (1.3%)
Trinidadian and Tobagonian: 92 (1.1%)
Maltese: 78 (0.9%)
English: 60 (0.7%)
Haitian: 56 (0.6%)
Brazilian: 52 (0.6%)
Nigerian: 42 (0.5%)
Hungarian: 40 (0.5%)
Jamaican: 40 (0.5%)
Portuguese: 39 (0.5%)
Northern European: 26 (0.3%)
Scottish: 26 (0.3%)
Guyanese: 23 (0.3%)
Lithuanian: 20 (0.2%)
Scotch-Irish: 20 (0.2%)
Syrian: 19 (0.2%)
Egyptian: 18 (0.2%)
Ghanaian: 17 (0.2%)
Finnish: 11 (0.1%)
Swedish: 9 (0.1%)
Canadian: 8 (0.09%) Most common places of birth for foreign-born residents (%): China, excluding Hong Kong and Taiwan North Bellmore:
10.9% (266)New York:
9.1% (410,910)
Japan North Bellmore:
6.9% (168)New York:
0.6% (28,472)
Colombia North Bellmore:
5.9% (144)New York:
2.5% (111,920)
Argentina North Bellmore:
5.4% (131)New York:
0.5% (21,928)
Philippines North Bellmore:
5.1% (124)New York:
2.0% (91,070)
El Salvador North Bellmore:
5.0% (123)New York:
2.4% (108,067)
Poland North Bellmore:
5.0% (122)New York:
1.4% (65,102)
Dominican Republic North Bellmore:
4.7% (114)New York:
11.1% (501,040)
Other Eastern Europe North Bellmore:
4.6% (113)New York:
0.7% (30,173)
Turkey North Bellmore:
4.4% (107)New York:
0.5% (21,009)
Pakistan North Bellmore:
4.2% (103)New York:
1.4% (62,442)
Italy North Bellmore:
3.2% (77)New York:
1.8% (81,374)
India North Bellmore:
3.1% (76)New York:
3.5% (158,432)
Trinidad and Tobago North Bellmore:
3.0% (74)New York:
2.0% (91,428)
Honduras North Bellmore:
2.9% (71)New York:
1.2% (55,571)
Haiti North Bellmore:
2.7% (67)New York:
2.8% (126,936)
Greece North Bellmore:
2.7% (66)New York:
0.6% (28,604)
Brazil North Bellmore:
2.7% (66)New York:
0.7% (30,658)
Ecuador North Bellmore:
2.0% (50)New York:
3.9% (177,448)
Chile North Bellmore:
1.6% (40)New York:
0.3% (11,831)
Guyana North Bellmore:
1.5% (37)New York:
3.8% (172,129)
Place of birth for U.S.-born residents:
This state: 17,319Other state: 812Northeast: 329Midwest: 133South: 251West: 95 94.2% of North Bellmore residents lived in the same house 1 years ago.
Out of people who lived in different houses, 36.4% lived in this county.
Out of people who lived in different counties, 92.4% lived in New York.
North Bellmore:
94.2%State average:
89.6%
Education attainment for males 25 years and older:
No schooling: 20Nursery to 4th grade: 05th and 6th grade: 207th and 8th grade: 229th grade: 010th grade: 6011th grade: 012th grade, no diploma: 82High school graduate (or equivalency): 1,755Less than 1 year of college: 642Some college more than 1 year, no degree: 762Associate degree: 797Bachelor's degree: 2,219Master's degree: 1,193Professional school degree: 223Doctorate degree: 61
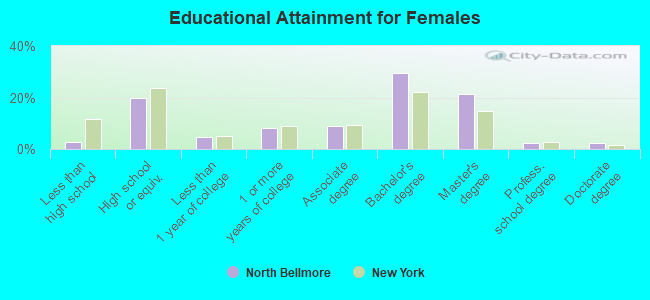
Education attainment for females 25 years and older:
No schooling: 4Nursery to 4th grade: 05th and 6th grade: 27th and 8th grade: 09th grade: 910th grade: 1911th grade: 2012th grade, no diploma: 146High school graduate (or equivalency): 1,388Less than 1 year of college: 322Some college more than 1 year, no degree: 579Associate degree: 637Bachelor's degree: 2,082Master's degree: 1,508Professional school degree: 172Doctorate degree: 154
Housing units in structures:
One, detached: 6,262One, attached: 75Two: 2263 or 4: 555 to 9: 810 to 19: 4920 to 49: 41House/condo owner moved in on average 20 years ago
Renter moved in on average 6 years ago
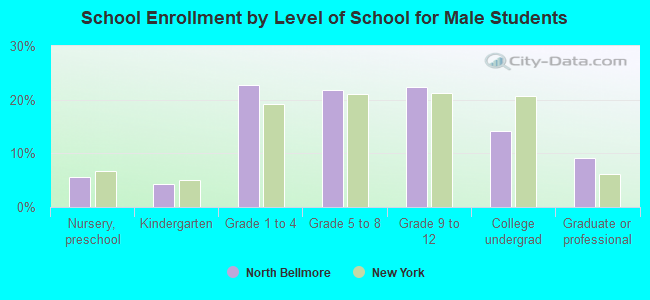
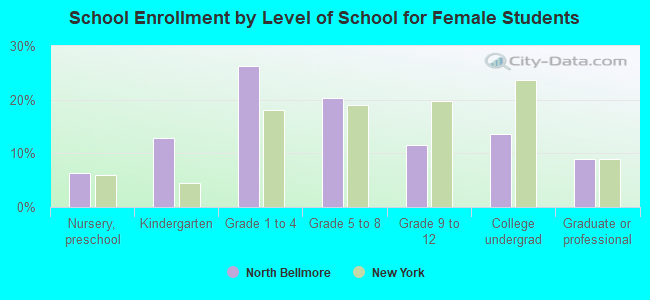
Private vs. public school enrollment:
Students in private schools in grades 1 to 8 (elementary and middle school): 136 Students in private schools in grades 9 to 12 (high school): 27 Students in private undergraduate colleges: 224