North Laurel, MD (Maryland) Houses and Residents
| North Laurel: | $454,433 |
| Maryland: | $398,100 |
Mean price in 2022:
Detached houses: $549,419
Here: $549,419 State: $526,819 Townhouses or other attached units: $432,635
Here: $432,635 State: $328,305 In 5-or-more-unit structures: $197,600
Here: $197,600 State: $350,378 Mobile homes: $123,217
Here: $123,217 State: $89,353
Total population: 4,474 (All urban)
Houses: 9,026 (8,823 occupied: 5,635 owner occupied, 3,179 renter occupied)
| % of renters here: | 36% |
| State: | 32% |
Housing density: 885 houses/condos per square mile
Median price asked for vacant for-sale houses and condos in 2022: $1,028,604.
Median contract rent in 2022: $1,752 (lower quartile is $1,590, upper quartile is $1,931)
Median rent asked for vacant for-rent units in 2022: $1,745
Median gross rent in North Laurel, MD in 2022: $1,867
Housing units in North Laurel with a mortgage: 4,307 (449 second mortgage, 8 home equity loan, 345 both second mortgage and home equity loan)
Houses without a mortgage: 34
Median household income for houses/condos with a mortgage: $163,132
Median household income for apartments without a mortgage: $92,978
Median monthly housing costs: $1,909
Compare current foreclosures near North Laurel, MD:
| Photo | Address | Area | Beds / Baths | Price | Details |
|---|---|---|---|---|---|

|
#1
E Ostend St
Baltimore, MD 21230
|
1,470 sq. feet
|
2 baths 2 beds |
$379,900
|
show details |

|
#2
Light St
Baltimore, MD 21230
|
1,554 sq. feet
|
1 baths 2 beds |
$254,900
|
show details |

|
#3
Heming Ln
Bowie, MD 20716
|
1,800 sq. feet
|
2 baths 3 beds |
$400,000
|
show details |

|
#4
Rayner Ave
Baltimore, MD 21216
|
1,456 sq. feet
|
1 baths 3 beds |
$42,900
|
show details |

|
#5
Wicklow Rd
Baltimore, MD 21229
|
1,152 sq. feet
|
1 baths 3 beds |
$112,000
|
show details |

|
#6
Hammersmith Cir
Silver Spring, MD 20906
|
1,152 sq. feet
|
1 baths 3 beds |
$328,600
|
show details |

|
#7
Pooks Hill Rd Apt 1612s
Bethesda, MD 20814
|
1,250 sq. feet
|
1 baths 2 beds |
$289,000
|
show details |

|
#8
Buchanan St NE
Washington, DC 20017
|
1,240 sq. feet
|
2 baths 3 beds |
$325,000
|
show details |

|
#9
Mandan Rd Apt 103 Unit 621
Greenbelt, MD 20770
|
1,420 sq. feet
|
2 baths 3 beds |
$179,900
|
show details |

|
#10
Fitzgibbon Ct
Bowie, MD 20721
|
1,300 sq. feet
|
2 baths 3 beds |
$369,200
|
show details |
| Photo | Address | Area | Beds / Baths | Price | Details |
|---|---|---|---|---|---|

|
#11
Washington Blvd
Baltimore, MD 21230
|
960 sq. feet
|
1 baths 2 beds |
$64,900
|
show details |

|
#12
Addison Rd
Capitol Heights, MD 20743
|
1,400 sq. feet
|
1 baths 3 beds |
$260,000
|
show details |

|
#13
Monroe St NW
Washington, DC 20010
|
- sq. feet
|
2 baths 2 beds |
$665,000
|
show details |

|
#14
Brooke Knolls Rd
Gaithersburg, MD 20882
|
1,704 sq. feet
|
3 baths 4 beds |
$681,500
|
show details |

|
#15
Eastern Ave NE
Washington, DC 20011
|
1,024 sq. feet
|
1 baths 3 beds |
$395,000
|
show details |

|
#16
3rd St
Lanham, MD 20706
|
1,104 sq. feet
|
2 baths 3 beds |
$369,200
|
show details |

|
#17
Elkhorn Ln
Bowie, MD 20716
|
1,514 sq. feet
|
2 baths 3 beds |
$415,000
|
show details |

|
#18
Interlachen Dr Apt 111
Silver Spring, MD 20906
|
965 sq. feet
|
1 baths 2 beds |
$148,000
|
show details |

|
#19
Braden Loop
Glen Burnie, MD 21061
|
2,513 sq. feet
|
2 baths 3 beds |
show details | |

|
#20
5th St
Brooklyn, MD 21225
|
1,232 sq. feet
|
1 baths - beds |
$49,900
|
show details |
| Photo | Address | Area | Beds / Baths | Price | Details |
|---|---|---|---|---|---|

|
#21
Sargent Rd NE
Washington, DC 20017
|
1,360 sq. feet
|
2 baths 3 beds |
show details | |

|
#22
Lohrs Ln
Baltimore, MD 21229
|
840 sq. feet
|
1 baths 2 beds |
show details | |

|
#23
Riding Crop Way
Windsor Mill, MD 21244
|
1,160 sq. feet
|
2 baths 2 beds |
show details | |

|
#24
Oakland Mills Rd
Columbia, MD 21046
|
- sq. feet
|
3 baths 4 beds |
show details | |

|
#25
Deanwood Dr
Capitol Heights, MD 20743
|
640 sq. feet
|
1 baths 1 beds |
show details | |

|
#26
Cromwell St
Brooklyn, MD 21225
|
1,594 sq. feet
|
2 baths 3 beds |
show details | |

|
#27
Sycamore St
Curtis Bay, MD 21226
|
960 sq. feet
|
1 baths 3 beds |
show details | |

|
#28
Grant St NE
Washington, DC 20019
|
1,152 sq. feet
|
1 baths 3 beds |
show details | |

|
#29
Hillvale Rd
Baltimore, MD 21229
|
1,024 sq. feet
|
1 baths 3 beds |
show details | |

|
#30
Jefferson St NW
Washington, DC 20011
|
1,280 sq. feet
|
5 baths 6 beds |
show details |
| Photo | Address | Area | Beds / Baths | Price | Details |
|---|---|---|---|---|---|

|
#31
Avena St
Silver Spring, MD 20902
|
1,188 sq. feet
|
2 baths 3 beds |
show details | |

|
#32
Myrtle Ave
Bowie, MD 20720
|
3,436 sq. feet
|
2 baths 4 beds |
show details | |

|
#33
55th Ave
Bladensburg, MD 20710
|
1,023 sq. feet
|
3 baths 5 beds |
show details | |

|
#34
Eddy Rd
Crownsville, MD 21032
|
1,100 sq. feet
|
2 baths 2 beds |
show details | |

|
#35
Henderson Chapel Ln
Bowie, MD 20720
|
4,002 sq. feet
|
3 baths 4 beds |
show details | |

|
#36
Brooke Rd
Sandy Spring, MD 20860
|
5,046 sq. feet
|
4 baths 4 beds |
show details | |

|
#37
Gwynns Falls Pkwy
Baltimore, MD 21216
|
1,200 sq. feet
|
3 baths 4 beds |
show details | |

|
#38
Parke West Dr
Glen Burnie, MD 21061
|
1,488 sq. feet
|
2 baths 3 beds |
show details | |

|
#39
Dogwood Rd
Gwynn Oak, MD 21207
|
2,456 sq. feet
|
3 baths 5 beds |
show details | |

|
#40
Elsinore Ave
Baltimore, MD 21216
|
1,644 sq. feet
|
2 baths 4 beds |
show details |
| Photo | Address | Area | Beds / Baths | Price | Details |
|---|---|---|---|---|---|

|
#41
S Calhoun St
Baltimore, MD 21223
|
936 sq. feet
|
1 baths 3 beds |
show details | |

|
#42
Walnut Ave
Baltimore, MD 21229
|
1,008 sq. feet
|
1 baths 3 beds |
show details | |

|
#43
Manor Ln
Ellicott City, MD 21042
|
864 sq. feet
|
1 baths 2 beds |
show details | |

|
#44
Pennington Ave
Curtis Bay, MD 21226
|
960 sq. feet
|
1 baths 2 beds |
show details | |

|
#45
Marksworth Rd
Gwynn Oak, MD 21207
|
1,720 sq. feet
|
3 baths 3 beds |
show details | |

|
#46
N Carey St
Baltimore, MD 21217
|
1,632 sq. feet
|
2 baths 4 beds |
show details | |

|
#47
Scaffold Way
Odenton, MD 21113
|
1,664 sq. feet
|
4 baths 4 beds |
show details | |

|
#48
Langford Rd
Gwynn Oak, MD 21207
|
1,292 sq. feet
|
1 baths 3 beds |
show details | |

|
#49
Clifton Ave
Baltimore, MD 21217
|
- sq. feet
|
1 baths 3 beds |
show details | |

|
Check over 1 million property listings on Foreclosure.com!
|
browse all offers | |||


Median year apartment built: 1996
Household type by relationship:
Households: 24,664- Male householders: 4,173 (679 living alone), Female householders: 4,571 (1,062 living alone)
4,784 spouses (4,766 opposite-sex spouses), 491 unmarried partners, (476 opposite-sex unmarried partners), 8,129 children (7,989 natural, 36 adopted, 103 stepchildren), 187 grandchildren, 436 brothers or sisters, 620 parents, 0 foster children, 578 other relatives, 684 non-relatives
- In group quarters: 5
Size of family households: 2,397 2-persons, 1,315 3-persons, 1,524 4-persons, 531 5-persons, 220 6-persons, 129 7-or-more-persons.
Size of nonfamily households: 1,789 1-person, 961 2-persons.
4,190 married couples with children.
1,409 single-parent households (223 men, 1,186 women).
62.7% of residents of North Laurel speak English at home.
10.6% of residents speak Spanish at home (67% speak English very well, 16% speak English well, 13% speak English not well, 3% don't speak English at all).
12.3% of residents speak other Indo-European language at home (69% speak English very well, 14% speak English well, 9% speak English not well, 7% don't speak English at all).
5.7% of residents speak Asian or Pacific Island language at home (68% speak English very well, 15% speak English well, 17% speak English not well).
10.3% of residents speak other language at home (84% speak English very well, 7% speak English well, 9% speak English not well).
Foreign born population: 7,305 (29.6%)
(60.0% of them are naturalized citizens)
| Here: | 6.9 |
| State: | 7.3 |
| Here: | 4.0 |
| State: | 4.2 |

- Bedrooms in owner-occupied houses and condos in North Laurel, Maryland
- 0no bedroom
- 01 bedroom
- 7862 bedrooms
- 2,6033 bedrooms
- 1,6164 bedrooms
- 6305+ bedrooms

- Bedrooms in renter-occupied apartments in North Laurel, Maryland
- 0no bedroom
- 6141 bedroom
- 1,9772 bedrooms
- 4823 bedrooms
- 914 bedrooms
- 165+ bedrooms

- Cars and other vehicles available in North Laurel in owner-occupied houses/condos
- 212no vehicle
- 1,2931 vehicle
- 2,9452 vehicles
- 8183 vehicles
- 2404 vehicles
- 1275+ vehicles

- Cars and other vehicles available in North Laurel in renter-occupied apartments
- 99no vehicle
- 1,4841 vehicle
- 1,3792 vehicles
- 1473 vehicles
- 714 vehicles
- 05+ vehicles

- Rooms in owner-occupied houses in North Laurel, Maryland
- 01 room
- 02 rooms
- 703 rooms
- 3534 rooms
- 6725 rooms
- 1,3356 rooms
- 8927 rooms
- 6248 rooms
- 1,6889+ rooms

- Rooms in renter-occupied apartments in North Laurel, Maryland
- 01 room
- 1852 rooms
- 6793 rooms
- 1,3474 rooms
- 3585 rooms
- 4216 rooms
- 387 rooms
- 1158 rooms
- 369+ rooms


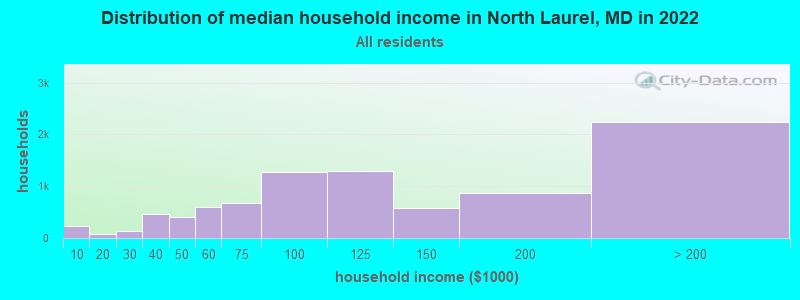
North Laurel, MD household income distribution

- 233Less than $10,000
- 70$10,000 to $19,999
- 137$20,000 to $29,999
- 462$30,000 to $39,999
- 407$40,000 to $49,999
- 605$50,000 to $59,999
- 666$60,000 to $74,999
- 1,273$75,000 to $99,999
- 1,300$100,000 to $124,999
- 586$125,000 to $149,999
- 873$150,000 to $199,999
- 2,239$200,000 or more
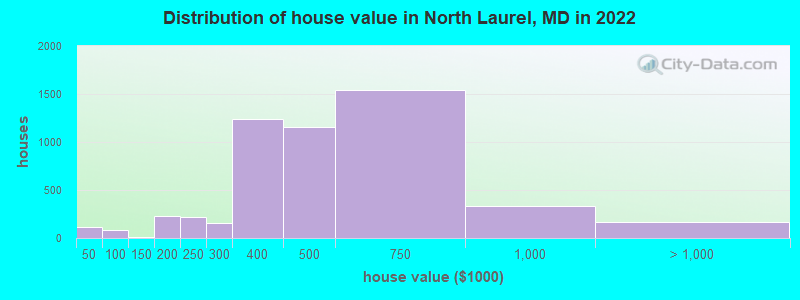
Home value of owner - occupied houses in 2022 in North Laurel, MD
-
- 5Less than $10,000
- 47$30,000 to $34,999
- 15$35,000 to $39,999
- 43$40,000 to $49,999
- 28$50,000 to $59,999
- 12$60,000 to $69,999
- 11$100,000 to $124,999
- 166$150,000 to $174,999
- 67$175,000 to $199,999
- 221$200,000 to $249,999
- 151$250,000 to $299,999
- 1,236$300,000 to $399,999
- 1,152$400,000 to $499,999
- 1,537$500,000 to $749,999
- 333$750,000 to $999,999
- 137$1,000,000 to $1,499,999
- 29$2,000,000 or more
Rent paid by renters in 2022 in North Laurel, MD
-
- 7$450 to $499
- 10$650 to $699
- 53$800 to $899
- 65$900 to $999
- 88$1,000 to $1,249
- 257$1,250 to $1,499
- 2,140$1,500 to $1,999
- 233$2,000 to $2,499
- 65$2,500 to $2,999
- 80$3,000 to $3,499
- 9$3,500 or more
- 40No cash rent


Percentage of workers working in this county: 43.5%
Number of people working at home: 2,826 (20.3% of all workers)
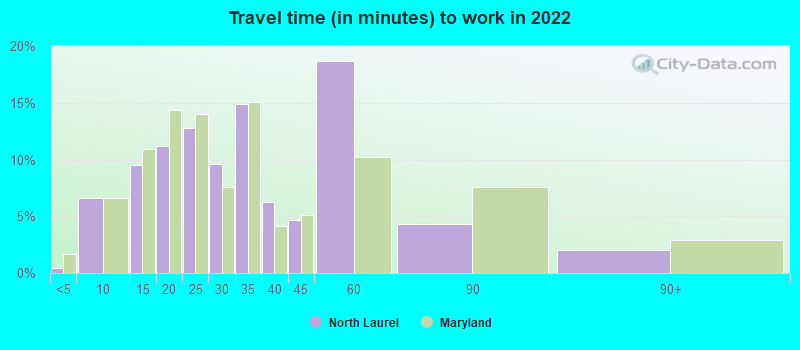
Travel time to work (commute)
- Less than 5 minutes: 161
- 5 to 9 minutes: 407
- 10 to 14 minutes: 1,043
- 15 to 19 minutes: 1,302
- 20 to 24 minutes: 1,293
- 25 to 29 minutes: 1,386
- 30 to 34 minutes: 1,708
- 35 to 39 minutes: 702
- 40 to 44 minutes: 699
- 45 to 59 minutes: 1,298
- 60 to 89 minutes: 775
- 90 or more minutes: 181
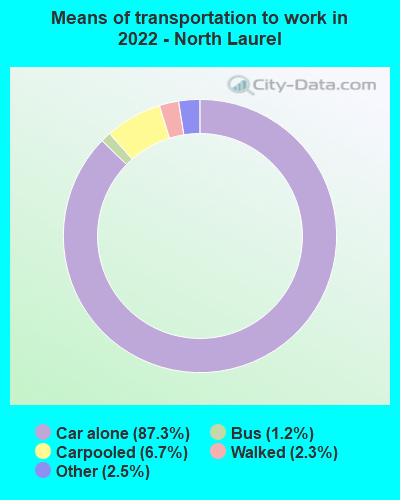
Means of transportation to work:
- Drove a car alone: 4,555 (58.4%)
- Carpooled: 402 (5.2%)
- Bus: 51 (0.7%)
- Taxi: 120 (1.5%)
- Walked: 95 (1.2%)
- Worked at home: 2,826 (36.2%)

- Unemployment by race in 2022
- Unemployment rate for White non-Hispanic residents
- 1.4%Males
- 6.5%Females
- Unemployment rate for Black residents
- 2.5%Males
- 0.6%Females
- Unemployment rate for Asian residents
- 1.9%Males
- 2.4%Females
- Unemployment rate for other race residents
- 1.7%Females
- Unemployment rate for two or more race residents
- 2.6%Males
- 2.7%Females
- Unemployment rate for Hispanic or Latino residents
- 0.8%Males
- 1.2%Females

- Year of entry for the foreign-born population in North Laurel, Maryland
- 2,3992010 or later
- 1,6662000 to 2009
- 1,7921990 to 1999
- 8911980 to 1989
- 5091970 to 1979
- 239Before 1970

First ancestries reported:
- Nigerian: 987 (6.3%)
- African: 932 (5.9%)
- American: 555 (3.5%)
- Russian: 460 (2.9%)
- Ethiopian: 397 (2.5%)
- German: 395 (2.5%)
- Irish: 387 (2.5%)
- Brazilian: 327 (2.1%)
- English: 287 (1.8%)
- Italian: 270 (1.7%)
- Jamaican: 247 (1.6%)
- Swedish: 243 (1.5%)
- Ghanaian: 143 (0.9%)
- European: 140 (0.9%)
- Iranian: 138 (0.9%)
- Sierra Leonean: 136 (0.9%)
- Egyptian: 64 (0.4%)
- Romanian: 62 (0.4%)
- Palestinian: 56 (0.4%)
- Eastern European: 56 (0.4%)
- Haitian: 56 (0.4%)
- Jordanian: 53 (0.3%)
- Scottish: 53 (0.3%)
- Scandinavian: 51 (0.3%)
- French Canadian: 48 (0.3%)
- Polish: 45 (0.3%)
- Sudanese: 42 (0.3%)
- Australian: 35 (0.2%)
- French: 33 (0.2%)
- Lithuanian: 31 (0.2%)
- Norwegian: 30 (0.2%)
- Guyanese: 27 (0.2%)
- South African: 27 (0.2%)
- Northern European: 26 (0.2%)
- Syrian: 25 (0.2%)
- West Indian: 22 (0.1%)
- Hungarian: 21 (0.1%)
- Czech: 18 (0.1%)
- Slovak: 13 (0.08%)
- Austrian: 11 (0.07%)
- Liberian: 10 (0.06%)
- British: 9 (0.06%)
- Afghan: 8 (0.05%)
- Lebanese: 6 (0.04%)
Most common places of birth for foreign-born residents (%):
| North Laurel: | 12.4% (909) |
| Maryland: | 6.4% (61,725) |
| North Laurel: | 9.5% (700) |
| Maryland: | 4.6% (44,825) |
| North Laurel: | 5.1% (377) |
| Maryland: | 0.7% (6,326) |
| North Laurel: | 5.0% (371) |
| Maryland: | 1.8% (17,774) |
| North Laurel: | 4.7% (346) |
| Maryland: | 12.0% (115,412) |
| North Laurel: | 4.5% (333) |
| Maryland: | 3.8% (36,698) |
| North Laurel: | 4.0% (297) |
| Maryland: | 4.4% (42,350) |
| North Laurel: | 3.6% (267) |
| Maryland: | 1.2% (11,980) |
| North Laurel: | 3.4% (251) |
| Maryland: | 3.4% (32,635) |
| North Laurel: | 2.7% (201) |
| Maryland: | 0.6% (5,959) |
| North Laurel: | 2.7% (200) |
| Maryland: | 3.2% (30,870) |
| North Laurel: | 2.6% (188) |
| Maryland: | 0.2% (1,757) |
| North Laurel: | 2.5% (187) |
| Maryland: | 1.1% (10,233) |
| North Laurel: | 2.5% (182) |
| Maryland: | 1.8% (17,037) |
| North Laurel: | 2.4% (178) |
| Maryland: | 1.0% (9,481) |
| North Laurel: | 2.1% (154) |
| Maryland: | 4.6% (44,742) |
| North Laurel: | 2.0% (145) |
| Maryland: | 1.2% (11,265) |
| North Laurel: | 1.9% (140) |
| Maryland: | 1.3% (12,074) |
| North Laurel: | 1.8% (133) |
| Maryland: | 3.5% (34,065) |
| North Laurel: | 1.7% (123) |
| Maryland: | 0.5% (4,888) |
| North Laurel: | 1.6% (118) |
| Maryland: | 2.8% (27,444) |
| North Laurel: | 1.6% (115) |
| Maryland: | 2.5% (24,026) |
| North Laurel: | 1.6% (115) |
| Maryland: | 1.4% (13,947) |
Place of birth for U.S.-born residents:
- This state: 8,780
- Other state: 8,285
- Northeast: 2,247
- Midwest: 837
- South: 4,920
- West: 405
88.3% of North Laurel residents lived in the same house 1 years ago.
Out of people who lived in different houses, 14.5% lived in this county.
Out of people who lived in different counties, 65.6% lived in Maryland.
| North Laurel: | 88.3% |
| State average: | 88.5% |
Education attainment for males 25 years and older:
- No schooling: 269
- Nursery to 4th grade: 42
- 5th and 6th grade: 64
- 7th and 8th grade: 12
- 9th grade: 44
- 10th grade: 6
- 11th grade: 89
- 12th grade, no diploma: 135
- High school graduate (or equivalency): 1,072
- Less than 1 year of college: 395
- Some college more than 1 year, no degree: 713
- Associate degree: 368
- Bachelor's degree: 2,200
- Master's degree: 1,493
- Professional school degree: 306
- Doctorate degree: 261

Education attainment for females 25 years and older:
- No schooling: 85
- Nursery to 4th grade: 75
- 5th and 6th grade: 120
- 7th and 8th grade: 24
- 9th grade: 18
- 10th grade: 59
- 11th grade: 0
- 12th grade, no diploma: 110
- High school graduate (or equivalency): 1,261
- Less than 1 year of college: 172
- Some college more than 1 year, no degree: 756
- Associate degree: 612
- Bachelor's degree: 3,136
- Master's degree: 1,527
- Professional school degree: 471
- Doctorate degree: 368


Housing units in structures:
- One, detached: 3,124
- One, attached: 3,491
- Two: 29
- 3 or 4: 116
- 5 to 9: 505
- 10 to 19: 1,138
- 20 to 49: 260
- 50 or more: 224
- Mobile homes: 65
- Boats, RVs, vans, etc.: 70
Housing units lacking complete kitchen facilities in 2022: 0.2%
House/condo owner moved in on average 10 years ago
Renter moved in on average 3 years ago

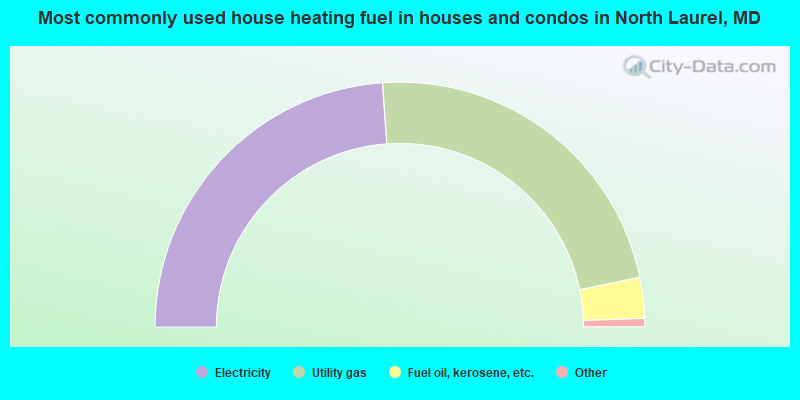
- 47.7%Electricity
- 45.7%Utility gas
- 5.4%Fuel oil, kerosene, etc.
- 0.5%Solar energy
- 0.4%Bottled, tank, or LP gas
- 0.2%Other fuel
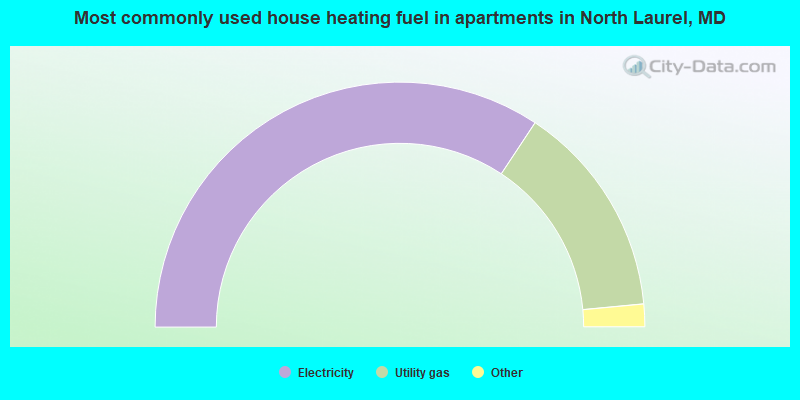
- 68.6%Electricity
- 28.4%Utility gas
- 1.6%Solar energy
- 0.8%Bottled, tank, or LP gas
- 0.6%Fuel oil, kerosene, etc.
Private vs. public school enrollment:
| Here: | 7.3% |
| Maryland: | 15.2% |
| Here: | 12.7% |
| Maryland: | 14.4% |
| Here: | 11.7% |
| Maryland: | 20.2% |


