North Logan, UT (Utah) Houses and Residents
| North Logan: | $539,882 |
| Utah: | $499,500 |
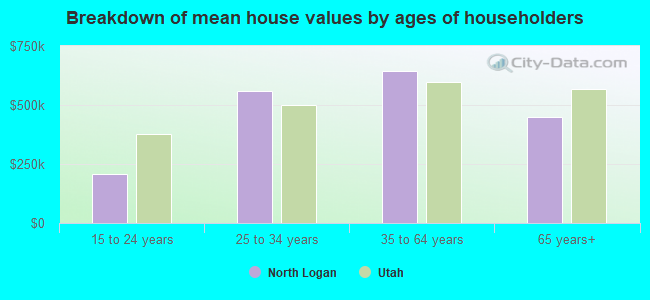
Mean price in 2022:
Detached houses: $599,192
Here: $599,192 State: $607,750 Townhouses or other attached units: $360,225
Here: $360,225 State: $444,505 Mobile homes: $33,847
Here: $33,847 State: $113,475
Total population: 9,874 (Urban population: 5,702, Rural population: 391 (all nonfarm))
Houses: 4,008 (3,753 occupied: 2,179 owner occupied, 1,653 renter occupied)
| % of renters here: | 43% |
| State: | 29% |
Housing density: 579 houses/condos per square mile
Median price asked for vacant for-sale houses and condos in 2022: $2,131,098.
Median contract rent in 2022: $1,565 (lower quartile is $1,106, upper quartile is $1,713)
Median rent asked for vacant for-rent units in 2022: $1,546
Median gross rent in North Logan, UT in 2022: $1,640
Housing units in North Logan with a mortgage: 1,310 (63 second mortgage, 0 home equity loan, 49 both second mortgage and home equity loan)
Houses without a mortgage: 25
Median household income for houses/condos with a mortgage: $129,567
Median household income for apartments without a mortgage: $92,474
Median monthly housing costs: $1,503
Compare current foreclosures near North Logan, UT:
| Photo | Address | Area | Beds / Baths | Price | Details |
|---|---|---|---|---|---|

|
#1
800 East
Logan, UT 84341
|
1,013 sq. feet
|
1 baths 3 beds |
show details | |

|
#2
N 400 E
Logan, UT 84341
|
- sq. feet
|
- baths - beds |
show details | |

|
#3
S 200 E
Clarkston, UT 84305
|
1,476 sq. feet
|
- baths - beds |
show details | |

|
#4
South 1220 East
Paradise, UT 84328
|
1,692 sq. feet
|
- baths - beds |
show details | |

|
#5
E 2200 N
Logan, UT 84341
|
- sq. feet
|
- baths - beds |
show details | |

|
#6
W 15 S, Unit G301
Providence, UT 84332
|
- sq. feet
|
- baths - beds |
show details | |

|
#7
W 540 S
Providence, UT 84332
|
- sq. feet
|
- baths - beds |
show details | |

|
#8
E 720 N
Smithfield, UT 84335
|
- sq. feet
|
- baths - beds |
show details | |

|
#9
E 630 N, Apt 10
Smithfield, UT 84335
|
- sq. feet
|
- baths - beds |
show details | |

|
#10
N 3200 W
Smithfield, UT 84335
|
- sq. feet
|
- baths - beds |
show details |
| Photo | Address | Area | Beds / Baths | Price | Details |
|---|---|---|---|---|---|

|
#11
S Main St
Logan, UT 84321
|
- sq. feet
|
- baths - beds |
show details | |

|
#12
W 300 N
Smithfield, UT 84335
|
- sq. feet
|
- baths - beds |
show details | |

|
#13
Ginger Cir
Logan, UT 84321
|
- sq. feet
|
- baths - beds |
show details | |

|
#14
W 800 S
Logan, UT 84321
|
- sq. feet
|
- baths - beds |
show details | |

|
#15
W 100 N, Trlr 14
Smithfield, UT 84335
|
- sq. feet
|
- baths - beds |
show details | |

|
#16
E 200 N
Smithfield, UT 84335
|
- sq. feet
|
- baths - beds |
show details | |

|
#17
W 200 S
Smithfield, UT 84335
|
- sq. feet
|
- baths - beds |
show details | |

|
#18
N 850 E
Providence, UT 84332
|
- sq. feet
|
- baths - beds |
show details | |

|
#19
N 100 E
Smithfield, UT 84335
|
- sq. feet
|
- baths - beds |
show details | |

|
#20
S 1100 W Unit 33
Logan, UT 84321
|
- sq. feet
|
- baths - beds |
show details |
| Photo | Address | Area | Beds / Baths | Price | Details |
|---|---|---|---|---|---|

|
#21
E Spring Creek Pkwy
Providence, UT 84332
|
- sq. feet
|
- baths - beds |
show details | |

|
#22
N 100 E
Providence, UT 84332
|
- sq. feet
|
- baths - beds |
show details | |

|
#23
Knowles Ln
Logan, UT 84321
|
- sq. feet
|
- baths - beds |
show details | |

|
#24
E 200 S
Smithfield, UT 84335
|
- sq. feet
|
- baths - beds |
show details | |

|
#25
N 100 E
Providence, UT 84332
|
- sq. feet
|
- baths - beds |
show details | |

|
#26
W 600 S
Logan, UT 84321
|
- sq. feet
|
- baths - beds |
show details | |

|
#27
E 700 S
Logan, UT 84321
|
- sq. feet
|
- baths - beds |
show details | |

|
#28
S 100 E
Logan, UT 84321
|
- sq. feet
|
- baths - beds |
show details | |

|
#29
Bessie Ln
Providence, UT 84332
|
- sq. feet
|
- baths - beds |
show details | |

|
#30
W 2200 S # B108
Logan, UT 84321
|
- sq. feet
|
- baths - beds |
show details |
| Photo | Address | Area | Beds / Baths | Price | Details |
|---|---|---|---|---|---|

|
#31
S 1000 W
Logan, UT 84321
|
- sq. feet
|
- baths - beds |
show details | |

|
#32
S 100 W
Richmond, UT 84333
|
- sq. feet
|
- baths - beds |
show details | |

|
#33
N Highway 38
Honeyville, UT 84314
|
- sq. feet
|
- baths - beds |
show details | |

|
#34
N 1600 W
Lewiston, UT 84320
|
- sq. feet
|
- baths - beds |
show details | |

|
#35
Park Ave
Lewiston, UT 84320
|
- sq. feet
|
- baths - beds |
show details | |

|
#36
E 200 S
Lewiston, UT 84320
|
- sq. feet
|
- baths - beds |
show details | |

|
#37
E Main St # B
Wellsville, UT 84339
|
- sq. feet
|
- baths - beds |
show details | |

|
#38
S 200 E
Wellsville, UT 84339
|
- sq. feet
|
- baths - beds |
show details | |

|
#39
N State St Unit 25
Richmond, UT 84333
|
- sq. feet
|
- baths - beds |
show details | |

|
#40
S 690 E
Hyrum, UT 84319
|
- sq. feet
|
- baths - beds |
show details |
| Photo | Address | Area | Beds / Baths | Price | Details |
|---|---|---|---|---|---|

|
#41
E 400 S
Hyrum, UT 84319
|
- sq. feet
|
- baths - beds |
show details | |

|
#42
N 185 E
Richmond, UT 84333
|
- sq. feet
|
- baths - beds |
show details | |

|
#43
N 400 W
Hyrum, UT 84319
|
- sq. feet
|
- baths - beds |
show details | |

|
#44
E 500 N
Providence, UT 84332
|
- sq. feet
|
- baths - beds |
show details | |

|
#45
W 100 N
Hyrum, UT 84319
|
- sq. feet
|
- baths - beds |
show details | |

|
#46
W Highway 101
Hyrum, UT 84319
|
- sq. feet
|
- baths - beds |
show details | |

|
#47
N 500 W
Hyrum, UT 84319
|
- sq. feet
|
- baths - beds |
show details | |

|
#48
Richcrest Drive
Hyrum, UT 84319
|
- sq. feet
|
- baths - beds |
show details | |

|
#49
W 760 S
Mendon, UT 84325
|
- sq. feet
|
- baths - beds |
show details | |

|
Check over 1 million property listings on Foreclosure.com!
|
browse all offers | |||


 | Why public high schools rated poorly? (19 replies) |
| Microclimates in Cache Valley (3 replies) |
| Logan: Any surrounding areas above the inversion layer? (14 replies) |
| Life in Logan Utah (21 replies) |
| Moving to Logan (4 replies) |
| New LOGAN Residents Discussion (26 replies) |
Median year apartment built: 2006
Household type by relationship:
Households: 11,450- Male householders: 1,859 (204 living alone), Female householders: 1,838 (433 living alone)
1,975 spouses (1,933 opposite-sex spouses), 176 unmarried partners, (159 opposite-sex unmarried partners), 4,011 children (3,805 natural, 9 adopted, 196 stepchildren), 122 grandchildren, 168 brothers or sisters, 87 parents, 0 foster children, 139 other relatives, 935 non-relatives
- In group quarters: 135
Size of family households: 886 2-persons, 538 3-persons, 396 4-persons, 380 5-persons, 187 6-persons, 187 7-or-more-persons.
Size of nonfamily households: 698 1-person, 261 2-persons, 314 3-persons, 7 4-persons.
2,696 married couples with children.
229 single-parent households (87 men, 142 women).
89.5% of residents of North Logan speak English at home.
6.9% of residents speak Spanish at home (64% speak English very well, 26% speak English well, 4% speak English not well, 6% don't speak English at all).
0.4% of residents speak other Indo-European language at home (100% speak English very well).
3.1% of residents speak Asian or Pacific Island language at home (48% speak English very well, 44% speak English well, 8% speak English not well).
0.2% of residents speak other language at home (100% speak English very well).
Foreign born population: 856 (7.5%)
(54.1% of them are naturalized citizens)
| Here: | 10.0 |
| State: | 7.6 |
| Here: | 4.2 |
| State: | 4.3 |
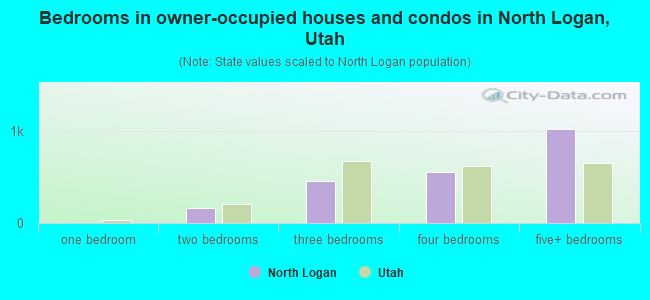
- Bedrooms in owner-occupied houses and condos in North Logan, Utah
- 0no bedroom
- 01 bedroom
- 1572 bedrooms
- 4513 bedrooms
- 5554 bedrooms
- 1,0175+ bedrooms

- Bedrooms in renter-occupied apartments in North Logan, Utah
- 49no bedroom
- 2011 bedroom
- 7372 bedrooms
- 4813 bedrooms
- 1064 bedrooms
- 805+ bedrooms
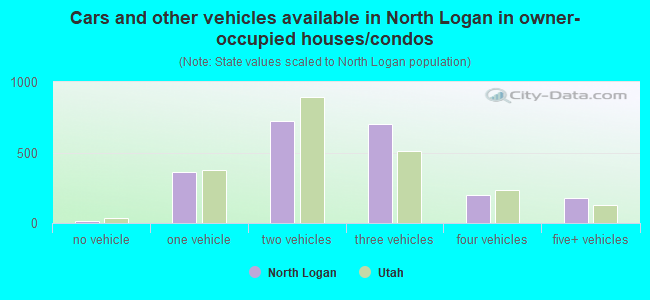
- Cars and other vehicles available in North Logan in owner-occupied houses/condos
- 12no vehicle
- 3651 vehicle
- 7262 vehicles
- 7023 vehicles
- 2004 vehicles
- 1745+ vehicles
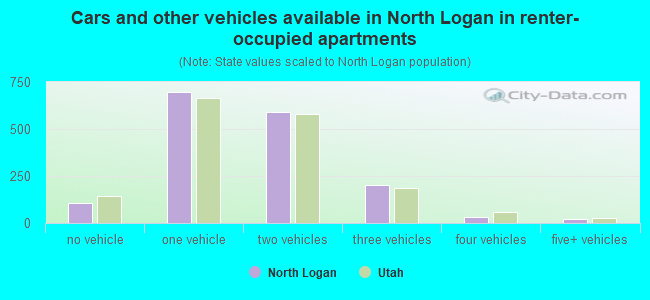
- Cars and other vehicles available in North Logan in renter-occupied apartments
- 109no vehicle
- 6961 vehicle
- 5932 vehicles
- 2003 vehicles
- 324 vehicles
- 235+ vehicles
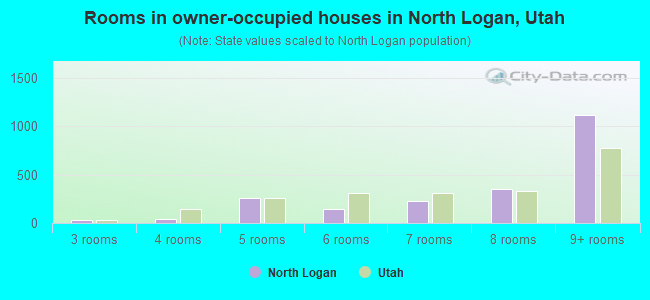
- Rooms in owner-occupied houses in North Logan, Utah
- 01 room
- 02 rooms
- 343 rooms
- 454 rooms
- 2595 rooms
- 1456 rooms
- 2267 rooms
- 3548 rooms
- 1,1179+ rooms
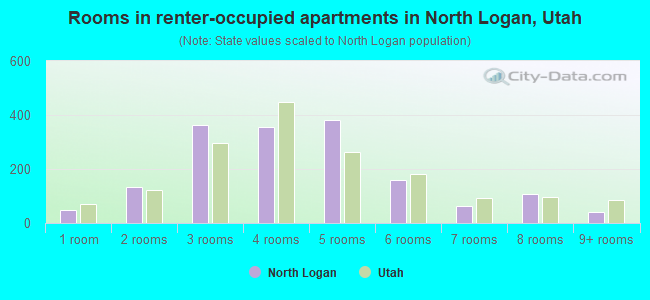
- Rooms in renter-occupied apartments in North Logan, Utah
- 491 room
- 1322 rooms
- 3633 rooms
- 3544 rooms
- 3835 rooms
- 1616 rooms
- 647 rooms
- 1098 rooms
- 409+ rooms
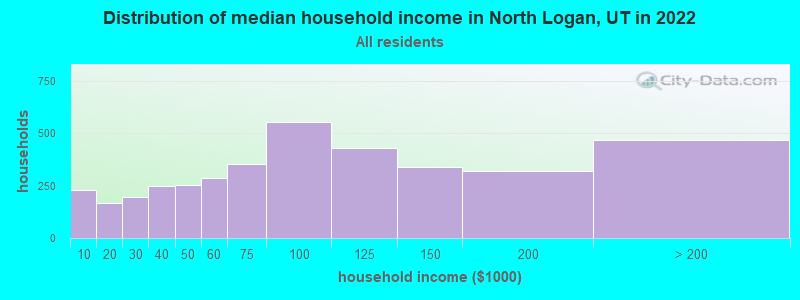
North Logan, UT household income distribution

- 231Less than $10,000
- 168$10,000 to $19,999
- 197$20,000 to $29,999
- 248$30,000 to $39,999
- 255$40,000 to $49,999
- 284$50,000 to $59,999
- 352$60,000 to $74,999
- 553$75,000 to $99,999
- 428$100,000 to $124,999
- 337$125,000 to $149,999
- 320$150,000 to $199,999
- 469$200,000 or more
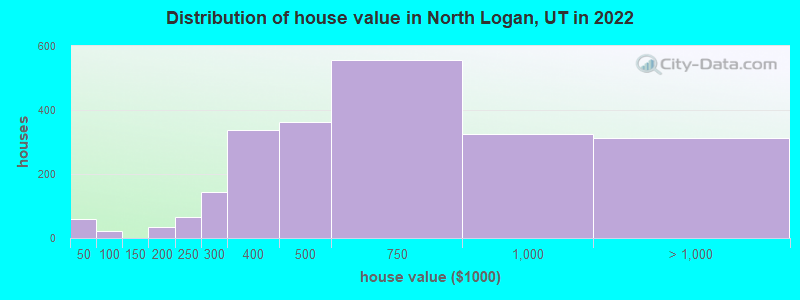
Home value of owner - occupied houses in 2022 in North Logan, UT
-
- 14Less than $10,000
- 8$10,000 to $14,999
- 13$25,000 to $29,999
- 20$40,000 to $49,999
- 12$150,000 to $174,999
- 22$175,000 to $199,999
- 65$200,000 to $249,999
- 143$250,000 to $299,999
- 336$300,000 to $399,999
- 360$400,000 to $499,999
- 555$500,000 to $749,999
- 325$750,000 to $999,999
- 302$1,000,000 to $1,499,999
- 8$1,500,000 to $1,999,999
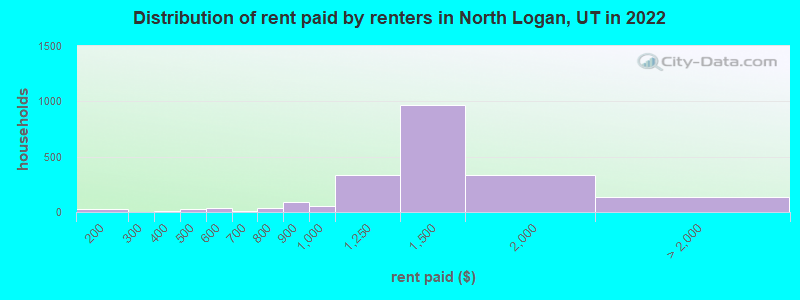
Rent paid by renters in 2022 in North Logan, UT
-
- 21$100 to $149
- 8$150 to $199
- 9$300 to $349
- 31$450 to $499
- 36$500 to $549
- 13$600 to $649
- 21$700 to $749
- 11$750 to $799
- 85$800 to $899
- 49$900 to $999
- 331$1,000 to $1,249
- 962$1,250 to $1,499
- 331$1,500 to $1,999
- 81$2,000 to $2,499
- 56$2,500 to $2,999
Percentage of workers working in this county: 94.3%
Number of people working at home: 765 (12.9% of all workers)
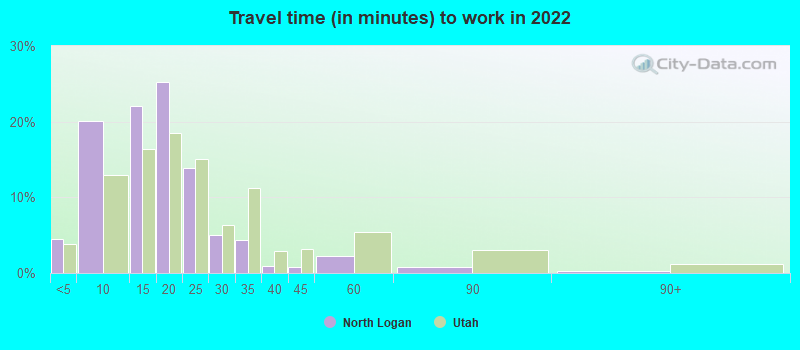
Travel time to work (commute)
- Less than 5 minutes: 269
- 5 to 9 minutes: 1,313
- 10 to 14 minutes: 1,173
- 15 to 19 minutes: 1,259
- 20 to 24 minutes: 413
- 25 to 29 minutes: 33
- 30 to 34 minutes: 46
- 35 to 39 minutes: 72
- 40 to 44 minutes: 41
- 45 to 59 minutes: 253
- 60 to 89 minutes: 40
- 90 or more minutes: 86
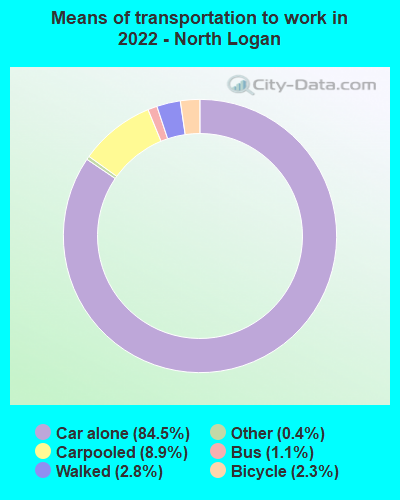
Means of transportation to work:
- Drove a car alone: 4,322 (72.5%)
- Carpooled: 420 (7.0%)
- Bus: 88 (1.5%)
- Taxi: 23 (0.4%)
- Bicycle: 178 (3.0%)
- Walked: 126 (2.1%)
- Worked at home: 765 (12.8%)
- Unemployment by race in 2022
- Unemployment rate for White non-Hispanic residents
- 1.2%Males
- 0.6%Females
- Unemployment rate for Asian residents
- 8.8%Males
- Unemployment rate for two or more race residents
- 11.5%Males
- 13.7%Females
- Unemployment rate for Hispanic or Latino residents
- 5.1%Females
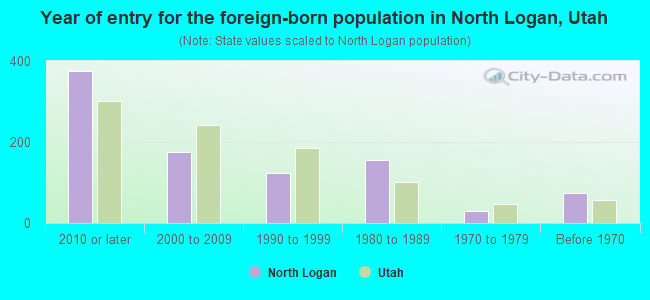
- Year of entry for the foreign-born population in North Logan, Utah
- 3762010 or later
- 1752000 to 2009
- 1231990 to 1999
- 1561980 to 1989
- 301970 to 1979
- 73Before 1970
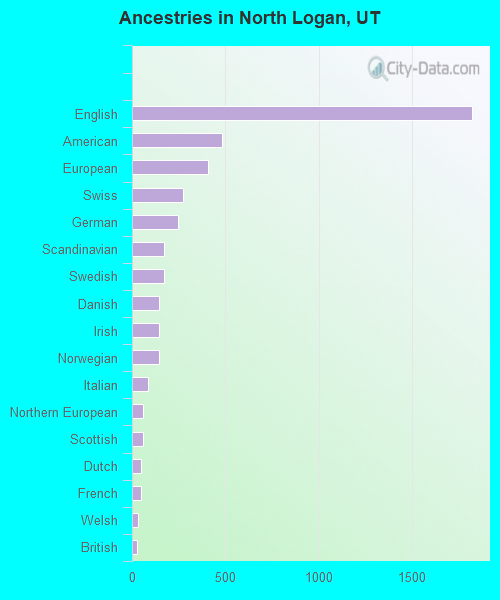
First ancestries reported:
- English: 1,822 (31.6%)
- American: 481 (8.3%)
- European: 408 (7.1%)
- Swiss: 272 (4.7%)
- German: 246 (4.3%)
- Scandinavian: 173 (3.0%)
- Swedish: 172 (3.0%)
- Danish: 147 (2.6%)
- Irish: 145 (2.5%)
- Norwegian: 145 (2.5%)
- Italian: 85 (1.5%)
- Northern European: 61 (1.1%)
- Scottish: 57 (1.0%)
- Dutch: 50 (0.9%)
- French: 50 (0.9%)
- Welsh: 33 (0.6%)
- British: 26 (0.5%)
- Portuguese: 12 (0.2%)
- Palestinian: 10 (0.2%)
- Scotch-Irish: 8 (0.1%)
- French Canadian: 7 (0.1%)
- Czech: 6 (0.1%)
- Greek: 6 (0.1%)
Most common places of birth for foreign-born residents (%):
| North Logan: | 25.2% (248) |
| Utah: | 36.1% (99,740) |
| North Logan: | 9.9% (98) |
| Utah: | 2.9% (8,017) |
| North Logan: | 9.0% (89) |
| Utah: | 2.3% (6,468) |
| North Logan: | 8.1% (80) |
| Utah: | 2.6% (7,062) |
| North Logan: | 6.2% (61) |
| Utah: | 2.9% (7,901) |
| North Logan: | 5.0% (49) |
| Utah: | 3.0% (8,341) |
| North Logan: | 4.7% (46) |
| Utah: | 0.1% (317) |
| North Logan: | 4.0% (39) |
| Utah: | 0.8% (2,087) |
| North Logan: | 3.6% (35) |
| Utah: | 0.7% (1,957) |
| North Logan: | 3.1% (31) |
| Utah: | 1.6% (4,524) |
| North Logan: | 2.8% (28) |
| Utah: | 0.0% (101) |
| North Logan: | 2.1% (21) |
| Utah: | 0.6% (1,529) |
| North Logan: | 1.9% (19) |
| Utah: | 0.1% (291) |
| North Logan: | 1.7% (17) |
| Utah: | 2.1% (5,902) |
Place of birth for U.S.-born residents:
- This state: 6,615
- Other state: 3,907
- Northeast: 147
- Midwest: 589
- South: 681
- West: 2,491
82.3% of North Logan residents lived in the same house 1 years ago.
Out of people who lived in different houses, 37.8% lived in this county.
Out of people who lived in different counties, 53.7% lived in Utah.
| North Logan: | 82.3% |
| State average: | 85.7% |
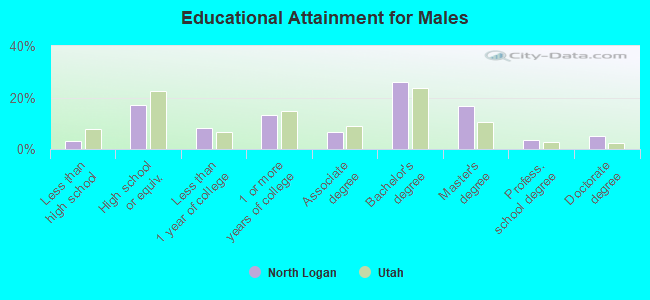
Education attainment for males 25 years and older:
- No schooling: 26
- Nursery to 4th grade: 0
- 5th and 6th grade: 0
- 7th and 8th grade: 9
- 9th grade: 1
- 10th grade: 34
- 11th grade: 8
- 12th grade, no diploma: 21
- High school graduate (or equivalency): 535
- Less than 1 year of college: 259
- Some college more than 1 year, no degree: 414
- Associate degree: 201
- Bachelor's degree: 812
- Master's degree: 513
- Professional school degree: 112
- Doctorate degree: 159
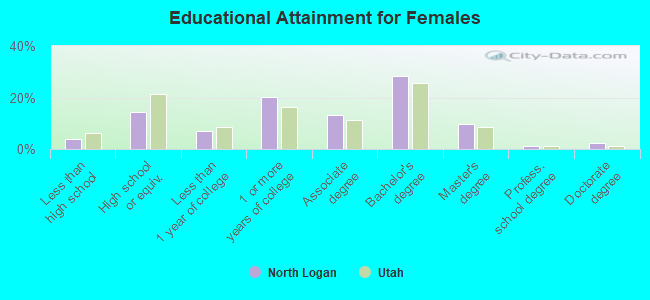
Education attainment for females 25 years and older:
- No schooling: 2
- Nursery to 4th grade: 8
- 5th and 6th grade: 27
- 7th and 8th grade: 52
- 9th grade: 0
- 10th grade: 5
- 11th grade: 5
- 12th grade, no diploma: 28
- High school graduate (or equivalency): 463
- Less than 1 year of college: 222
- Some college more than 1 year, no degree: 656
- Associate degree: 433
- Bachelor's degree: 917
- Master's degree: 313
- Professional school degree: 37
- Doctorate degree: 81
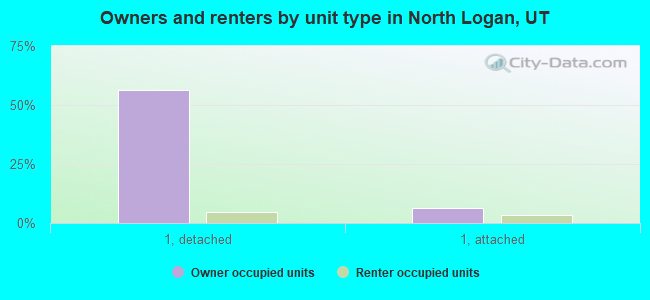
Housing units in structures:
- One, detached: 1,961
- One, attached: 481
- Two: 94
- 3 or 4: 88
- 5 to 9: 294
- 10 to 19: 221
- 20 to 49: 429
- 50 or more: 287
- Mobile homes: 127
- Boats, RVs, vans, etc.: 22
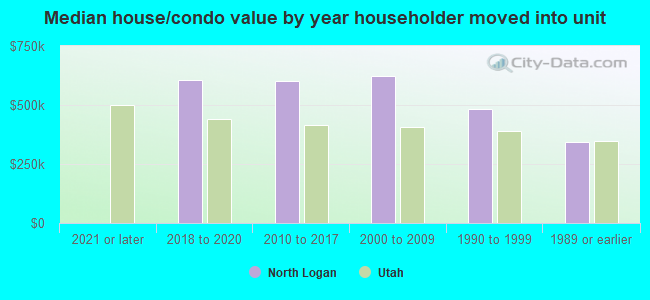
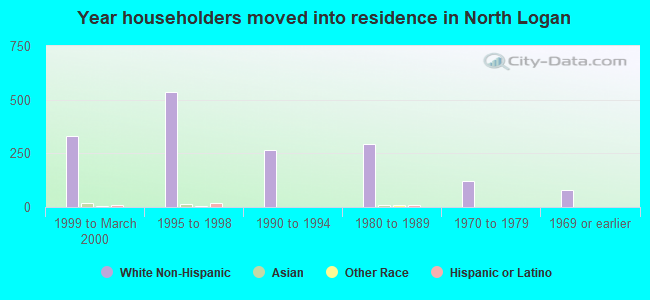
House/condo owner moved in on average 7 years ago
Renter moved in on average 0 years ago
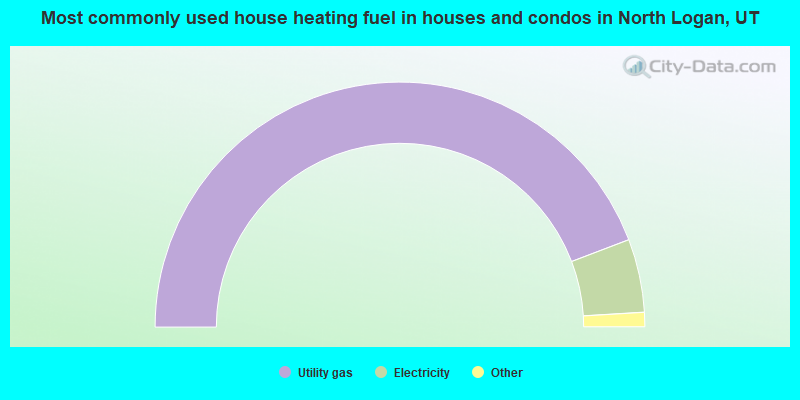
- 88.4%Utility gas
- 9.7%Electricity
- 1.1%Solar energy
- 0.7%Bottled, tank, or LP gas
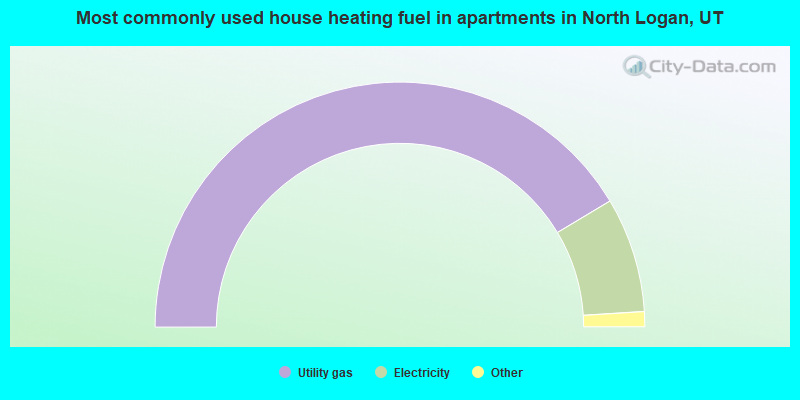
- 82.8%Utility gas
- 15.2%Electricity
- 1.1%Bottled, tank, or LP gas
- 0.8%No fuel used
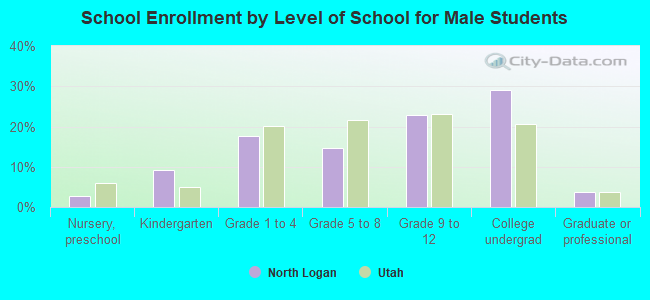
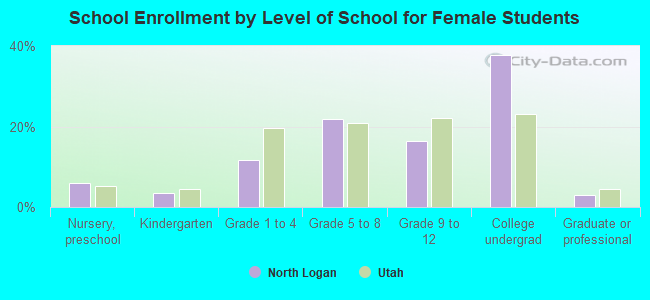
Private vs. public school enrollment:
| Here: | 3.8% |
| Utah: | 7.2% |
| Here: | 1.6% |
| Utah: | 5.3% |
| Here: | 16.2% |
| Utah: | 26.7% |