Housing density: 644 houses/condos per square mile
Median price asked for vacant for-sale houses and condos in 2022 in this county: $195,117.
Median contract rent in 2022: $788 (lower quartile is $614, upper quartile is $990)
Median rent asked for vacant for-rent units in 2022: $822
Median gross rent in North Versailles, PA in 2022: $952
Housing units in North Versailles with a mortgage: 1,695 (186 second mortgage, 231 home equity loan, 12 both second mortgage and home equity loan) Houses without a mortgage: 1,598
Compare current foreclosures near North Versailles, PA:
In family households: 913,516 (208,635 male householders, 99,374 female householders)
222,332 spouses, 315,393 children (298,168 natural, 7,619 adopted, 9,606 stepchildren), 18,457 grandchildren, 9,985 brothers or sisters, 8,652 parents, foster children, 7,846 other relatives, 18,452 non-relatives
In nonfamily households: 274,778 (100,758 male householders (79,382 living alone)), 125,193 female householders (107,576 living alone)), 48,827 nonrelatives
In group quarters: 35,054 (13,287 institutionalized population)
186,963 married couples with children.
71,829 single-parent households (11,403 men, 60,426 women).
96.5% of residents of North Versailles speak English at home.
0.6% of residents speak Spanish at home (66% speak English very well, 18% speak English well, 15% speak English not well).
2.2% of residents speak other Indo-European language at home (74% speak English very well, 21% speak English well, 5% speak English not well).
0.5% of residents speak Asian or Pacific Island language at home (54% speak English very well, 24% speak English not well, 22% don't speak English at all).
0.2% of residents speak other language at home (69% speak English very well, 31% speak English not well).
Foreign born population: 266 (2.5%)
(69.5% of them are naturalized citizens)
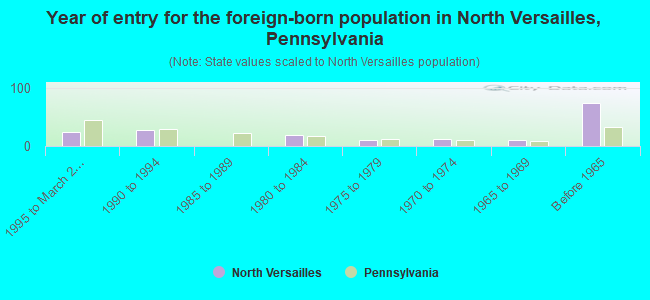
Year of entry for the foreign-born population in North Versailles, Pennsylvania
251995 to March 2000
281990 to 1994
01985 to 1989
191980 to 1984
111975 to 1979
131970 to 1974
101965 to 1969
74Before 1965
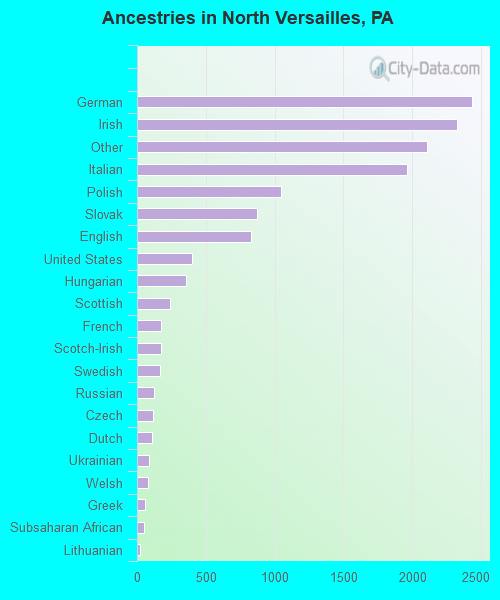
First ancestries reported:
German: 2,436 (17.7%)
Irish: 2,325 (16.9%)
Other: 2,107 (15.3%)
Italian: 1,961 (14.2%)
Polish: 1,044 (7.6%)
Slovak: 875 (6.3%)
English: 832 (6.0%)
United States: 400 (2.9%)
Hungarian: 358 (2.6%)
Scottish: 239 (1.7%)
French: 175 (1.3%)
Scotch-Irish: 173 (1.3%)
Swedish: 165 (1.2%)
Russian: 121 (0.9%)
Czech: 116 (0.8%)
Dutch: 111 (0.8%)
Ukrainian: 89 (0.6%)
Welsh: 79 (0.6%)
Greek: 58 (0.4%)
Subsaharan African: 53 (0.4%)
Lithuanian: 23 (0.2%)
Norwegian: 17 (0.1%)
Arab: 14 (0.1%)
French Canadian: 9 (0.07%)
Portuguese: 5 (0.04%)
Most common places of birth for foreign-born residents (%):
Italy
North Versailles:
16.1% (29)
Pennsylvania:
6.0% (30,559)
Poland
North Versailles:
14.4% (26)
Pennsylvania:
2.3% (11,916)
Korea
North Versailles:
10.6% (19)
Pennsylvania:
5.3% (26,703)
Germany
North Versailles:
8.3% (15)
Pennsylvania:
5.1% (25,685)
Portugal
North Versailles:
7.2% (13)
Pennsylvania:
0.6% (2,961)
Other Eastern Europe
North Versailles:
7.2% (13)
Pennsylvania:
1.7% (8,574)
India
North Versailles:
6.1% (11)
Pennsylvania:
7.4% (37,541)
Yugoslavia
North Versailles:
4.4% (8)
Pennsylvania:
0.7% (3,328)
Other Western Europe
North Versailles:
3.9% (7)
Pennsylvania:
0.4% (2,023)
Greece
North Versailles:
3.9% (7)
Pennsylvania:
1.4% (7,362)
United Kingdom
North Versailles:
3.3% (6)
Pennsylvania:
4.6% (23,171)
Japan
North Versailles:
3.3% (6)
Pennsylvania:
1.2% (5,852)
Czechoslovakia (includes Czech Republic and Slovakia)
North Versailles:
2.8% (5)
Pennsylvania:
0.7% (3,451)
Hungary
North Versailles:
2.8% (5)
Pennsylvania:
0.7% (3,762)
Other Western Asia
North Versailles:
2.8% (5)
Pennsylvania:
0.6% (2,863)
Canada
North Versailles:
2.8% (5)
Pennsylvania:
3.0% (15,200)
Place of birth for U.S.-born residents:
This state: 9,919
Other state: 984
Northeast: 170
Midwest: 228
South: 473
West: 113
71% of North Versailles residents lived in the same house 5 years ago. Out of people who lived in different houses, 78% lived in this county. Out of people who lived in different counties, 72% lived in Pennsylvania.
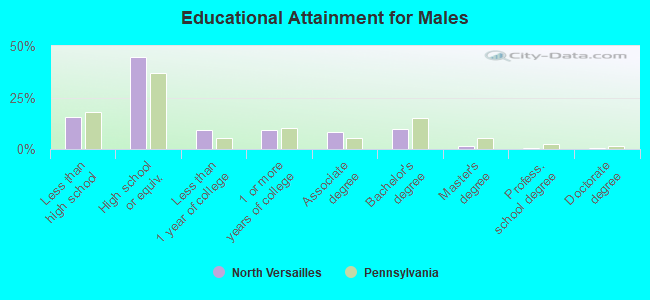
Education attainment for males 25 years and older:
No schooling: 5
Nursery to 4th grade: 0
5th and 6th grade: 16
7th and 8th grade: 65
9th grade: 77
10th grade: 121
11th grade: 94
12th grade, no diploma: 187
High school graduate (or equivalency): 1,615
Less than 1 year of college: 338
Some college more than 1 year, no degree: 342
Associate degree: 300
Bachelor's degree: 353
Master's degree: 56
Professional school degree: 22
Doctorate degree: 25
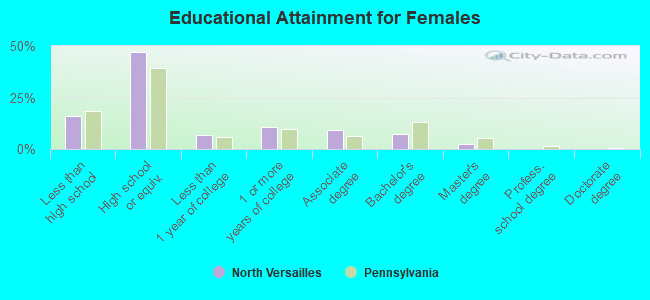
Education attainment for females 25 years and older:
No schooling: 10
Nursery to 4th grade: 0
5th and 6th grade: 40
7th and 8th grade: 139
9th grade: 93
10th grade: 158
11th grade: 108
12th grade, no diploma: 154
High school graduate (or equivalency): 2,104
Less than 1 year of college: 299
Some college more than 1 year, no degree: 482
Associate degree: 414
Bachelor's degree: 330
Master's degree: 102
Professional school degree: 9
Doctorate degree: 6
Housing units in structures:
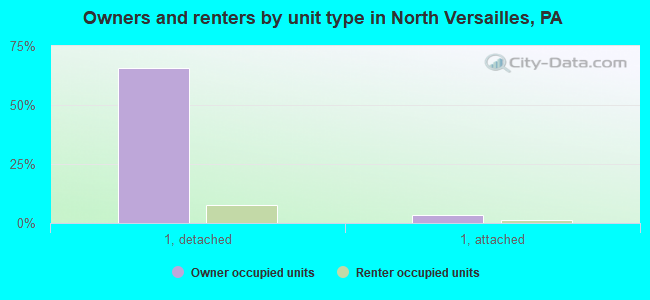
One, detached: 3,770
One, attached: 260
Two: 126
3 or 4: 144
5 to 9: 232
10 to 19: 289
20 to 49: 260
50 or more: 134
Mobile homes: 7
Housing units lacking complete plumbing facilities: 0.9%
Housing units lacking complete kitchen facilities: 0.9%