Northview, MI (Michigan) Houses and Residents
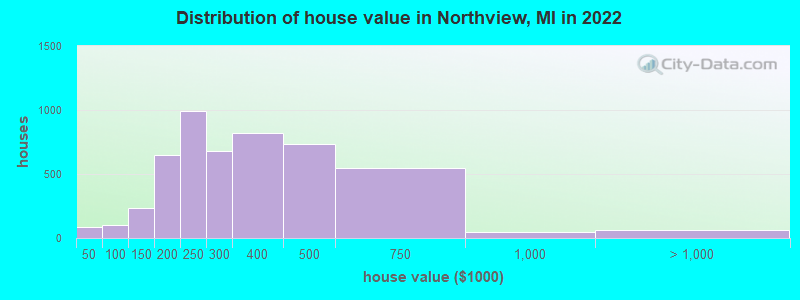
Estimated median house or condo value in 2022: $280,852 (it was $117,100 in 2000 )
Northview:
$280,852Michigan:
$224,400
Lower value quartile - upper value quartile: $219,522 - $408,726Mean price in 2022: Detached houses: $289,040 Here:
$289,040State:
$280,038
Townhouses or other attached units: $369,910 Here:
$369,910State:
$239,520
In 3-to-4-unit structures: $159,793 Here:
$159,793State:
$207,067
In 5-or-more-unit structures: $128,030 Here:
$128,030State:
$192,733
Mobile homes: $293,864 Here:
$293,864State:
$72,868
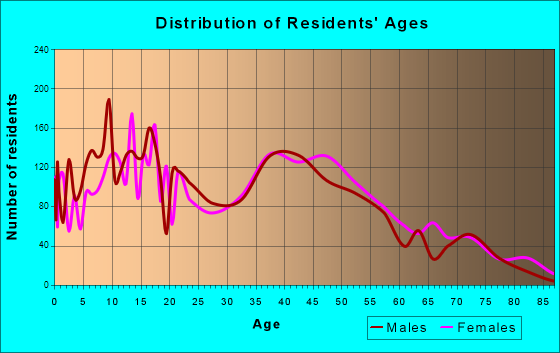
Total population: 14,541 (Urban population: 13,594, Rural population: 1,080 (all nonfarm) )
Houses: 6,780 (6,582 occupied: 5,051 owner occupied, 1,528 renter occupied )
% of renters here:
23%State:
27%
Housing density: 651 houses/condos per square mile
Median price asked for vacant for-sale houses and condos in 2022: $278,726.
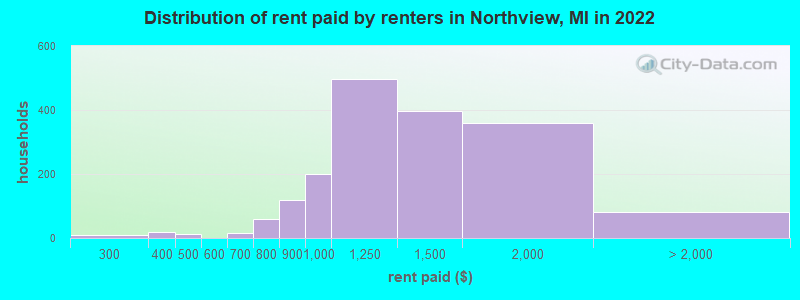
Median contract rent in 2022: $1,232 (lower quartile is $1,007, upper quartile is $1,509)
Median rent asked for vacant for-rent units in 2022: $4,460
Median gross rent in Northview, MI in 2022: $1,346
Housing units in Northview with a mortgage: 2,846 (302 second mortgage, 7 home equity loan, 285 both second mortgage and home equity loan )Houses without a mortgage: 103
Median household income for houses/condos with a mortgage: $102,669
Median household income for apartments without a mortgage: $71,862
Median monthly housing costs: $1,177
Data:
Median house or condo value ($)
Median house or condo value ($ change since 2000)
Median house or condo value ($) - White
Median house or condo value ($) - Black or African American
Median house or condo value ($) - Asian
Median house or condo value ($) - Hispanic or Latino
Median house or condo value ($) - American Indian and Alaska Native
Median house or condo value ($) - Multirace
Median house or condo value ($) - Other Race
Median price asked for mobile homes ($)
Household density (households per square mile)
Mean house or condo value by units in structure - 1, detached ($)
Mean house or condo value by units in structure - 1, attached ($)
Mean house or condo value by units in structure - 2 ($)
Mean house or condo value by units in structure by units in structure - 3 or 4 ($)
Mean house or condo value by units in structure - 5 or more ($)
Mean house or condo value by units in structure - Boat, RV, van, etc. ($)
Mean house or condo value by units in structure - Mobile home ($)
Median contract rent ($)
Median contract rent - Lower quartile ($)
Median contract rent - Upper quartile ($)
Median gross rent ($)
Urban houses (%)
Rural houses (%)
Houses occupied (%)
Houses occupied (% change since 2000)
Houses owner occupied (%)
Houses owner occupied (% change since 2000)
Houses renter occupied (%)
Houses renter occupied (% change since 2000)
Vacant housing units - For rent (%)
Vacant housing units - For rent (% change since 2000)
Vacant housing units - For sale only (%)
Vacant housing units - For sale only (% change since 2000)
Vacant housing units - Rented or sold, not occupied (%)
Vacant housing units - Rented or sold, not occupied (% change since 2000)
Vacant housing units - For seasonal, recreational, or occasional use (%)
Vacant housing units - For seasonal, recreational, or occasional use (% change since 2000)
Vacant housing units - For migrant workers (%)
Vacant housing units - For migrant workers (% change since 2000)
Vacant housing units - Other vacant (%)
Vacant housing units - Other vacant (% change since 2000)
Median monthly housing costs ($)
Median household income for houses/condos with a mortgage ($)
Median household income for houses/condos without a mortgage ($)
Median household income ($)
Median household income ($) - White
Median household income ($) - Black or African American
Median household income ($) - Asian
Median household income ($) - Hispanic or Latino
Median household income ($) - American Indian and Alaska Native
Median household income ($) - Multirace
Median household income ($) - Other Race
Mortgage status - with mortgage (%)
Mortgage status - with second mortgage (%)
Mortgage status - with home equity loan (%)
Mortgage status - with both second mortgage and home equity loan (%)
Mortgage status - without a mortgage (%)
Median year house/condo built
Median year apartment built
Household type by relationship - Male householder living alone (%)
Household type by relationship - Male householder not living alone (%)
Household type by relationship - Female householder living alone (%)
Household type by relationship - Female householder not living alone (%)
Household type by relationship - Opposite-Sex spouse (%)
Household type by relationship - Same-Sex spouse (%)
Household type by relationship - Opposite-Sex unmarried partner (%)
Household type by relationship - Same-Sex unmarried partner (%)
Household type by relationship - In group quarters (%)
Size of family households - 2-person household (%)
Size of family households - 3-person household (%)
Size of family households - 4-person household (%)
Size of family households - 5-person household (%)
Size of family households - 6-person household (%)
Size of family households - 7-or-more-person household (%)
Size of nonfamily households - 1-person household (%)
Size of nonfamily households - 2-person household (%)
Size of nonfamily households - 3-person household (%)
Size of nonfamily households - 4-person household (%)
Size of nonfamily households - 5-person household (%)
Size of nonfamily households - 6-person household (%)
Size of nonfamily households - 7-or-moreperson household (%)
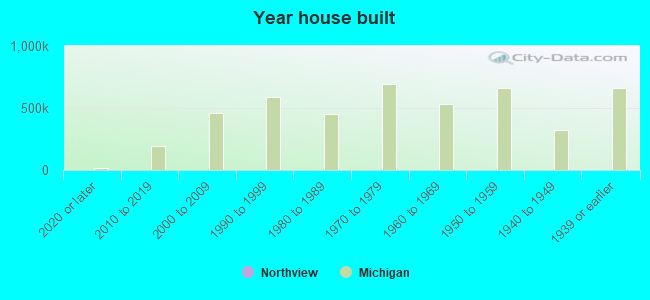
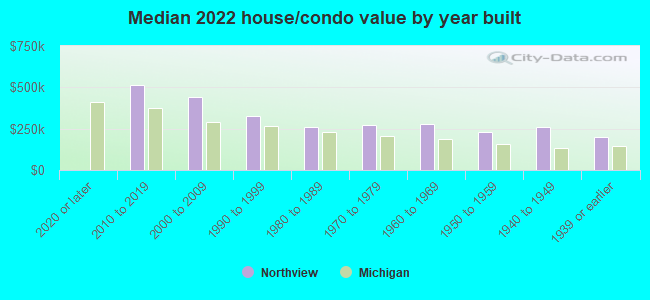
Year house built - Built 2010 or later (%)
Year house built - Built 2000 to 2009 (%)
Year house built - Built 1990 to 1999 (%)
Year house built - Built 1980 to 1989 (%)
Year house built - Built 1970 to 1979 (%)
Year house built - Built 1960 to 1969 (%)
Year house built - Built 1950 to 1959 (%)
Year house built - Built 1940 to 1949 (%)
Year house built - Built 1939 or earlier (%)
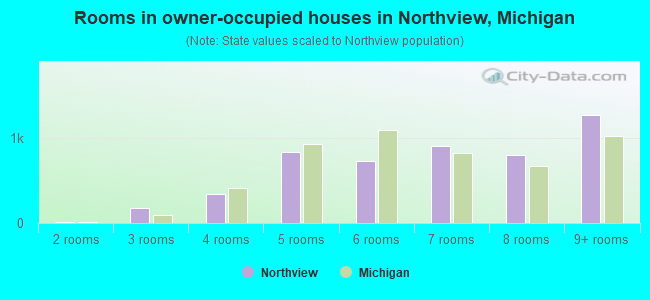
Median number of rooms in houses and condos
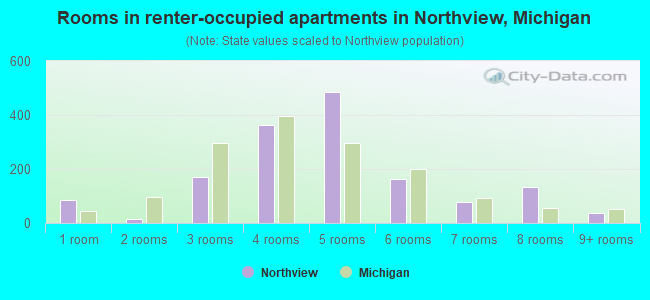
Median number of rooms in apartments
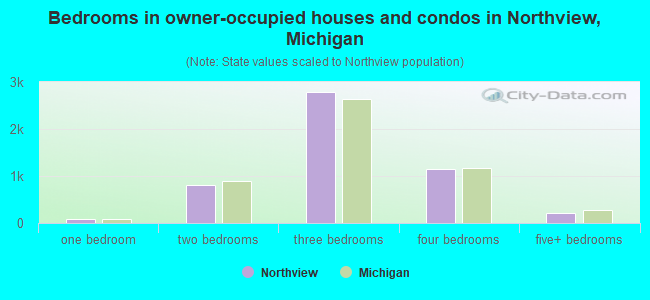
Median number of bedrooms in owner occupied houses
Mean number of bedrooms in owner occupied houses
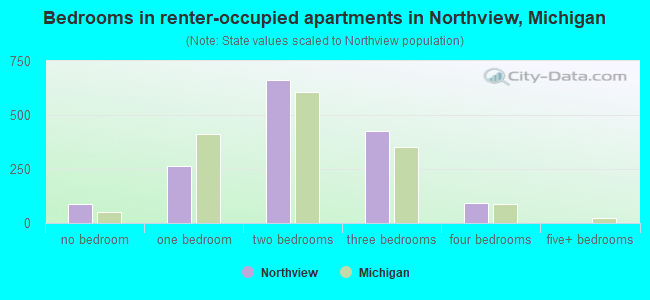
Median number of bedrooms in renter occupied houses
Mean number of bedrooms in renter occupied houses
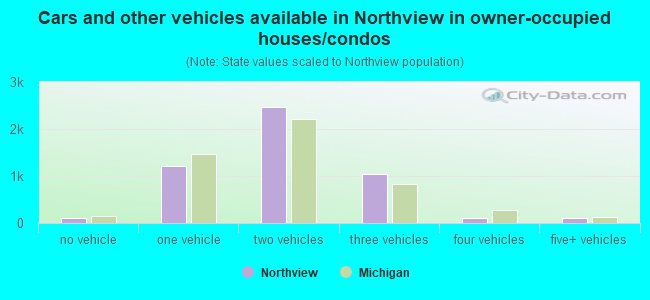
Median number of vehichles in owner occupied houses
Mean number of vehichles in owner occupied houses
Median number of vehichles in renter occupied houses
Mean number of vehichles in renter occupied houses
Rooms in owner-occupied houses - 1 room (%)
Rooms in owner-occupied houses - 2 rooms (%)
Rooms in owner-occupied houses - 3 rooms (%)
Rooms in owner-occupied houses - 4 rooms (%)
Rooms in owner-occupied houses - 5 rooms (%)
Rooms in owner-occupied houses - 6 rooms (%)
Rooms in owner-occupied houses - 7 rooms (%)
Rooms in owner-occupied houses - 8 rooms (%)
Rooms in owner-occupied houses - 9+ rooms (%)
Rooms in renter-occupied houses - 1 room (%)
Rooms in renter-occupied houses - 2 rooms (%)
Rooms in renter-occupied houses - 3 rooms (%)
Rooms in renter-occupied houses - 4 rooms (%)
Rooms in renter-occupied houses - 5 rooms (%)
Rooms in renter-occupied houses - 6 rooms (%)
Rooms in renter-occupied houses - 7 rooms (%)
Rooms in renter-occupied houses - 8 rooms (%)
Rooms in renter-occupied houses - 9+ rooms (%)
Bedrooms in owner-occupied houses - no bedrooms (%)
Bedrooms in owner-occupied houses - 1 bedroom (%)
Bedrooms in owner-occupied houses - 2 bedrooms (%)
Bedrooms in owner-occupied houses - 3 bedrooms (%)
Bedrooms in owner-occupied houses - 4 bedrooms (%)
Bedrooms in owner-occupied houses - 5+ bedrooms (%)
Bedrooms in renter-occupied houses - no bedrooms (%)
Bedrooms in renter-occupied houses - 1 bedroom (%)
Bedrooms in renter-occupied houses - 2 bedrooms (%)
Bedrooms in renter-occupied houses - 3 bedrooms (%)
Bedrooms in renter-occupied houses - 4 bedrooms (%)
Bedrooms in renter-occupied houses - 5+ bedrooms (%)
Vehicles available in owner-occupied houses - no vehicle available (%)
Vehicles available in owner-occupied houses - 1 vehicle available(%)
Vehicles available in owner-occupied houses - 2 Vehicles available (%)
Vehicles available in owner-occupied houses - 3 Vehicles available (%)
Vehicles available in owner-occupied houses - 4 Vehicles available (%)
Vehicles available in owner-occupied houses - 5+ Vehicles available (%)
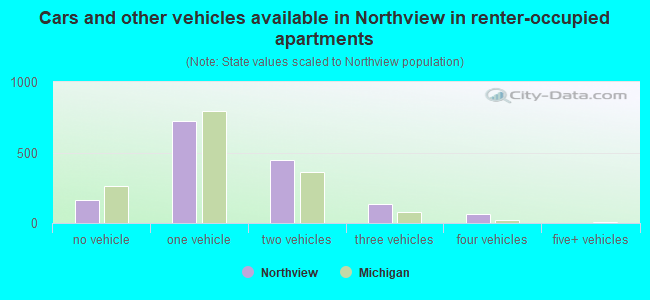
Vehicles available in renter-occupied houses - no vehicle available (%)
Vehicles available in renter-occupied houses - 1 vehicle available (%)
Vehicles available in renter-occupied houses - 2 Vehicles available (%)
Vehicles available in renter-occupied houses - 3 Vehicles available (%)
Vehicles available in renter-occupied houses - 4 Vehicles available (%)
Vehicles available in renter-occupied houses - 5+ Vehicles available (%)
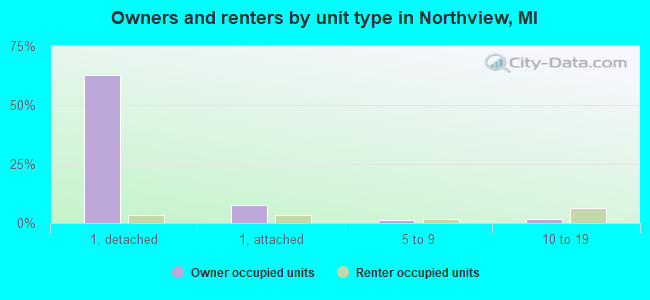
Housing units in structures - 1, detached (%)
Housing units in structures - 1, attached (%)
Housing units in structures - 2 (%)
Housing units in structures - 3 or 4 (%)
Housing units in structures - 5 to 9 (%)
Housing units in structures - 10 to 19 (%)
Housing units in structures - 20 to 49 (%)
Housing units in structures - 50 or more (%)
Housing units in structures - Mobile home (%)
Housing units in structures - Boat, RV, van, etc. (%)
Housing units in structures - Owners - 1, detached (%)
Housing units in structures - Owners - 1, attached (%)
Housing units in structures - Owners - 2 (%)
Housing units in structures - Owners - 3 or 4 (%)
Housing units in structures - Owners - 5 to 9 (%)
Housing units in structures - Owners - 10 to 19 (%)
Housing units in structures - Owners - 20 to 49 (%)
Housing units in structures - Owners - 50 or more (%)
Housing units in structures - Owners - Mobile home (%)
Housing units in structures - Owners - Boat, RV, van, etc. (%)
Housing units in structures - Renters - 1, detached (%)
Housing units in structures - Renters - 1, attached (%)
Housing units in structures - Renters - 2 (%)
Housing units in structures - Renters - 3 or 4 (%)
Housing units in structures - Renters - 5 to 9 (%)
Housing units in structures - Renters - 10 to 19 (%)
Housing units in structures - Renters - 20 to 49 (%)
Housing units in structures - Renters - 50 or more (%)
Housing units in structures - Renters - Mobile home (%)
Housing units in structures - Renters - Boat, RV, van, etc. (%)
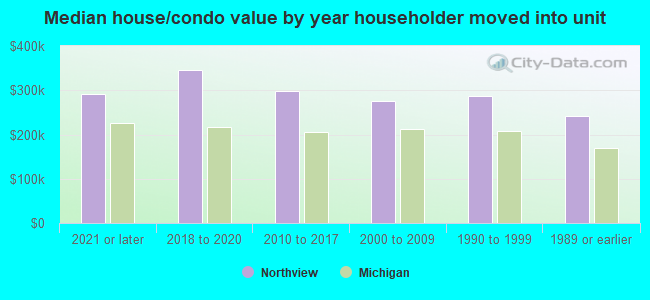
House/condo owner moved in on average (years ago)
Renter moved in on average (years ago)
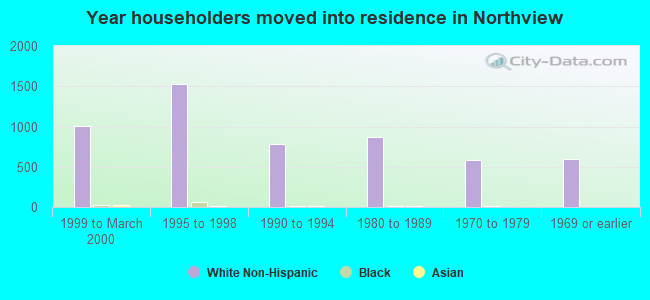
Year householder moved into unit - Moved in 1999 to March 2000 (%)
Year householder moved into unit - Moved in 1999 to March 2000 (%) - White
Year householder moved into unit - Moved in 1999 to March 2000 (%) - Black or African American
Year householder moved into unit - Moved in 1999 to March 2000 (%) - Asian
Year householder moved into unit - Moved in 1999 to March 2000 (%) - Hispanic or Latino
Year householder moved into unit - Moved in 1999 to March 2000 (%) - American Indian and Alaska Native
Year householder moved into unit - Moved in 1999 to March 2000 (%) - Multirace
Year householder moved into unit - Moved in 1999 to March 2000 (%) - Other Race
Year householder moved into unit - Moved in 1995 to 1998 (%)
Year householder moved into unit - Moved in 1995 to 1998 (%) - White
Year householder moved into unit - Moved in 1995 to 1998 (%) - Black or African American
Year householder moved into unit - Moved in 1995 to 1998 (%) - Asian
Year householder moved into unit - Moved in 1995 to 1998 (%) - Hispanic or Latino
Year householder moved into unit - Moved in 1995 to 1998 (%) - American Indian and Alaska Native
Year householder moved into unit - Moved in 1995 to 1998 (%) - Multirace
Year householder moved into unit - Moved in 1995 to 1998 (%) - Other Race
Year householder moved into unit - Moved in 1990 to 1994 (%)
Year householder moved into unit - Moved in 1990 to 1994 (%) - White
Year householder moved into unit - Moved in 1990 to 1994 (%) - Black or African American
Year householder moved into unit - Moved in 1990 to 1994 (%) - Asian
Year householder moved into unit - Moved in 1990 to 1994 (%) - Hispanic or Latino
Year householder moved into unit - Moved in 1990 to 1994 (%) - American Indian and Alaska Native
Year householder moved into unit - Moved in 1990 to 1994 (%) - Multirace
Year householder moved into unit - Moved in 1990 to 1994 (%) - Other Race
Year householder moved into unit - Moved in 1980 to 1989 (%)
Year householder moved into unit - Moved in 1980 to 1989 (%) - White
Year householder moved into unit - Moved in 1980 to 1989 (%) - Black or African American
Year householder moved into unit - Moved in 1980 to 1989 (%) - Asian
Year householder moved into unit - Moved in 1980 to 1989 (%) - Hispanic or Latino
Year householder moved into unit - Moved in 1980 to 1989 (%) - American Indian and Alaska Native
Year householder moved into unit - Moved in 1980 to 1989 (%) - Multirace
Year householder moved into unit - Moved in 1980 to 1989 (%) - Other Race
Year householder moved into unit - Moved in 1970 to 1979 (%)
Year householder moved into unit - Moved in 1970 to 1979 (%) - White
Year householder moved into unit - Moved in 1970 to 1979 (%) - Black or African American
Year householder moved into unit - Moved in 1970 to 1979 (%) - Asian
Year householder moved into unit - Moved in 1970 to 1979 (%) - Hispanic or Latino
Year householder moved into unit - Moved in 1970 to 1979 (%) - American Indian and Alaska Native
Year householder moved into unit - Moved in 1970 to 1979 (%) - Multirace
Year householder moved into unit - Moved in 1970 to 1979 (%) - Other Race
Year householder moved into unit - Moved in 1969 or earlier (%)
Year householder moved into unit - Moved in 1969 or earlier (%) - White
Year householder moved into unit - Moved in 1969 or earlier (%) - Black or African American
Year householder moved into unit - Moved in 1969 or earlier (%) - Asian
Year householder moved into unit - Moved in 1969 or earlier (%) - Hispanic or Latino
Year householder moved into unit - Moved in 1969 or earlier (%) - American Indian and Alaska Native
Year householder moved into unit - Moved in 1969 or earlier (%) - Multirace
Year householder moved into unit - Moved in 1969 or earlier (%) - Other Race
Housing units lacking complete plumbing facilities (%)
Housing units lacking complete kitchen facilities (%)
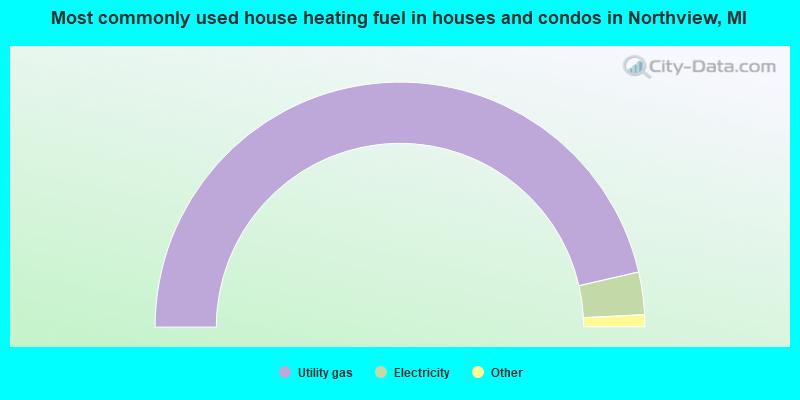
House heating fuel used in houses and condos - Utility gas (%)
House heating fuel used in houses and condos - Bottled, tank, or LP gas (%)
House heating fuel used in houses and condos - Electricity (%)
House heating fuel used in houses and condos - Fuel oil, kerosene, etc. (%)
House heating fuel used in houses and condos - Coal or coke (%)
House heating fuel used in houses and condos - Wood (%)
House heating fuel used in houses and condos - Solar energy (%)
House heating fuel used in houses and condos - Other fuel (%)
House heating fuel used in houses and condos - No fuel used (%)
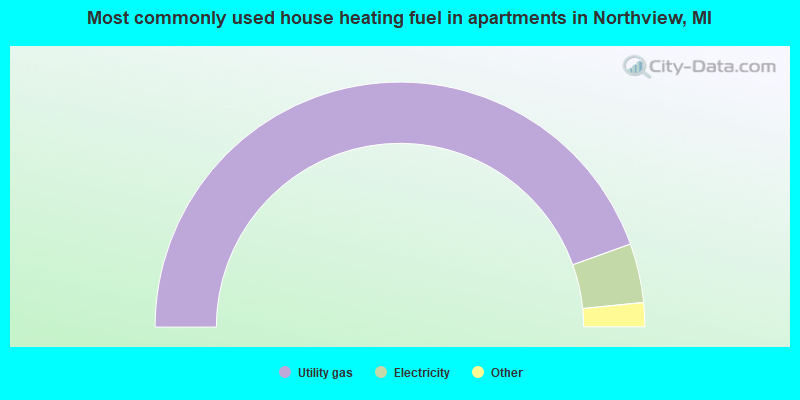
House heating fuel used in apartments - Utility gas (%)
House heating fuel used in apartments - Bottled, tank, or LP gas (%)
House heating fuel used in apartments - Electricity (%)
House heating fuel used in apartments - Fuel oil, kerosene, etc. (%)
House heating fuel used in apartments - Coal or coke (%)
House heating fuel used in apartments - Wood (%)
House heating fuel used in apartments - Solar energy (%)
House heating fuel used in apartments - Other fuel (%)
House heating fuel used in apartments - No fuel used (%)
Latest news about housing in Northview, MI collected exclusively by city-data.com from local newspapers, TV, and radio stations
Median year house/condo built: 1978Median year apartment built: 1976Household type by relationship:
Households: 15,469
Male householders: 2,900 (539 living alone ), Female householders: 3,607 (1,080 living alone )3,265 spouses (3,215 opposite-sex spouses ), 608 unmarried partners , (605 opposite-sex unmarried partners ), 3,897 children (3,663 natural , 106 adopted , 127 stepchildren ), 259 grandchildren , 70 brothers or sisters , 190 parents , 0 foster children , 118 other relatives , 542 non-relatives In group quarters: 8
Size of family households: 2,055 2-persons , 1,351 3-persons , 559 4-persons , 225 5-persons , 98 6-persons , 40 7-or-more-persons .
Size of nonfamily households: 1,711 1-person , 461 2-persons , 54 3-persons , 53 4-persons .
1,732 married couples with children. single-parent households (156 men , 905 women ).
96.7% of residents of Northview speak English at home. of residents speak Spanish at home (52% speak English very well , 16% speak English well , 32% speak English not well ).of residents speak other Indo-European language at home (92% speak English very well , 8% speak English well ).of residents speak Asian or Pacific Island language at home (41% speak English very well , 31% speak English well , 28% speak English not well ).of residents speak other language at home (80% speak English very well , 20% speak English well ).
Foreign born population: 544 (3.5%)of them are naturalized citizens )
Median number of rooms in houses and condos:
Median number of rooms in apartments
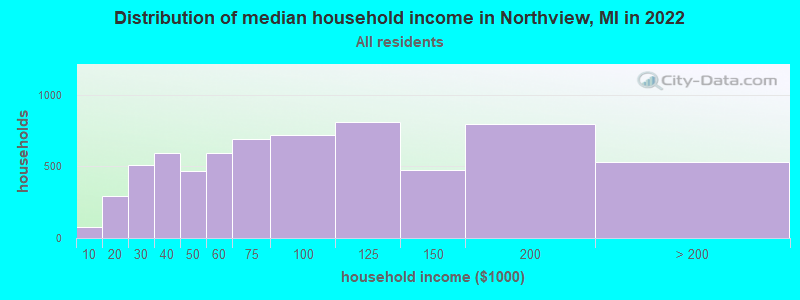
Northview, MI household income distribution 79 Less than $10,000291 $10,000 to $19,999511 $20,000 to $29,999597 $30,000 to $39,999465 $40,000 to $49,999593 $50,000 to $59,999692 $60,000 to $74,999717 $75,000 to $99,999810 $100,000 to $124,999476 $125,000 to $149,999793 $150,000 to $199,999530 $200,000 or more
Home value of owner - occupied houses in 2022 in Northview, MI 22 Less than $10,00028 $15,000 to $19,99922 $30,000 to $34,9998 $35,000 to $39,9997 $50,000 to $59,99914 $60,000 to $69,99932 $70,000 to $79,99917 $80,000 to $89,99932 $90,000 to $99,999111 $100,000 to $124,999121 $125,000 to $149,999257 $150,000 to $174,999389 $175,000 to $199,999994 $200,000 to $249,999682 $250,000 to $299,999823 $300,000 to $399,999735 $400,000 to $499,999542 $500,000 to $749,99949 $750,000 to $999,99942 $1,000,000 to $1,499,99916 $2,000,000 or moreRent paid by renters in 2022 in Northview, MI 10 $250 to $29917 $350 to $39910 $450 to $49916 $600 to $64933 $700 to $74924 $750 to $799118 $800 to $899201 $900 to $999497 $1,000 to $1,249396 $1,250 to $1,499360 $1,500 to $1,99980 No cash rent
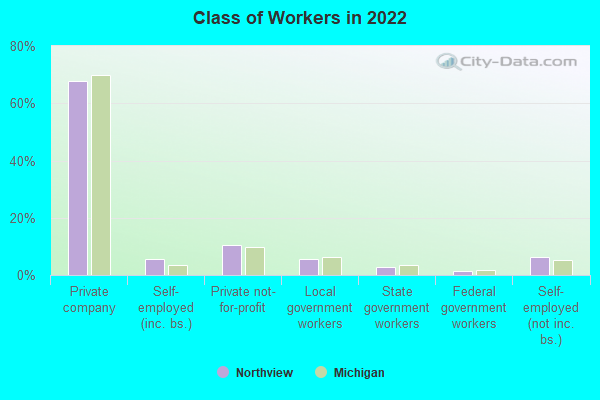
Percentage of workers working in this county: 94.5%Number of people working at home: 1,071 (12.6% of all workers )
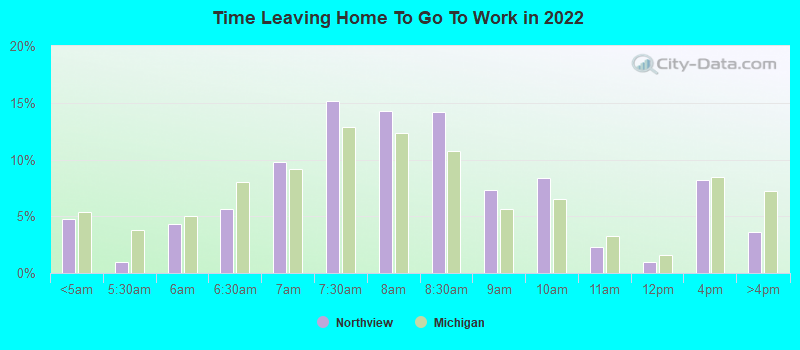
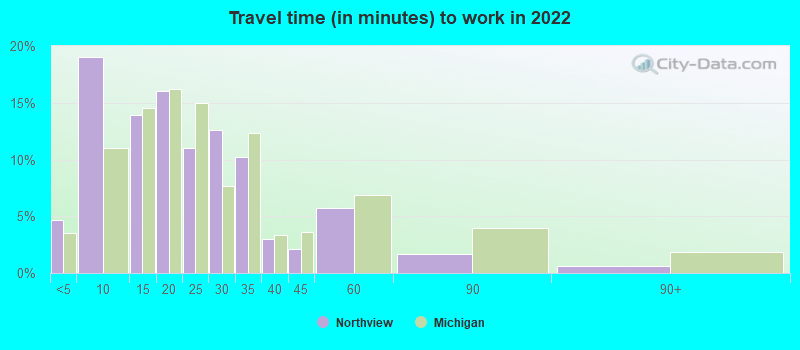
Travel time to work (commute)
Less than 5 minutes: 1865 to 9 minutes: 1,20910 to 14 minutes: 1,05315 to 19 minutes: 1,49520 to 24 minutes: 1,57525 to 29 minutes: 44830 to 34 minutes: 67935 to 39 minutes: 9740 to 44 minutes: 10445 to 59 minutes: 20760 to 89 minutes: 12090 or more minutes: 116
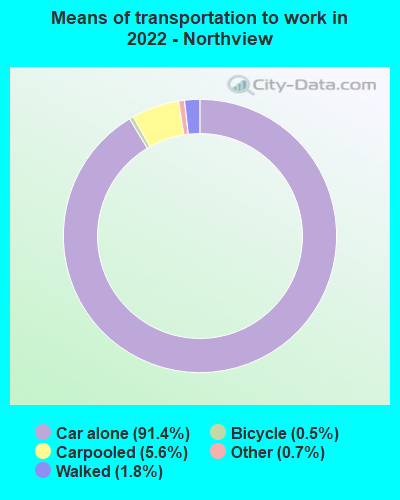
Means of transportation to work:
Drove a car alone: 5,206 (77.5%)Carpooled: 330 (4.9%)Taxi: 58 (0.9%)Bicycle: 29 (0.4%)Walked: 98 (1.5%)Worked at home: 1,071 (15.9%)
Unemployment by race in 2022
Unemployment rate for White non-Hispanic residents 3.0% Males2.9% FemalesUnemployment rate for Black residents 15.8% FemalesUnemployment rate for two or more race residents 15.0% Males10.9% Females
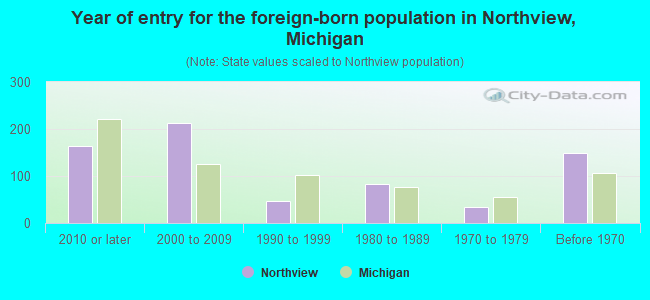
Year of entry for the foreign-born population in Northview, Michigan
163 2010 or later 213 2000 to 2009 47 1990 to 1999 83 1980 to 1989 34 1970 to 1979 148 Before 1970
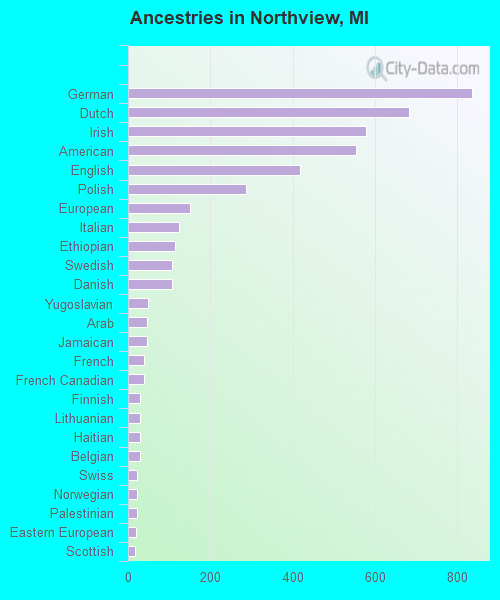
First ancestries reported:
German: 836 (16.2%)
Dutch: 684 (13.2%)
Irish: 578 (11.2%)
American: 555 (10.7%)
English: 418 (8.1%)
Polish: 287 (5.6%)
European: 151 (2.9%)
Italian: 125 (2.4%)
Ethiopian: 114 (2.2%)
Swedish: 107 (2.1%)
Danish: 106 (2.1%)
Yugoslavian: 48 (0.9%)
Arab: 46 (0.9%)
Jamaican: 45 (0.9%)
French: 39 (0.8%)
French Canadian: 39 (0.8%)
Finnish: 29 (0.6%)
Lithuanian: 29 (0.6%)
Haitian: 29 (0.6%)
Belgian: 28 (0.5%)
Swiss: 23 (0.4%)
Norwegian: 22 (0.4%)
Palestinian: 21 (0.4%)
Eastern European: 20 (0.4%)
Scottish: 17 (0.3%)
Austrian: 15 (0.3%)
Luxembourger: 14 (0.3%)
South African: 14 (0.3%)
Scotch-Irish: 13 (0.3%)
Brazilian: 9 (0.2%)
Ukrainian: 9 (0.2%)
Czechoslovakian: 6 (0.1%)
Pennsylvania German: 4 (0.08%) Most common places of birth for foreign-born residents (%): Canada Northview:
14.3% (75)Michigan:
5.0% (35,052)
Bosnia and Herzegovina Northview:
9.2% (48)Michigan:
0.9% (6,009)
United Kingdom, excluding England and Scotland Northview:
8.6% (45)Michigan:
0.8% (5,492)
Kuwait Northview:
6.7% (35)Michigan:
0.2% (1,324)
Eritrea Northview:
6.7% (35)Michigan:
0.1% (550)
Mexico Northview:
6.7% (35)Michigan:
10.9% (75,965)
Netherlands Northview:
5.0% (26)Michigan:
0.5% (3,681)
Korea Northview:
4.6% (24)Michigan:
3.0% (20,884)
Colombia Northview:
4.4% (23)Michigan:
0.6% (3,969)
Vietnam Northview:
4.2% (22)Michigan:
1.8% (12,679)
Haiti Northview:
3.3% (17)Michigan:
0.2% (1,481)
England Northview:
2.5% (13)Michigan:
0.9% (6,424)
Ukraine Northview:
2.1% (11)Michigan:
1.0% (6,829)
Germany Northview:
2.1% (11)Michigan:
2.3% (16,126)
Brazil Northview:
1.7% (9)Michigan:
1.1% (7,485)
Philippines Northview:
1.5% (8)Michigan:
2.8% (19,112)
Place of birth for U.S.-born residents:
This state: 12,457Other state: 2,394Northeast: 304Midwest: 1,235South: 539West: 261 88.9% of Northview residents lived in the same house 1 years ago.
Out of people who lived in different houses, 42.2% lived in this county.
Out of people who lived in different counties, 33.3% lived in Michigan.
Northview:
88.9%State average:
88.4%
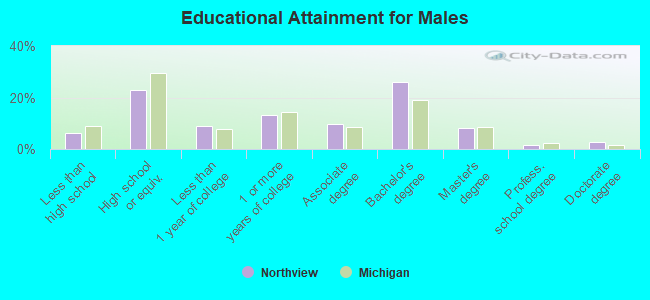
Education attainment for males 25 years and older:
No schooling: 81Nursery to 4th grade: 05th and 6th grade: 07th and 8th grade: 119th grade: 2410th grade: 13911th grade: 112th grade, no diploma: 72High school graduate (or equivalency): 1,178Less than 1 year of college: 471Some college more than 1 year, no degree: 677Associate degree: 505Bachelor's degree: 1,348Master's degree: 428Professional school degree: 83Doctorate degree: 146
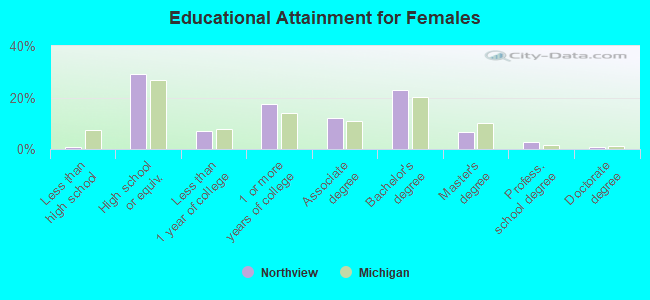
Education attainment for females 25 years and older:
No schooling: 2Nursery to 4th grade: 05th and 6th grade: 07th and 8th grade: 49th grade: 910th grade: 711th grade: 2812th grade, no diploma: 0High school graduate (or equivalency): 1,766Less than 1 year of college: 427Some college more than 1 year, no degree: 1,058Associate degree: 723Bachelor's degree: 1,397Master's degree: 412Professional school degree: 176Doctorate degree: 56
Housing units in structures:
One, detached: 4,668One, attached: 909Two: 163 or 4: 2565 to 9: 33910 to 19: 13720 to 49: 19550 or more: 145Mobile homes: 111Median worth of mobile homes: $20,950
Housing units lacking complete plumbing facilities in 2022: 1.3%Housing units lacking complete kitchen facilities in 2022: 1.7%House/condo owner moved in on average 13 years ago
Renter moved in on average 1 years ago
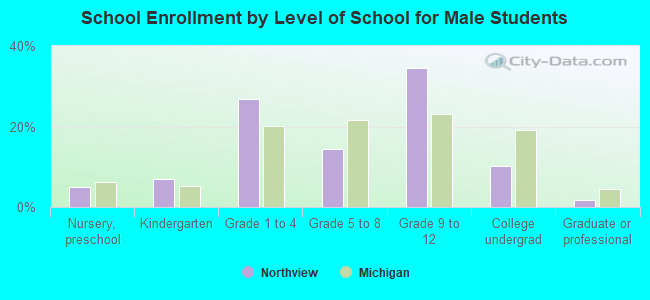
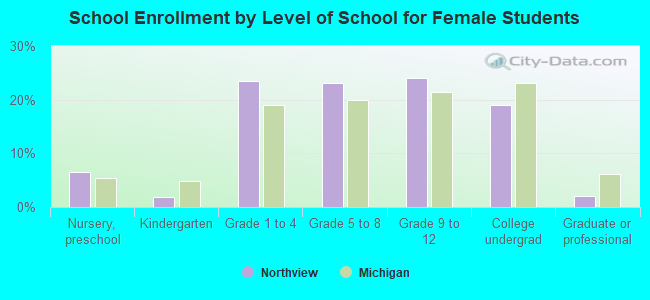
Private vs. public school enrollment:
Students in private schools in grades 1 to 8 (elementary and middle school): 210 Students in private schools in grades 9 to 12 (high school): 53 Students in private undergraduate colleges: 65