Races in Northview, Michigan (MI) Detailed Stats
Data:
Races - White alone (%)
Races - White alone (% change since 2000)
Races - Black alone (%)
Races - Black alone (% change since 2000)
Races - American Indian alone (%)
Races - American Indian alone (% change since 2000)
Races - Asian alone (%)
Races - Asian alone (% change since 2000)
Races - Hispanic (%)
Races - Hispanic (% change since 2000)
Races - Native Hawaiian and Other Pacific Islander alone (%)
Races - Native Hawaiian and Other Pacific Islander alone (% change since 2000)
Races - Two or more races(%)
Races - Two or more races(% change since 2000)
Races - Other race alone (%)
Races - Other race alone (% change since 2000)
Racial diversity
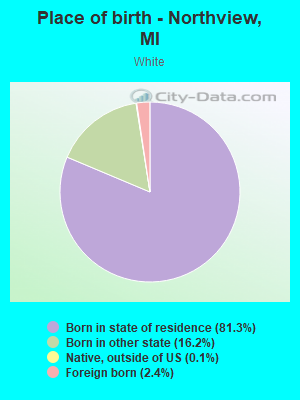
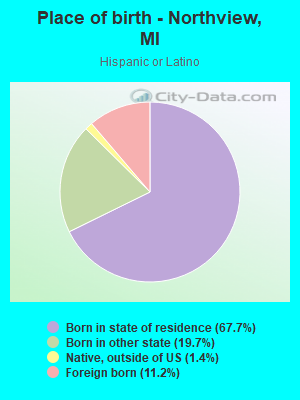
Place of birth - Born in state of residence (%)
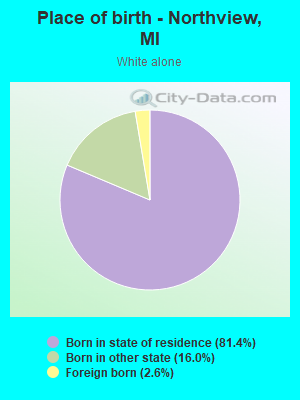
Place of birth - Born in state of residence (%) - White
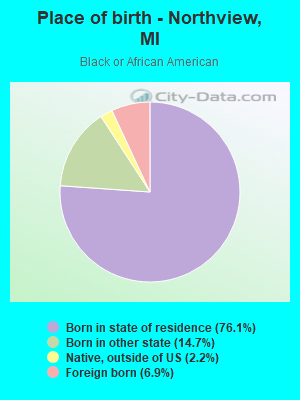
Place of birth - Born in state of residence (%) - Black or African American
Place of birth - Born in state of residence (%) - Asian
Place of birth - Born in state of residence (%) - Hispanic or Latino
Place of birth - Born in state of residence (%) - American Indian and Alaska Native
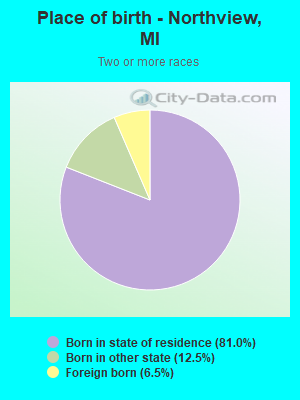
Place of birth - Born in state of residence (%) - Multirace
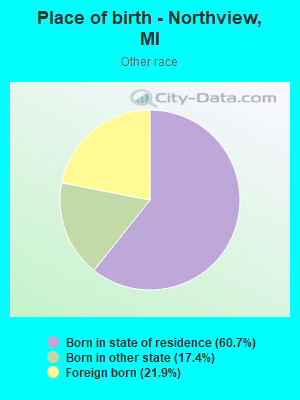
Place of birth - Born in state of residence (%) - Other Race
Place of birth - Born in other state (%)
Place of birth - Born in other state (%) - White
Place of birth - Born in other state (%) - Black or African American
Place of birth - Born in other state (%) - Asian
Place of birth - Born in other state (%) - Hispanic or Latino
Place of birth - Born in other state (%) - American Indian and Alaska Native
Place of birth - Born in other state (%) - Multirace
Place of birth - Born in other state (%) - Other Race
Place of birth - Native, outside of US (%)
Place of birth - Native, outside of US (%) - White
Place of birth - Native, outside of US (%) - Black or African American
Place of birth - Native, outside of US (%) - Asian
Place of birth - Native, outside of US (%) - Hispanic or Latino
Place of birth - Native, outside of US (%) - American Indian and Alaska Native
Place of birth - Native, outside of US (%) - Multirace
Place of birth - Native, outside of US (%) - Other Race
Place of birth - Foreign born (%)
Place of birth - Foreign born (%) - White
Place of birth - Foreign born (%) - Black or African American
Place of birth - Foreign born (%) - Asian
Place of birth - Foreign born (%) - Hispanic or Latino
Place of birth - Foreign born (%) - American Indian and Alaska Native
Place of birth - Foreign born (%) - Multirace
Place of birth - Foreign born (%) - Other Race
Residents speaking English at home (%)
Residents speaking English at home - Born in the United States (%)
Residents speaking English at home - Native, born elsewhere (%)
Residents speaking English at home - Foreign born (%)
Residents speaking Spanish at home (%)
Residents speaking Spanish at home - Born in the United States (%)
Residents speaking Spanish at home - Native, born elsewhere (%)
Residents speaking Spanish at home - Foreign born (%)
Residents speaking other language at home (%)
Residents speaking other language at home - Born in the United States (%)
Residents speaking other language at home - Native, born elsewhere (%)
Residents speaking other language at home - Foreign born (%)
Marital status - Never married (%)
Marital status - Now married (%)
Marital status - Separated (%)
Marital status - Widowed (%)
Marital status - Divorced (%)
Ancestries Reported - Arab (%)
Ancestries Reported - Czech (%)
Ancestries Reported - Danish (%)
Ancestries Reported - Dutch (%)
Ancestries Reported - English (%)
Ancestries Reported - French (%)
Ancestries Reported - French Canadian (%)
Ancestries Reported - German (%)
Ancestries Reported - Greek (%)
Ancestries Reported - Hungarian (%)
Ancestries Reported - Irish (%)
Ancestries Reported - Italian (%)
Ancestries Reported - Lithuanian (%)
Ancestries Reported - Norwegian (%)
Ancestries Reported - Polish (%)
Ancestries Reported - Portuguese (%)
Ancestries Reported - Russian (%)
Ancestries Reported - Scotch-Irish (%)
Ancestries Reported - Scottish (%)
Ancestries Reported - Slovak (%)
Ancestries Reported - Subsaharan African (%)
Ancestries Reported - Swedish (%)
Ancestries Reported - Swiss (%)
Ancestries Reported - Ukrainian (%)
Ancestries Reported - United States (%)
Ancestries Reported - Welsh (%)
Ancestries Reported - West Indian (%)
Ancestries Reported - Other (%)
Geographical mobility - Same house 1 year ago (%)
Geographical mobility - Same house 1 year ago (%) - White
Geographical mobility - Same house 1 year ago (%) - Black or African American
Geographical mobility - Same house 1 year ago (%) - Asian
Geographical mobility - Same house 1 year ago (%) - Hispanic or Latino
Geographical mobility - Same house 1 year ago (%) - American Indian and Alaska Native
Geographical mobility - Same house 1 year ago (%) - Multirace
Geographical mobility - Same house 1 year ago (%) - Other Race
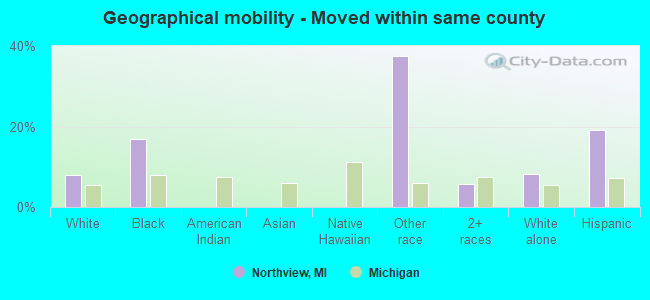
Geographical mobility - Moved within same county (%)
Geographical mobility - Moved within same county (%) - White
Geographical mobility - Moved within same county (%) - Black or African American
Geographical mobility - Moved within same county (%) - Asian
Geographical mobility - Moved within same county (%) - Hispanic or Latino
Geographical mobility - Moved within same county (%) - American Indian and Alaska Native
Geographical mobility - Moved within same county (%) - Multirace
Geographical mobility - Moved within same county (%) - Other Race
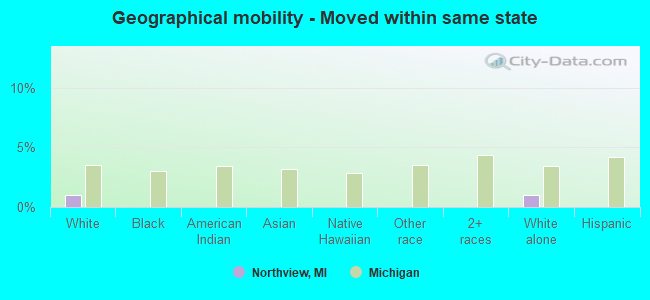
Geographical mobility - Moved from different county within same state (%)
Geographical mobility - Moved from different county within same state (%) - White
Geographical mobility - Moved from different county within same state (%) - Black or African American
Geographical mobility - Moved from different county within same state (%) - Asian
Geographical mobility - Moved from different county within same state (%) - Hispanic or Latino
Geographical mobility - Moved from different county within same state (%) - American Indian and Alaska Native
Geographical mobility - Moved from different county within same state (%) - Multirace
Geographical mobility - Moved from different county within same state (%) - Other Race
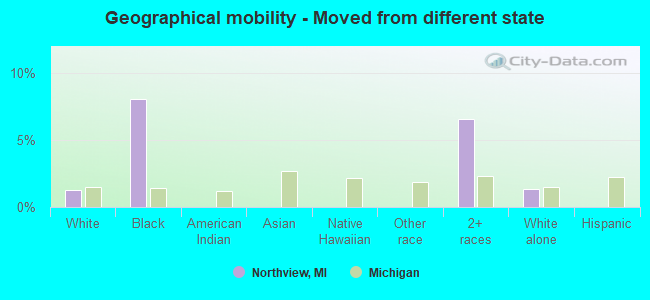
Geographical mobility - Moved from different state (%)
Geographical mobility - Moved from different state (%) - White
Geographical mobility - Moved from different state (%) - Black or African American
Geographical mobility - Moved from different state (%) - Asian
Geographical mobility - Moved from different state (%) - Hispanic or Latino
Geographical mobility - Moved from different state (%) - American Indian and Alaska Native
Geographical mobility - Moved from different state (%) - Multirace
Geographical mobility - Moved from different state (%) - Other Race
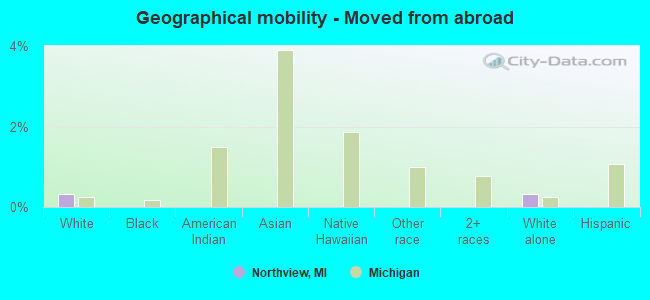
Geographical mobility - Moved from abroad (%)
Geographical mobility - Moved from abroad (%) - White
Geographical mobility - Moved from abroad (%) - Black or African American
Geographical mobility - Moved from abroad (%) - Asian
Geographical mobility - Moved from abroad (%) - Hispanic or Latino
Geographical mobility - Moved from abroad (%) - American Indian and Alaska Native
Geographical mobility - Moved from abroad (%) - Multirace
Geographical mobility - Moved from abroad (%) - Other Race
Place of birth for the foreign-born population - Ireland (%)
Place of birth for the foreign-born population - Denmark (%)
Place of birth for the foreign-born population - Norway (%)
Place of birth for the foreign-born population - Sweden (%)
Place of birth for the foreign-born population - United Kingdom (%)
Place of birth for the foreign-born population - England (%)
Place of birth for the foreign-born population - Scotland (%)
Place of birth for the foreign-born population - Other Northern Europe (%)
Place of birth for the foreign-born population - Austria (%)
Place of birth for the foreign-born population - Belgium (%)
Place of birth for the foreign-born population - France (%)
Place of birth for the foreign-born population - Germany (%)
Place of birth for the foreign-born population - Netherlands (%)
Place of birth for the foreign-born population - Switzerland (%)
Place of birth for the foreign-born population - Other Western Europe (%)
Place of birth for the foreign-born population - Greece (%)
Place of birth for the foreign-born population - Italy (%)
Place of birth for the foreign-born population - Portugal (%)
Place of birth for the foreign-born population - Spain (%)
Place of birth for the foreign-born population - Other Southern Europe (%)
Place of birth for the foreign-born population - Albania (%)
Place of birth for the foreign-born population - Belarus (%)
Place of birth for the foreign-born population - Bosnia and Herzegovina (%)
Place of birth for the foreign-born population - Bulgaria (%)
Place of birth for the foreign-born population - Croatia (%)
Place of birth for the foreign-born population - Czechoslovakia (%)
Place of birth for the foreign-born population - Hungary (%)
Place of birth for the foreign-born population - Latvia (%)
Place of birth for the foreign-born population - Lithuania (%)
Place of birth for the foreign-born population - North Macedonia (Macedonia) (%)
Place of birth for the foreign-born population - Moldova (%)
Place of birth for the foreign-born population - Poland (%)
Place of birth for the foreign-born population - Romania (%)
Place of birth for the foreign-born population - Russia (%)
Place of birth for the foreign-born population - Serbia (%)
Place of birth for the foreign-born population - Ukraine (%)
Place of birth for the foreign-born population - Other Eastern Europe (%)
Place of birth for the foreign-born population - China (%)
Place of birth for the foreign-born population - Hong Kong (%)
Place of birth for the foreign-born population - Taiwan (%)
Place of birth for the foreign-born population - Japan (%)
Place of birth for the foreign-born population - Korea (%)
Place of birth for the foreign-born population - Other Eastern Asia (%)
Place of birth for the foreign-born population - Afghanistan (%)
Place of birth for the foreign-born population - Bangladesh (%)
Place of birth for the foreign-born population - India (%)
Place of birth for the foreign-born population - Iran (%)
Place of birth for the foreign-born population - Kazakhstan (%)
Place of birth for the foreign-born population - Nepal (%)
Place of birth for the foreign-born population - Pakistan (%)
Place of birth for the foreign-born population - Sri Lanka (%)
Place of birth for the foreign-born population - Uzbekistan (%)
Place of birth for the foreign-born population - Other South Central Asia (%)
Place of birth for the foreign-born population - Burma (%)
Place of birth for the foreign-born population - Cambodia (%)
Place of birth for the foreign-born population - Indonesia (%)
Place of birth for the foreign-born population - Laos (%)
Place of birth for the foreign-born population - Malaysia (%)
Place of birth for the foreign-born population - Philippines (%)
Place of birth for the foreign-born population - Singapore (%)
Place of birth for the foreign-born population - Thailand (%)
Place of birth for the foreign-born population - Vietnam (%)
Place of birth for the foreign-born population - Other South Eastern Asia (%)
Place of birth for the foreign-born population - Armenia (%)
Place of birth for the foreign-born population - Iraq (%)
Place of birth for the foreign-born population - Israel (%)
Place of birth for the foreign-born population - Jordan (%)
Place of birth for the foreign-born population - Kuwait (%)
Place of birth for the foreign-born population - Lebanon (%)
Place of birth for the foreign-born population - Saudi Arabia (%)
Place of birth for the foreign-born population - Syria (%)
Place of birth for the foreign-born population - Turkey (%)
Place of birth for the foreign-born population - Yemen (%)
Place of birth for the foreign-born population - Other Western Asia (%)
Place of birth for the foreign-born population - Eritrea (%)
Place of birth for the foreign-born population - Ethiopia (%)
Place of birth for the foreign-born population - Kenya (%)
Place of birth for the foreign-born population - Somalia (%)
Place of birth for the foreign-born population - Uganda (%)
Place of birth for the foreign-born population - Zimbabwe (%)
Place of birth for the foreign-born population - Other Eastern Africa (%)
Place of birth for the foreign-born population - Cameroon (%)
Place of birth for the foreign-born population - Congo (%)
Place of birth for the foreign-born population - Democratic Republic of Congo (Zaire) (%)
Place of birth for the foreign-born population - Other Middle Africa (%)
Place of birth for the foreign-born population - Egypt (%)
Place of birth for the foreign-born population - Morocco (%)
Place of birth for the foreign-born population - Sudan (%)
Place of birth for the foreign-born population - Other Northern Africa (%)
Place of birth for the foreign-born population - South Africa (%)
Place of birth for the foreign-born population - Other Southern Africa (%)
Place of birth for the foreign-born population - Cabo Verde (%)
Place of birth for the foreign-born population - Ghana (%)
Place of birth for the foreign-born population - Liberia (%)
Place of birth for the foreign-born population - Nigeria (%)
Place of birth for the foreign-born population - Senegal (%)
Place of birth for the foreign-born population - Sierra Leone (%)
Place of birth for the foreign-born population - Other Western Africa (%)
Place of birth for the foreign-born population - Australia (%)
Place of birth for the foreign-born population - New Zealand (%)
Place of birth for the foreign-born population - Fiji (%)
Place of birth for the foreign-born population - Micronesia (%)
Place of birth for the foreign-born population - Bahamas (%)
Place of birth for the foreign-born population - Barbados (%)
Place of birth for the foreign-born population - Cuba (%)
Place of birth for the foreign-born population - Dominica (%)
Place of birth for the foreign-born population - Dominican Republic (%)
Place of birth for the foreign-born population - Grenada (%)
Place of birth for the foreign-born population - Haiti (%)
Place of birth for the foreign-born population - Jamaica (%)
Place of birth for the foreign-born population - St. Vincent and the Grenadines (%)
Place of birth for the foreign-born population - Trinidad and Tobago (%)
Place of birth for the foreign-born population - West Indies (%)
Place of birth for the foreign-born population - Other Caribbean (%)
Place of birth for the foreign-born population - Belize (%)
Place of birth for the foreign-born population - Costa Rica (%)
Place of birth for the foreign-born population - El Salvador (%)
Place of birth for the foreign-born population - Guatemala (%)
Place of birth for the foreign-born population - Honduras (%)
Place of birth for the foreign-born population - Mexico (%)
Place of birth for the foreign-born population - Nicaragua (%)
Place of birth for the foreign-born population - Panama (%)
Place of birth for the foreign-born population - Other Central America (%)
Place of birth for the foreign-born population - Argentina (%)
Place of birth for the foreign-born population - Bolivia (%)
Place of birth for the foreign-born population - Brazil (%)
Place of birth for the foreign-born population - Chile (%)
Place of birth for the foreign-born population - Colombia (%)
Place of birth for the foreign-born population - Ecuador (%)
Place of birth for the foreign-born population - Guyana (%)
Place of birth for the foreign-born population - Peru (%)
Place of birth for the foreign-born population - Uruguay (%)
Place of birth for the foreign-born population - Venezuela (%)
Place of birth for the foreign-born population - Other South America (%)
Place of birth for the foreign-born population - Canada (%)
Place of birth for the foreign-born population - Other Northern America (%)
Place of birth for the foreign-born population - Other (%)
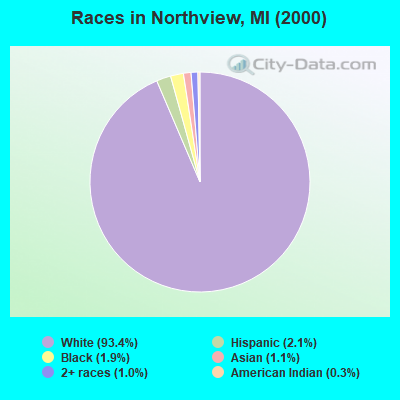
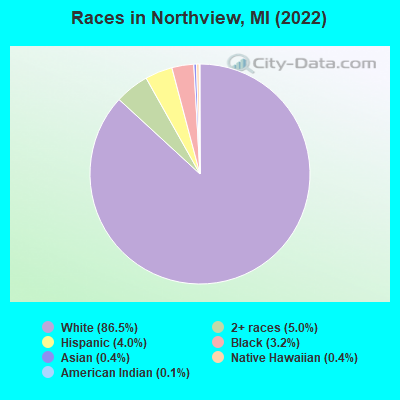
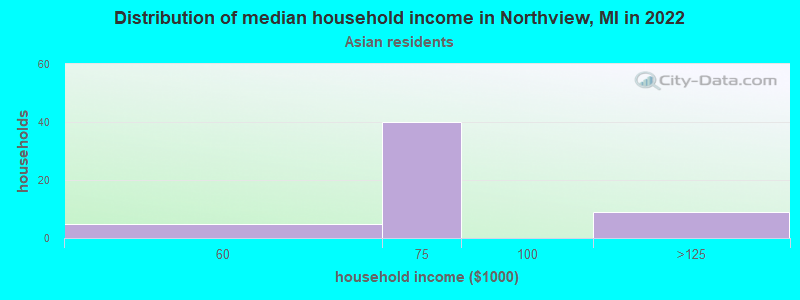
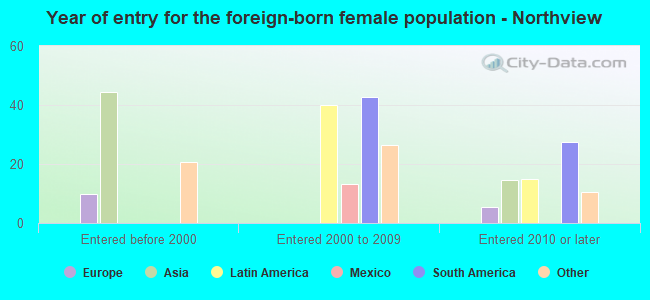
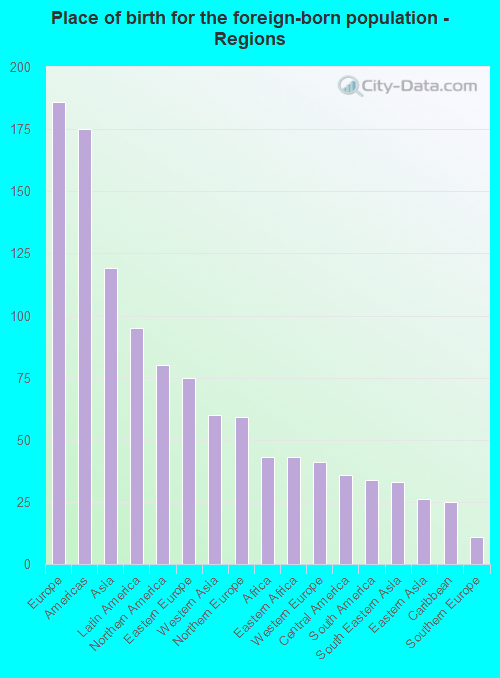
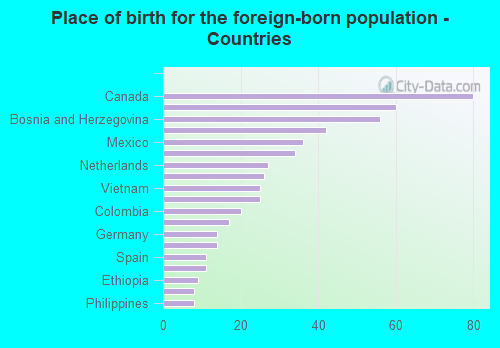
According to 2022 data, the most numerous races in Northview, MI are White alone (13,373 residents), Black alone (495 residents), and Hispanic (620 residents). 96.3% of Northview residents speak English at home. 3.4% of Northview, MI residents are foreign-born (1.2% born in Europe, 0.8% born in Asia, 0.6% born in Latin America, 0.5% born in North America), which is 77.5% less than the foreign-born rate of 6.0% across the entire state of Michigan.
Race distribution in Northview
2000 2022
7,806,691 78.6% White alone 1,402,047 14.1% Black alone 323,877 3.3% Hispanic 175,311 1.8% Asian alone 163,487 1.6% Two or more races 53,421 0.5% American Indian alone 11,465 0.1% Other race alone 2,145 0.02% Native Hawaiian and Other
7,289,051 72.6% White alone 1,310,464 13.1% Black alone 572,405 5.7% Hispanic 450,031 4.5% Two or more races 335,732 3.3% Asian alone 45,217 0.5% Other race alone 29,011 0.3% American Indian alone 2,207 0.02% Native Hawaiian and Other
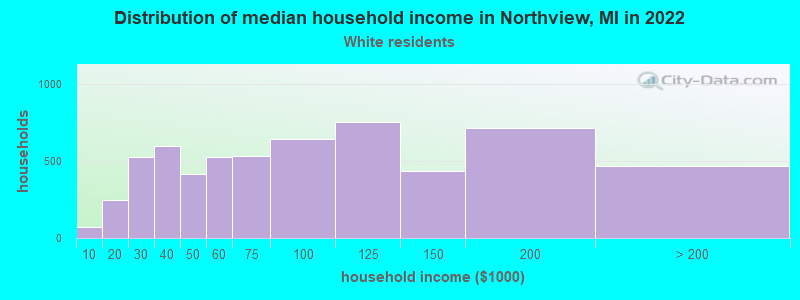
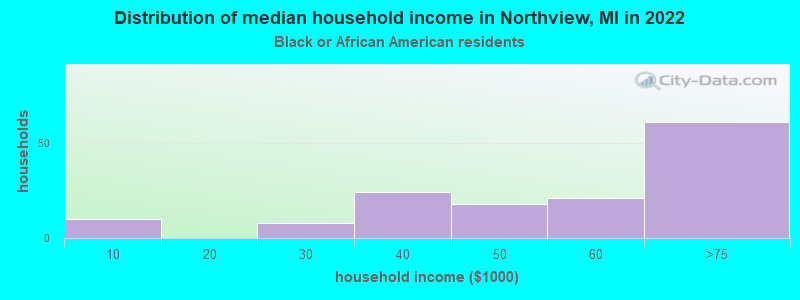
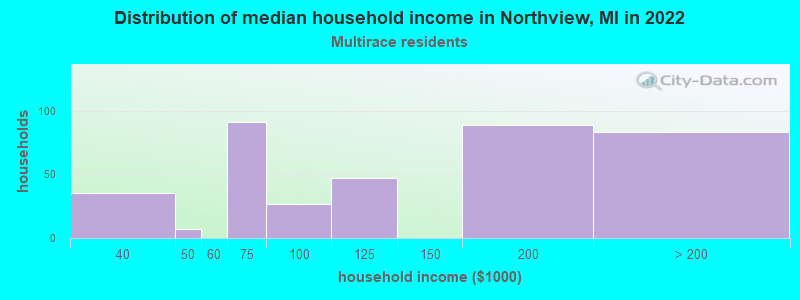
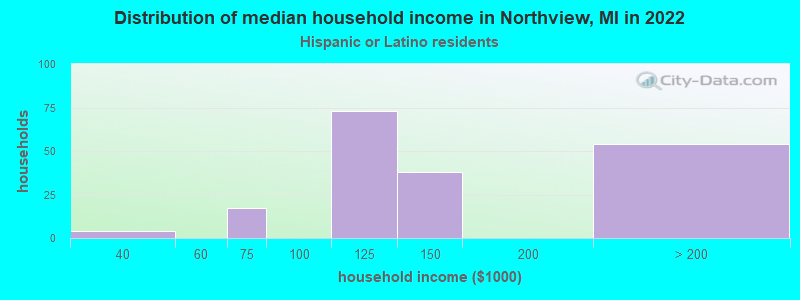
Income and house value in Northview Median household income in 2022 $78,099 White non-Hispanic householders$49,919 Black householders$65,307 Asian householders$150,009 Two or more races householders$114,135 Hispanic or Latino race householdersMedian 2022 house value $284,449 White Non-Hispanic householders$252,790 Black or African American householders$227,847 American Indian or Alaska Native householders $329,778 Asian householders$329,778 Some other race householders$167,887 Two or more races householders$329,778 Hispanic or Latino householders
Median age by race in Northview
43.6 Median age for White residents41.5 47.4 31.1 Median age for Black or African American residents31.9 27.1 -697,722,566.6 Median age for American Indian / Alaska Native residents-697,626,418.3 -677,018,632.9 34.2 Median age for Asian residents-685,128,204.4 34.4 -670,531,400.3 Median age for Native Hawaiian / Pacific Islander residents-674,772,035.8 -699,588,476.7 22.8 Median age for Other race residents21.5 18.6 17.9 Median age for Two or more races residents20.8 16.7 43.4 Median age for White alone residents41.1 47.7 23.7 Median age for Hispanic or Latino residents21.9 30.2
Owner/renter occupied households by race in Northview
House owners and renters - White residents 4,457 75.4% Owner occupied1,457 24.6% Renter occupiedHouse owners and renters - Black or African American residents 59 35.6% Owner occupied106 64.4% Renter occupiedHouse owners and renters - Asian residents 48 100.0% Owner occupiedHouse owners and renters - Native Hawaiian / Pacific Islander residents 29 100.0% Renter occupiedHouse owners and renters - Other race residents 10 100.0% Owner occupiedHouse owners and renters - Two or more races residents 399 100.0% Owner occupiedHouse owners and renters - White alone residents 4,474 76.5% Owner occupied1,378 23.5% Renter occupiedHouse owners and renters - Hispanic or Latino residents 125 60.3% Owner occupied82 39.7% Renter occupied
Language usage in Northview
English speakers - Total 96.3% of residents of Northview speak English at home.
1.4% of residents speak Spanish at home 115 54.2% Speak English very well97 45.8% Speak English less than very well1.7% of residents speak other language at home 174 70.2% Speak English very well74 29.8% Speak English less than very well
All residents speak only English at home
English speakers - Native, born elsewhere 0.0% of residents of Northview speak English at home.
32.0% of residents speak Spanish at home 8 100.0% Speak English very well24.0% of residents speak other language at home 6 100.0% Speak English very well
English speakers - Foreign-born 47.3% of residents of Northview speak English at home.
12.8% of residents speak Spanish at home 33 47.1% Speak English very well37 52.9% Speak English less than very well34.7% of residents speak other language at home 117 61.9% Speak English very well72 38.1% Speak English less than very well
White (Caucasian) - Speak only English Native:
99.3% (12,485)Foreign-born:
64.0% (200)
White (Caucasian) - Speak another language Native:
0.9% (109)Foreign-born:
37.9% (119)
Black or African American - Speak only English Native:
92.4% (413)Foreign-born:
14.4% (5)
Black or African American - Speak another language Native:
7.9% (35)Foreign-born:
85.8% (30)
Other race - Speak another language Native:
8.5% (7)Foreign-born:
99.2% (23)
Two or more races - Speak only English Native:
92.3% (954)Foreign-born:
55.4% (44)
Two or more races - Speak another language Native:
4.1% (42)Foreign-born:
44.5% (35)
White alone - Speak only English Native:
99.0% (12,392)Foreign-born:
54.5% (190)
White alone - Speak another language Native:
0.9% (107)Foreign-born:
39.6% (138)
Hispanic or Latino - Speak another language Native:
8.7% (46)Foreign-born:
99.5% (70)
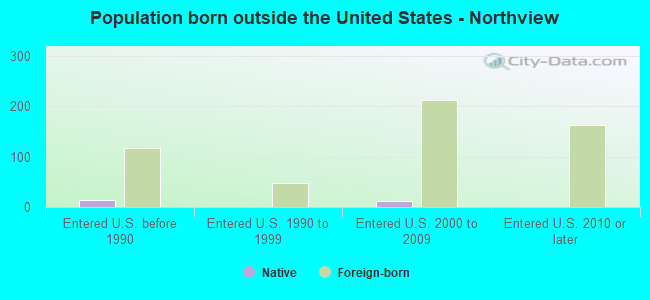
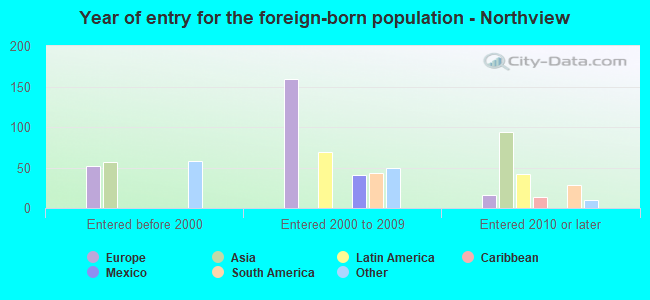
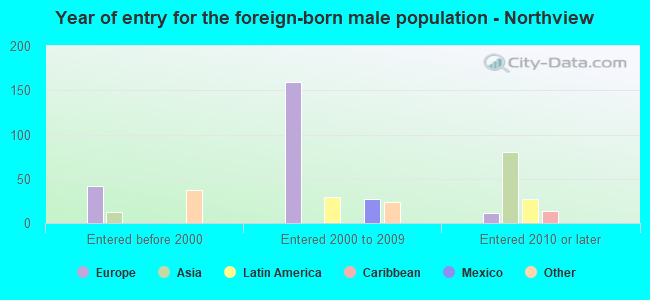
Foreign-born residents in Northview 523 residents are foreign born (1.2% Europe , 0.8% Asia , 0.6% Latin America , 0.5% North America ).
This city:
3.4%Michigan:
6.9%
Marital status for residents in Northview Marital status - White (Caucasian) population 15 years and over
Males 27.8% Never married61.2% Now married0.9% Separated0.8% Widowed9.3% DivorcedFemales 23.0% Never married53.5% Now married0.6% Separated9.1% Widowed13.9% DivorcedWomen who gave birth in the past 12 months Now married:
71.4% (53)Unmarried:
28.6% (21)
Women who did not give birth in the past 12 months Now married:
43.1% (1,207)Unmarried:
56.9% (1,596)
Marital status - Black or African American population 15 years and over
Males 26.6% Never married7.0% Now married0.0% Separated0.0% Widowed66.3% DivorcedFemales 76.1% Never married13.7% Now married0.0% Separated5.1% Widowed5.1% DivorcedWomen who did not give birth in the past 12 months Now married:
17.9% (27)Unmarried:
82.1% (124)
Marital status - Asian population 15 years and over
Males 0.0% Never married100.0% Now married0.0% Separated0.0% Widowed0.0% DivorcedFemales 4.2% Never married79.2% Now married0.0% Separated16.7% Widowed0.0% DivorcedWomen who did not give birth in the past 12 months Now married:
100.0% (40)Unmarried:
0.0% (0)
Marital status - Other race population 15 years and over
Males 80.0% Never married20.0% Now married0.0% Separated0.0% Widowed0.0% DivorcedFemales 72.1% Never married27.9% Now married0.0% Separated0.0% Widowed0.0% DivorcedWomen who did not give birth in the past 12 months Now married:
27.9% (10)Unmarried:
72.1% (25)
Marital status - Two or more races population 15 years and over
Males 52.4% Never married32.9% Now married0.0% Separated2.0% Widowed12.7% DivorcedFemales 50.3% Never married33.0% Now married6.8% Separated0.0% Widowed9.9% DivorcedWomen who did not give birth in the past 12 months Now married:
37.5% (93)Unmarried:
62.5% (155)
Marital status - White alone, not Hispanic / Latino population 15 years and over
Males 27.9% Never married61.1% Now married1.0% Separated0.8% Widowed9.2% DivorcedFemales 22.0% Never married54.1% Now married0.6% Separated9.2% Widowed14.1% DivorcedWomen who gave birth in the past 12 months Now married:
71.4% (54)Unmarried:
28.6% (21)
Women who did not give birth in the past 12 months Now married:
44.1% (1,212)Unmarried:
55.9% (1,537)
Marital status - Hispanic or Latino population 15 years and over
Males 40.6% Never married32.4% Now married0.0% Separated0.0% Widowed27.1% DivorcedFemales 63.1% Never married36.9% Now married0.0% Separated0.0% Widowed0.0% DivorcedWomen who did not give birth in the past 12 months Now married:
36.9% (62)Unmarried:
63.1% (106)
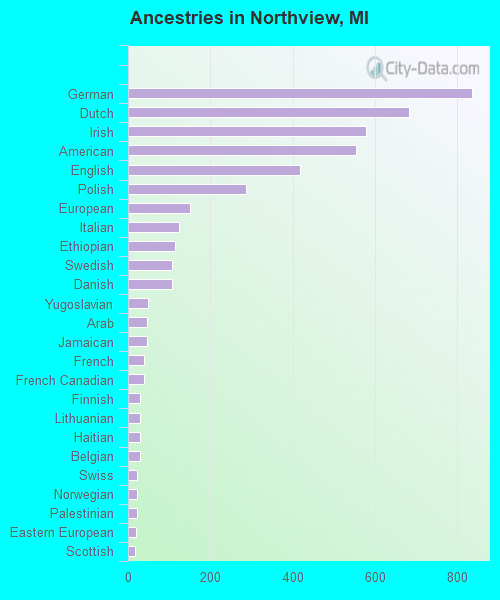
Ancestries in Northview
836 16.2% German684 13.2% Dutch578 11.2% Irish555 10.7% American418 8.1% English287 5.6% Polish151 2.9% European125 2.4% Italian114 2.2% Ethiopian107 2.1% Swedish106 2.1% Danish48 0.9% Yugoslavian46 0.9% Arab45 0.9% Jamaican39 0.8% French39 0.8% French Canadian29 0.6% Finnish29 0.6% Lithuanian29 0.6% Haitian28 0.5% Belgian23 0.4% Swiss22 0.4% Norwegian21 0.4% Palestinian20 0.4% Eastern European17 0.3% Scottish15 0.3% Austrian14 0.3% Luxembourger14 0.3% South African13 0.3% Scotch-Irish9 0.2% Brazilian9 0.2% Ukrainian6 0.1% Czechoslovakian4 0.08% Pennsylvania German
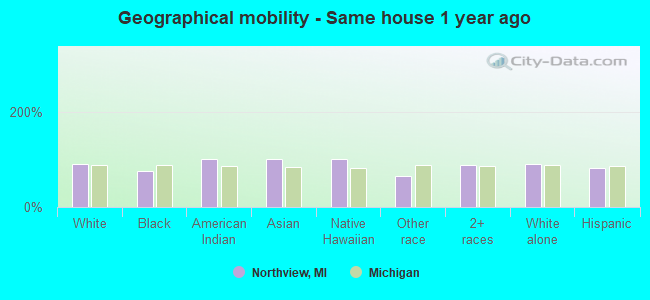
Geographical mobility in Northview Same house 1 year ago 11,926 89.6% White (Caucasian)375 76.5% Black or African American29 100.0% American Indian / Alaska Native61 100.0% Asian32 100.0% Native Hawaiian / Pacific Islander66 65.4% Other race1,114 86.7% Two or more races11,916 89.5% White alone, not Hispanic / Latino509 82.4% Hispanic or LatinoMoved within same county 1,062 8.0% White / Caucasian83 17.0% Black or African American38 37.6% Other race73 5.7% Two or more races1,082 8.1% White alone, not Hispanic / Latino118 19.1% Hispanic or LatinoMoved within same state 134 1.0% White / Caucasian131 1.0% White alone, not Hispanic / LatinoMoved from different state 166 1.2% White / Caucasian39 8.0% Black or African American84 6.5% Two or more races174 1.3% White alone, not Hispanic / LatinoMoved from abroad 43 0.3% White43 0.3% White alone, not Hispanic / Latino
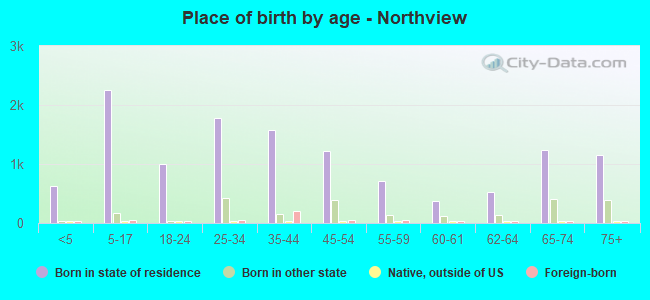
Children Nativity (place of birth) in Northview
Children under 6 years - Living with two parents Both parents native 384 100.0% NativeOne native, one foreign-born parent 91 100.0% NativeChildren under 6 years - Living with one parent Native parent 299 100.0% Native
Children 6 to 17 years - Living with two parents Both parents native 1,137 98.1% Native22 1.9% Foreign-bornBoth parents foreign-born 78 100.0% NativeOne native, one foreign-born parent 37 100.0% NativeChildren 6 to 17 years - Living with one parent Native parent 873 99.0% Native8 1.0% Foreign-born
Grandparents responsible for own grandchildren in Northview
Grandparents (30 to 59 years) White / Caucasian 34 38.5% Responsible for grandchildren55 61.5% Not responsible for grandchildrenWhite alone, not Hispanic / Latino 27 33.1% Responsible for grandchildren55 66.9% Not responsible for grandchildrenGrandparents (60 years and over) White / Caucasian 14 8.0% Responsible for grandchildren156 92.0% Not responsible for grandchildrenWhite alone, not Hispanic / Latino 14 7.3% Responsible for grandchildren171 92.7% Not responsible for grandchildren