Novi, MI (Michigan) Houses and Residents
Estimated median house or condo value in 2022: $418,800 (it was $214,600 in 2000 )
Novi:
$418,800Michigan:
$224,400
Lower value quartile - upper value quartile: $267,200 - $585,000Mean price in 2022: Detached houses: $501,007 Here:
$501,007State:
$280,038
Townhouses or other attached units: $238,778 Here:
$238,778State:
$239,520
In 2-unit structures: $176,270 Here:
$176,270State:
$219,481
In 3-to-4-unit structures: $286,827 Here:
$286,827State:
$207,067
In 5-or-more-unit structures: $269,795 Here:
$269,795State:
$192,733
Mobile homes: $47,148 Here:
$47,148State:
$72,868
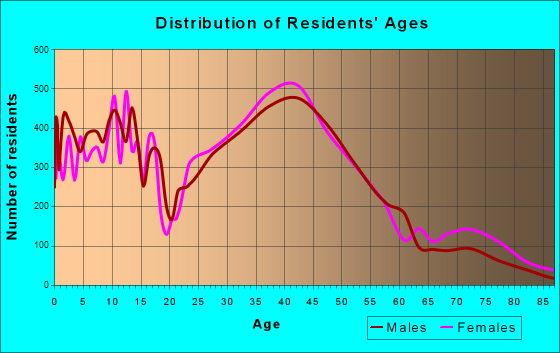
Total population: 58,416 (Urban population: 45,856, Rural population: 1,603 (all nonfarm) )
Houses: 29,611 (27,029 occupied: 17,372 owner occupied, 9,657 renter occupied )
% of renters here:
36%State:
27%
Housing density: 972 houses/condos per square mile
Median price asked for vacant for-sale houses and condos in 2022: $2,177,534.
Median contract rent in 2022: $1,656 (lower quartile is $1,169, upper quartile is over $2,000)
Median rent asked for vacant for-rent units in 2022: $3,357
Median gross rent in Novi, MI in 2022: $1,801
Housing units in Novi with a mortgage: 10,429 (1,091 second mortgage, 0 home equity loan, 1,091 both second mortgage and home equity loan )Houses without a mortgage: 284
Median household income for houses/condos with a mortgage: $141,199
Median household income for apartments without a mortgage: $107,114
Median monthly housing costs: $1,614
Data:
Median house or condo value ($)
Median house or condo value ($ change since 2000)
Median house or condo value ($) - White
Median house or condo value ($) - Black or African American
Median house or condo value ($) - Asian
Median house or condo value ($) - Hispanic or Latino
Median house or condo value ($) - American Indian and Alaska Native
Median house or condo value ($) - Multirace
Median house or condo value ($) - Other Race
Median price asked for mobile homes ($)
Household density (households per square mile)
Mean house or condo value by units in structure - 1, detached ($)
Mean house or condo value by units in structure - 1, attached ($)
Mean house or condo value by units in structure - 2 ($)
Mean house or condo value by units in structure by units in structure - 3 or 4 ($)
Mean house or condo value by units in structure - 5 or more ($)
Mean house or condo value by units in structure - Boat, RV, van, etc. ($)
Mean house or condo value by units in structure - Mobile home ($)
Median contract rent ($)
Median contract rent - Lower quartile ($)
Median contract rent - Upper quartile ($)
Median gross rent ($)
Urban houses (%)
Rural houses (%)
Houses occupied (%)
Houses occupied (% change since 2000)
Houses owner occupied (%)
Houses owner occupied (% change since 2000)
Houses renter occupied (%)
Houses renter occupied (% change since 2000)
Vacant housing units - For rent (%)
Vacant housing units - For rent (% change since 2000)
Vacant housing units - For sale only (%)
Vacant housing units - For sale only (% change since 2000)
Vacant housing units - Rented or sold, not occupied (%)
Vacant housing units - Rented or sold, not occupied (% change since 2000)
Vacant housing units - For seasonal, recreational, or occasional use (%)
Vacant housing units - For seasonal, recreational, or occasional use (% change since 2000)
Vacant housing units - For migrant workers (%)
Vacant housing units - For migrant workers (% change since 2000)
Vacant housing units - Other vacant (%)
Vacant housing units - Other vacant (% change since 2000)
Median monthly housing costs ($)
Median household income for houses/condos with a mortgage ($)
Median household income for houses/condos without a mortgage ($)
Median household income ($)
Median household income ($) - White
Median household income ($) - Black or African American
Median household income ($) - Asian
Median household income ($) - Hispanic or Latino
Median household income ($) - American Indian and Alaska Native
Median household income ($) - Multirace
Median household income ($) - Other Race
Mortgage status - with mortgage (%)
Mortgage status - with second mortgage (%)
Mortgage status - with home equity loan (%)
Mortgage status - with both second mortgage and home equity loan (%)
Mortgage status - without a mortgage (%)
Median year house/condo built
Median year apartment built
Household type by relationship - Male householder living alone (%)
Household type by relationship - Male householder not living alone (%)
Household type by relationship - Female householder living alone (%)
Household type by relationship - Female householder not living alone (%)
Household type by relationship - Opposite-Sex spouse (%)
Household type by relationship - Same-Sex spouse (%)
Household type by relationship - Opposite-Sex unmarried partner (%)
Household type by relationship - Same-Sex unmarried partner (%)
Household type by relationship - In group quarters (%)
Size of family households - 2-person household (%)
Size of family households - 3-person household (%)
Size of family households - 4-person household (%)
Size of family households - 5-person household (%)
Size of family households - 6-person household (%)
Size of family households - 7-or-more-person household (%)
Size of nonfamily households - 1-person household (%)
Size of nonfamily households - 2-person household (%)
Size of nonfamily households - 3-person household (%)
Size of nonfamily households - 4-person household (%)
Size of nonfamily households - 5-person household (%)
Size of nonfamily households - 6-person household (%)
Size of nonfamily households - 7-or-moreperson household (%)
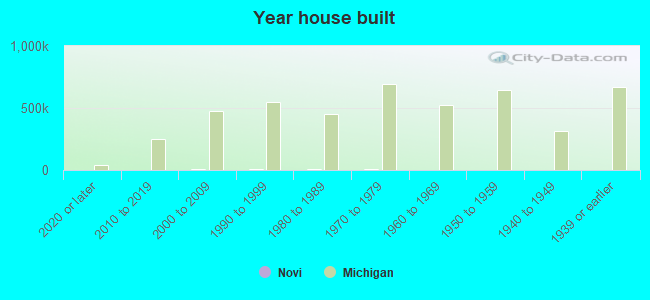
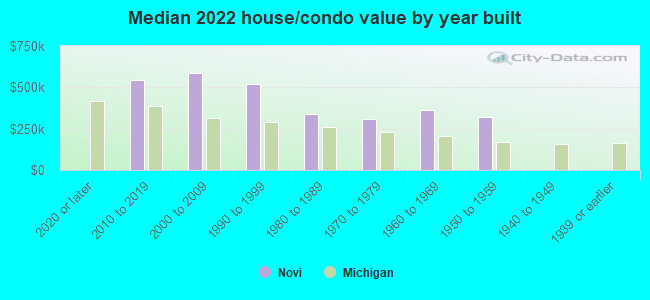
Year house built - Built 2010 or later (%)
Year house built - Built 2000 to 2009 (%)
Year house built - Built 1990 to 1999 (%)
Year house built - Built 1980 to 1989 (%)
Year house built - Built 1970 to 1979 (%)
Year house built - Built 1960 to 1969 (%)
Year house built - Built 1950 to 1959 (%)
Year house built - Built 1940 to 1949 (%)
Year house built - Built 1939 or earlier (%)
Median number of rooms in houses and condos
Median number of rooms in apartments
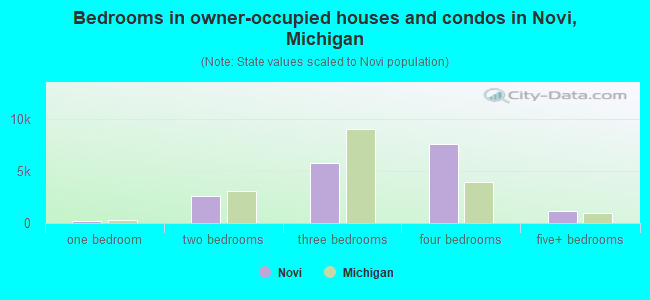
Median number of bedrooms in owner occupied houses
Mean number of bedrooms in owner occupied houses
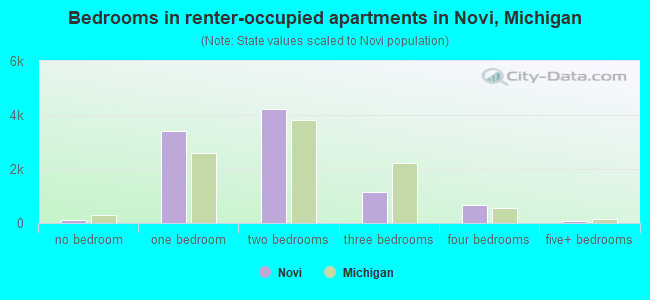
Median number of bedrooms in renter occupied houses
Mean number of bedrooms in renter occupied houses
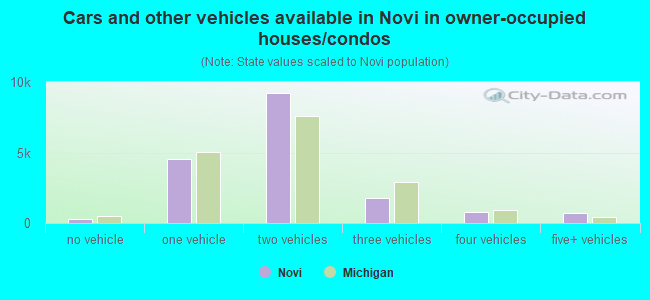
Median number of vehichles in owner occupied houses
Mean number of vehichles in owner occupied houses
Median number of vehichles in renter occupied houses
Mean number of vehichles in renter occupied houses
Rooms in owner-occupied houses - 1 room (%)
Rooms in owner-occupied houses - 2 rooms (%)
Rooms in owner-occupied houses - 3 rooms (%)
Rooms in owner-occupied houses - 4 rooms (%)
Rooms in owner-occupied houses - 5 rooms (%)
Rooms in owner-occupied houses - 6 rooms (%)
Rooms in owner-occupied houses - 7 rooms (%)
Rooms in owner-occupied houses - 8 rooms (%)
Rooms in owner-occupied houses - 9+ rooms (%)
Rooms in renter-occupied houses - 1 room (%)
Rooms in renter-occupied houses - 2 rooms (%)
Rooms in renter-occupied houses - 3 rooms (%)
Rooms in renter-occupied houses - 4 rooms (%)
Rooms in renter-occupied houses - 5 rooms (%)
Rooms in renter-occupied houses - 6 rooms (%)
Rooms in renter-occupied houses - 7 rooms (%)
Rooms in renter-occupied houses - 8 rooms (%)
Rooms in renter-occupied houses - 9+ rooms (%)
Bedrooms in owner-occupied houses - no bedrooms (%)
Bedrooms in owner-occupied houses - 1 bedroom (%)
Bedrooms in owner-occupied houses - 2 bedrooms (%)
Bedrooms in owner-occupied houses - 3 bedrooms (%)
Bedrooms in owner-occupied houses - 4 bedrooms (%)
Bedrooms in owner-occupied houses - 5+ bedrooms (%)
Bedrooms in renter-occupied houses - no bedrooms (%)
Bedrooms in renter-occupied houses - 1 bedroom (%)
Bedrooms in renter-occupied houses - 2 bedrooms (%)
Bedrooms in renter-occupied houses - 3 bedrooms (%)
Bedrooms in renter-occupied houses - 4 bedrooms (%)
Bedrooms in renter-occupied houses - 5+ bedrooms (%)
Vehicles available in owner-occupied houses - no vehicle available (%)
Vehicles available in owner-occupied houses - 1 vehicle available(%)
Vehicles available in owner-occupied houses - 2 Vehicles available (%)
Vehicles available in owner-occupied houses - 3 Vehicles available (%)
Vehicles available in owner-occupied houses - 4 Vehicles available (%)
Vehicles available in owner-occupied houses - 5+ Vehicles available (%)
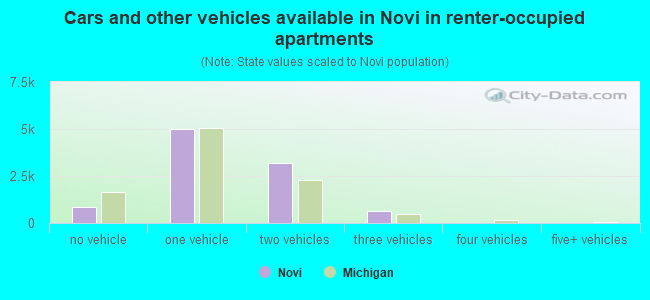
Vehicles available in renter-occupied houses - no vehicle available (%)
Vehicles available in renter-occupied houses - 1 vehicle available (%)
Vehicles available in renter-occupied houses - 2 Vehicles available (%)
Vehicles available in renter-occupied houses - 3 Vehicles available (%)
Vehicles available in renter-occupied houses - 4 Vehicles available (%)
Vehicles available in renter-occupied houses - 5+ Vehicles available (%)
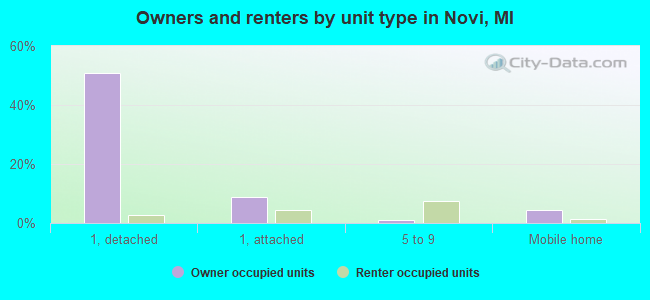
Housing units in structures - 1, detached (%)
Housing units in structures - 1, attached (%)
Housing units in structures - 2 (%)
Housing units in structures - 3 or 4 (%)
Housing units in structures - 5 to 9 (%)
Housing units in structures - 10 to 19 (%)
Housing units in structures - 20 to 49 (%)
Housing units in structures - 50 or more (%)
Housing units in structures - Mobile home (%)
Housing units in structures - Boat, RV, van, etc. (%)
Housing units in structures - Owners - 1, detached (%)
Housing units in structures - Owners - 1, attached (%)
Housing units in structures - Owners - 2 (%)
Housing units in structures - Owners - 3 or 4 (%)
Housing units in structures - Owners - 5 to 9 (%)
Housing units in structures - Owners - 10 to 19 (%)
Housing units in structures - Owners - 20 to 49 (%)
Housing units in structures - Owners - 50 or more (%)
Housing units in structures - Owners - Mobile home (%)
Housing units in structures - Owners - Boat, RV, van, etc. (%)
Housing units in structures - Renters - 1, detached (%)
Housing units in structures - Renters - 1, attached (%)
Housing units in structures - Renters - 2 (%)
Housing units in structures - Renters - 3 or 4 (%)
Housing units in structures - Renters - 5 to 9 (%)
Housing units in structures - Renters - 10 to 19 (%)
Housing units in structures - Renters - 20 to 49 (%)
Housing units in structures - Renters - 50 or more (%)
Housing units in structures - Renters - Mobile home (%)
Housing units in structures - Renters - Boat, RV, van, etc. (%)
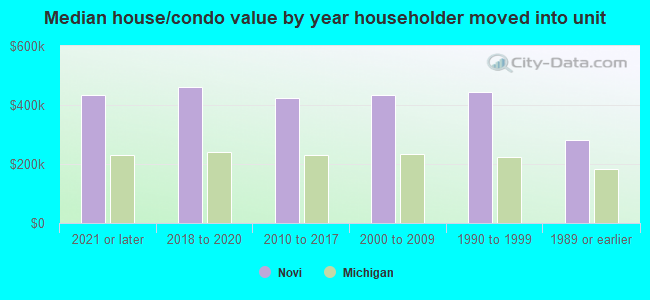
House/condo owner moved in on average (years ago)
Renter moved in on average (years ago)
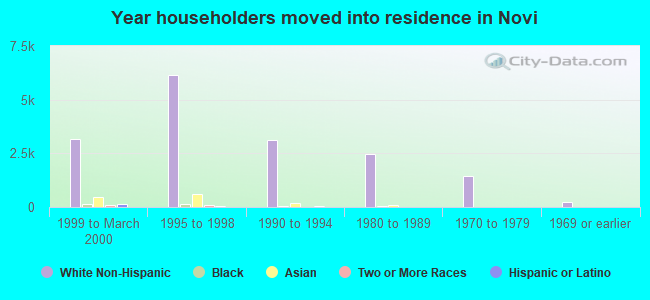
Year householder moved into unit - Moved in 1999 to March 2000 (%)
Year householder moved into unit - Moved in 1999 to March 2000 (%) - White
Year householder moved into unit - Moved in 1999 to March 2000 (%) - Black or African American
Year householder moved into unit - Moved in 1999 to March 2000 (%) - Asian
Year householder moved into unit - Moved in 1999 to March 2000 (%) - Hispanic or Latino
Year householder moved into unit - Moved in 1999 to March 2000 (%) - American Indian and Alaska Native
Year householder moved into unit - Moved in 1999 to March 2000 (%) - Multirace
Year householder moved into unit - Moved in 1999 to March 2000 (%) - Other Race
Year householder moved into unit - Moved in 1995 to 1998 (%)
Year householder moved into unit - Moved in 1995 to 1998 (%) - White
Year householder moved into unit - Moved in 1995 to 1998 (%) - Black or African American
Year householder moved into unit - Moved in 1995 to 1998 (%) - Asian
Year householder moved into unit - Moved in 1995 to 1998 (%) - Hispanic or Latino
Year householder moved into unit - Moved in 1995 to 1998 (%) - American Indian and Alaska Native
Year householder moved into unit - Moved in 1995 to 1998 (%) - Multirace
Year householder moved into unit - Moved in 1995 to 1998 (%) - Other Race
Year householder moved into unit - Moved in 1990 to 1994 (%)
Year householder moved into unit - Moved in 1990 to 1994 (%) - White
Year householder moved into unit - Moved in 1990 to 1994 (%) - Black or African American
Year householder moved into unit - Moved in 1990 to 1994 (%) - Asian
Year householder moved into unit - Moved in 1990 to 1994 (%) - Hispanic or Latino
Year householder moved into unit - Moved in 1990 to 1994 (%) - American Indian and Alaska Native
Year householder moved into unit - Moved in 1990 to 1994 (%) - Multirace
Year householder moved into unit - Moved in 1990 to 1994 (%) - Other Race
Year householder moved into unit - Moved in 1980 to 1989 (%)
Year householder moved into unit - Moved in 1980 to 1989 (%) - White
Year householder moved into unit - Moved in 1980 to 1989 (%) - Black or African American
Year householder moved into unit - Moved in 1980 to 1989 (%) - Asian
Year householder moved into unit - Moved in 1980 to 1989 (%) - Hispanic or Latino
Year householder moved into unit - Moved in 1980 to 1989 (%) - American Indian and Alaska Native
Year householder moved into unit - Moved in 1980 to 1989 (%) - Multirace
Year householder moved into unit - Moved in 1980 to 1989 (%) - Other Race
Year householder moved into unit - Moved in 1970 to 1979 (%)
Year householder moved into unit - Moved in 1970 to 1979 (%) - White
Year householder moved into unit - Moved in 1970 to 1979 (%) - Black or African American
Year householder moved into unit - Moved in 1970 to 1979 (%) - Asian
Year householder moved into unit - Moved in 1970 to 1979 (%) - Hispanic or Latino
Year householder moved into unit - Moved in 1970 to 1979 (%) - American Indian and Alaska Native
Year householder moved into unit - Moved in 1970 to 1979 (%) - Multirace
Year householder moved into unit - Moved in 1970 to 1979 (%) - Other Race
Year householder moved into unit - Moved in 1969 or earlier (%)
Year householder moved into unit - Moved in 1969 or earlier (%) - White
Year householder moved into unit - Moved in 1969 or earlier (%) - Black or African American
Year householder moved into unit - Moved in 1969 or earlier (%) - Asian
Year householder moved into unit - Moved in 1969 or earlier (%) - Hispanic or Latino
Year householder moved into unit - Moved in 1969 or earlier (%) - American Indian and Alaska Native
Year householder moved into unit - Moved in 1969 or earlier (%) - Multirace
Year householder moved into unit - Moved in 1969 or earlier (%) - Other Race
Housing units lacking complete plumbing facilities (%)
Housing units lacking complete kitchen facilities (%)
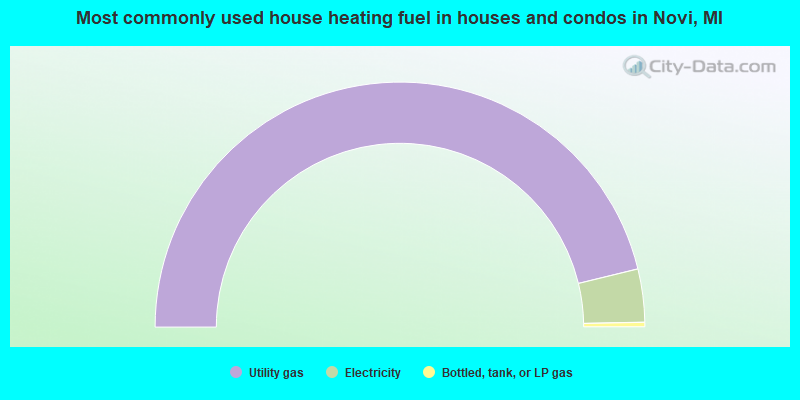
House heating fuel used in houses and condos - Utility gas (%)
House heating fuel used in houses and condos - Bottled, tank, or LP gas (%)
House heating fuel used in houses and condos - Electricity (%)
House heating fuel used in houses and condos - Fuel oil, kerosene, etc. (%)
House heating fuel used in houses and condos - Coal or coke (%)
House heating fuel used in houses and condos - Wood (%)
House heating fuel used in houses and condos - Solar energy (%)
House heating fuel used in houses and condos - Other fuel (%)
House heating fuel used in houses and condos - No fuel used (%)
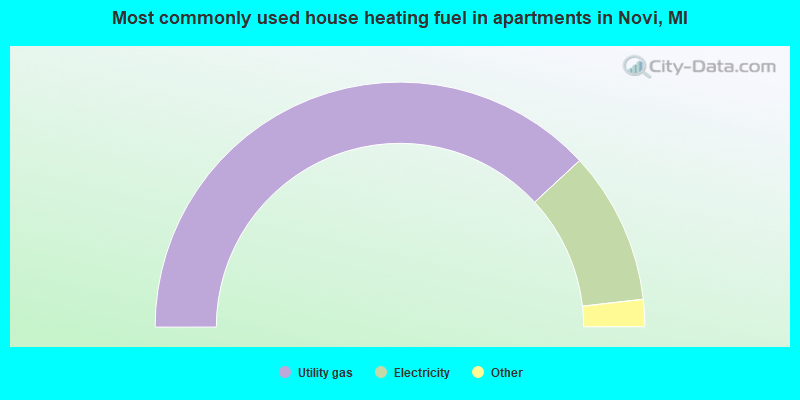
House heating fuel used in apartments - Utility gas (%)
House heating fuel used in apartments - Bottled, tank, or LP gas (%)
House heating fuel used in apartments - Electricity (%)
House heating fuel used in apartments - Fuel oil, kerosene, etc. (%)
House heating fuel used in apartments - Coal or coke (%)
House heating fuel used in apartments - Wood (%)
House heating fuel used in apartments - Solar energy (%)
House heating fuel used in apartments - Other fuel (%)
House heating fuel used in apartments - No fuel used (%)
Latest news about housing in Novi, MI collected exclusively by city-data.com from local newspapers, TV, and radio stations
Median year house/condo built: 1991Median year apartment built: 1999Household type by relationship:
Households: 66,375
Male householders: 15,790 (3,867 living alone ), Female householders: 11,239 (4,450 living alone )13,981 spouses (13,764 opposite-sex spouses ), 1,020 unmarried partners , (1,020 opposite-sex unmarried partners ), 20,045 children (19,751 natural , 0 adopted , 294 stepchildren ), 444 grandchildren , 323 brothers or sisters , 1,139 parents , 0 foster children , 613 other relatives , 1,254 non-relatives In group quarters: 527
Size of family households: 6,641 2-persons , 4,434 3-persons , 4,525 4-persons , 1,383 5-persons , 278 6-persons , 121 7-or-more-persons .
Size of nonfamily households: 8,207 1-person , 1,014 2-persons , 50 3-persons , 22 4-persons .
11,837 married couples with children. single-parent households (602 men , 2,026 women ).
69.3% of residents of Novi speak English at home. of residents speak Spanish at home (71% speak English very well , 15% speak English well , 13% speak English not well , 1% don't speak English at all ).of residents speak other Indo-European language at home (85% speak English very well , 11% speak English well , 3% speak English not well ).of residents speak Asian or Pacific Island language at home (54% speak English very well , 29% speak English well , 16% speak English not well , 1% don't speak English at all ).of residents speak other language at home (78% speak English very well , 9% speak English well , 13% speak English not well ).
Foreign born population: 18,919 (28.5%)of them are naturalized citizens )
Median number of rooms in houses and condos:
Median number of rooms in apartments
Owner-occupied Renter-occupied
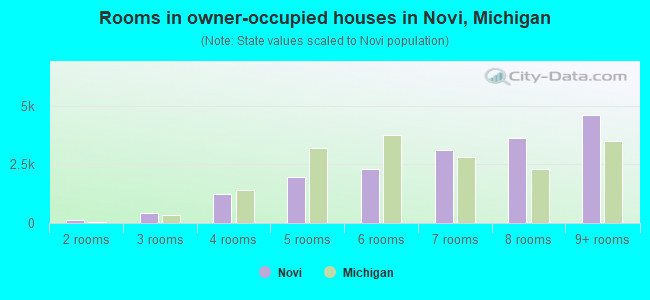
Rooms in owner-occupied houses in Novi, Michigan
0 1 room 145 2 rooms 414 3 rooms 1,236 4 rooms 1,945 5 rooms 2,286 6 rooms 3,106 7 rooms 3,629 8 rooms 4,611 9+ rooms
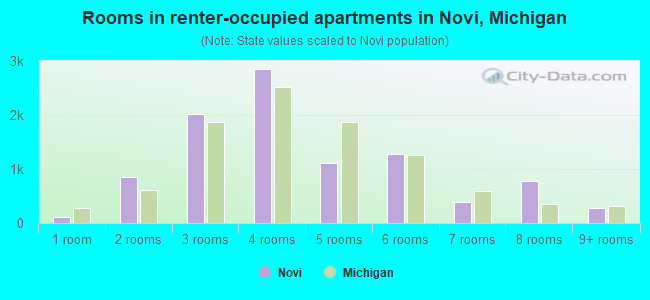
Rooms in renter-occupied apartments in Novi, Michigan
111 1 room 854 2 rooms 2,016 3 rooms 2,846 4 rooms 1,115 5 rooms 1,277 6 rooms 383 7 rooms 776 8 rooms 279 9+ rooms
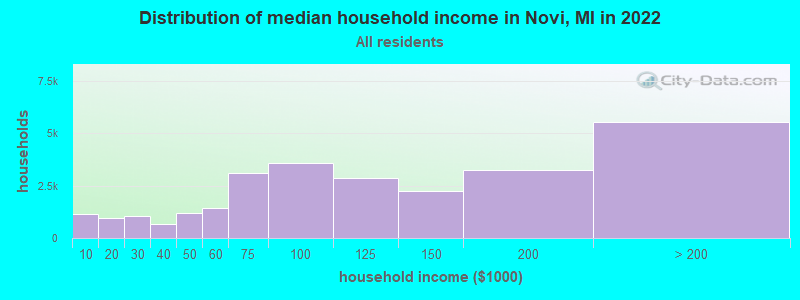
Novi, MI household income distribution 1,152 Less than $10,000952 $10,000 to $19,9991,055 $20,000 to $29,999664 $30,000 to $39,9991,203 $40,000 to $49,9991,425 $50,000 to $59,9993,104 $60,000 to $74,9993,583 $75,000 to $99,9992,852 $100,000 to $124,9992,256 $125,000 to $149,9993,242 $150,000 to $199,9995,541 $200,000 or more
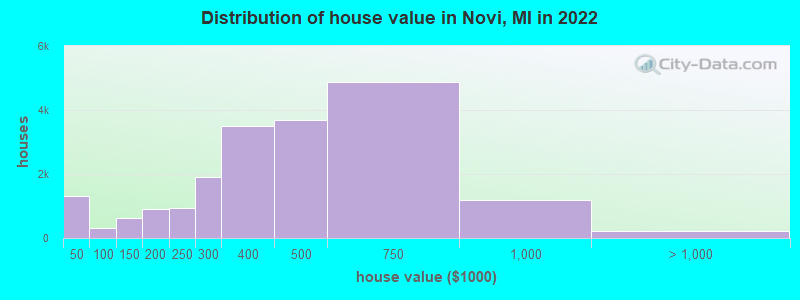
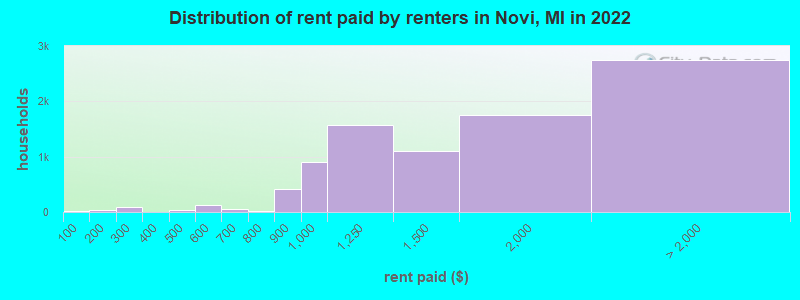
Home value of owner - occupied houses in 2022 in Novi, MI 499 Less than $10,000193 $10,000 to $14,99939 $15,000 to $19,99923 $20,000 to $24,99977 $25,000 to $29,999202 $30,000 to $34,999192 $35,000 to $39,99978 $40,000 to $49,99964 $50,000 to $59,999103 $60,000 to $69,99942 $70,000 to $79,99917 $80,000 to $89,9995 $90,000 to $99,999292 $100,000 to $124,999334 $125,000 to $149,999424 $150,000 to $174,999480 $175,000 to $199,999943 $200,000 to $249,9991,913 $250,000 to $299,9993,495 $300,000 to $399,9993,681 $400,000 to $499,9994,860 $500,000 to $749,9991,177 $750,000 to $999,999140 $1,000,000 to $1,499,99915 $1,500,000 to $1,999,99949 $2,000,000 or moreRent paid by renters in 2022 in Novi, MI 26 Less than $10038 $150 to $19986 $200 to $24935 $400 to $4499 $450 to $499118 $550 to $5996 $600 to $64939 $650 to $6997 $700 to $74918 $750 to $799412 $800 to $899910 $900 to $9991,568 $1,000 to $1,2491,097 $1,250 to $1,4991,748 $1,500 to $1,999945 $2,000 to $2,499795 $2,500 to $2,999443 $3,000 to $3,499353 $3,500 or more206 No cash rent
Percentage of workers working in this county: 77.0%Number of people working at home: 7,000 (20.4% of all workers )
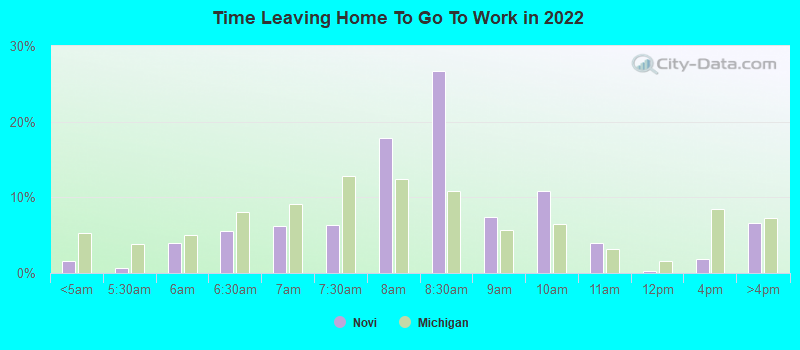
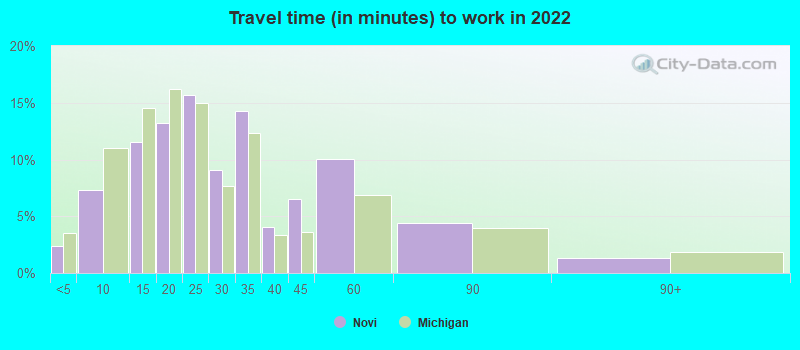
Travel time to work (commute)
Less than 5 minutes: 5075 to 9 minutes: 3,05610 to 14 minutes: 4,88415 to 19 minutes: 3,53320 to 24 minutes: 3,52025 to 29 minutes: 2,48030 to 34 minutes: 3,79135 to 39 minutes: 1,19340 to 44 minutes: 1,22745 to 59 minutes: 2,32060 to 89 minutes: 78890 or more minutes: 154
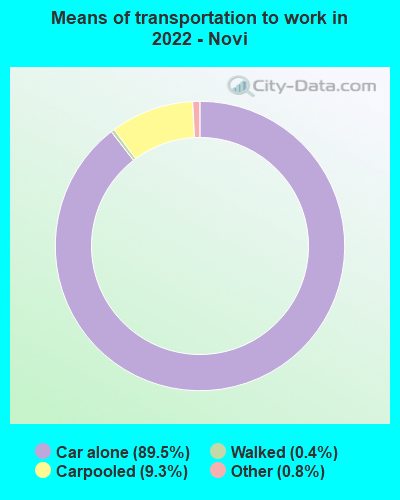
Means of transportation to work:
Drove a car alone: 35,108 (74.8%)Carpooled: 3,521 (7.5%)Taxi: 408 (0.9%)Bicycle: 33 (0.1%)Walked: 175 (0.4%)Worked at home: 7,000 (14.9%)
Unemployment by race in 2022
Unemployment rate for White non-Hispanic residents 0.9% Males1.2% FemalesUnemployment rate for Black residents 10.2% Males11.5% FemalesUnemployment rate for American Indian and Alaska Native residents 54.3% Males8.1% FemalesUnemployment rate for Asian residents 0.8% Males4.3% FemalesUnemployment rate for two or more race residents 11.1% Males
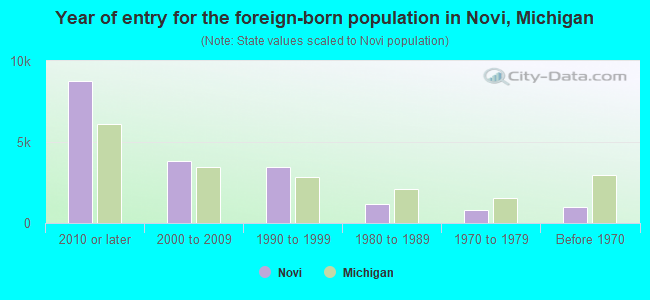
Year of entry for the foreign-born population in Novi, Michigan
8,753 2010 or later 3,833 2000 to 2009 3,455 1990 to 1999 1,185 1980 to 1989 794 1970 to 1979 1,016 Before 1970
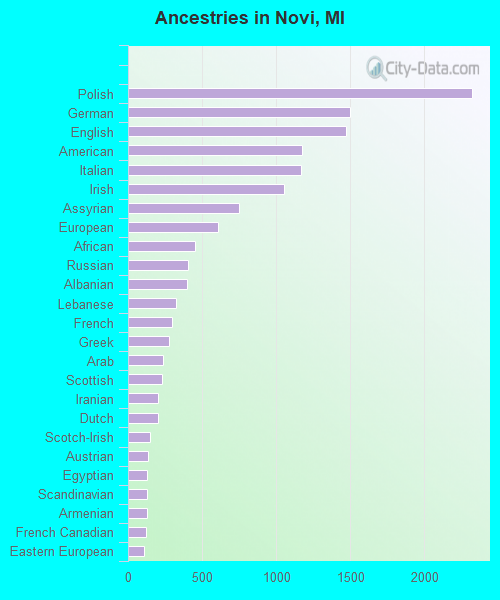
First ancestries reported:
Polish: 2,323 (6.5%)
German: 1,499 (4.2%)
English: 1,473 (4.1%)
American: 1,179 (3.3%)
Italian: 1,166 (3.3%)
Irish: 1,052 (3.0%)
Assyrian: 752 (2.1%)
European: 609 (1.7%)
African: 453 (1.3%)
Russian: 405 (1.1%)
Albanian: 396 (1.1%)
Lebanese: 323 (0.9%)
French: 299 (0.8%)
Greek: 275 (0.8%)
Arab: 237 (0.7%)
Scottish: 233 (0.7%)
Iranian: 203 (0.6%)
Dutch: 203 (0.6%)
Scotch-Irish: 146 (0.4%)
Austrian: 136 (0.4%)
Egyptian: 131 (0.4%)
Scandinavian: 127 (0.4%)
Armenian: 127 (0.4%)
French Canadian: 124 (0.3%)
Eastern European: 109 (0.3%)
Hungarian: 107 (0.3%)
Iraqi: 104 (0.3%)
Lithuanian: 99 (0.3%)
Canadian: 93 (0.3%)
Macedonian: 92 (0.3%)
Finnish: 81 (0.2%)
Bulgarian: 79 (0.2%)
Swedish: 78 (0.2%)
Slovak: 75 (0.2%)
Romanian: 74 (0.2%)
Ukrainian: 74 (0.2%)
Serbian: 73 (0.2%)
Norwegian: 61 (0.2%)
Ghanaian: 54 (0.2%)
Trinidadian and Tobagonian: 54 (0.2%)
Swiss: 50 (0.1%)
Nigerian: 44 (0.1%)
British: 41 (0.1%)
Czech: 32 (0.09%)
Brazilian: 29 (0.08%)
South African: 28 (0.08%)
Danish: 28 (0.08%)
Syrian: 27 (0.08%)
Czechoslovakian: 27 (0.08%)
Maltese: 26 (0.07%)
Belgian: 26 (0.07%)
Turkish: 20 (0.06%)
Jordanian: 17 (0.05%)
Slovene: 13 (0.04%)
Palestinian: 13 (0.04%)
Northern European: 10 (0.03%)
Yugoslavian: 8 (0.02%)
Israeli: 3 (0.01%)
Most common places of birth for foreign-born residents (%): India Novi:
32.3% (5,758)Michigan:
11.1% (77,240)
Japan Novi:
16.3% (2,902)Michigan:
1.5% (10,225)
China, excluding Hong Kong and Taiwan Novi:
8.8% (1,573)Michigan:
4.9% (34,295)
Korea Novi:
5.1% (904)Michigan:
3.0% (20,884)
Mexico Novi:
4.9% (867)Michigan:
10.9% (75,965)
Iraq Novi:
3.3% (598)Michigan:
8.1% (55,954)
Canada Novi:
3.3% (590)Michigan:
5.0% (35,052)
Philippines Novi:
3.3% (588)Michigan:
2.8% (19,112)
Pakistan Novi:
1.7% (302)Michigan:
1.5% (10,596)
Germany Novi:
1.7% (299)Michigan:
2.3% (16,126)
Place of birth for U.S.-born residents:
This state: 36,447Other state: 10,017Northeast: 2,385Midwest: 4,638South: 2,170West: 824 87.1% of Novi residents lived in the same house 1 years ago.
Out of people who lived in different houses, 33.5% lived in this county.
Out of people who lived in different counties, 74.4% lived in Michigan.
Novi:
87.1%State average:
88.4%
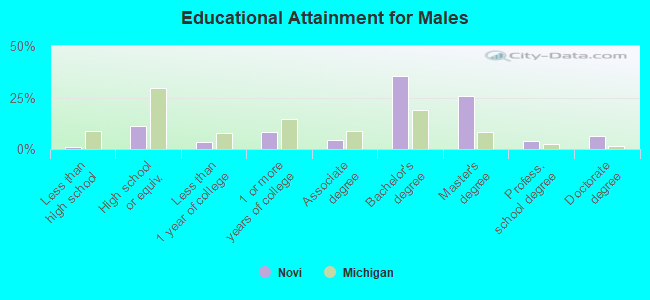
Education attainment for males 25 years and older:
No schooling: 76Nursery to 4th grade: 05th and 6th grade: 1147th and 8th grade: 09th grade: 010th grade: 011th grade: 3012th grade, no diploma: 0High school graduate (or equivalency): 2,541Less than 1 year of college: 763Some college more than 1 year, no degree: 1,850Associate degree: 945Bachelor's degree: 8,006Master's degree: 5,821Professional school degree: 913Doctorate degree: 1,445
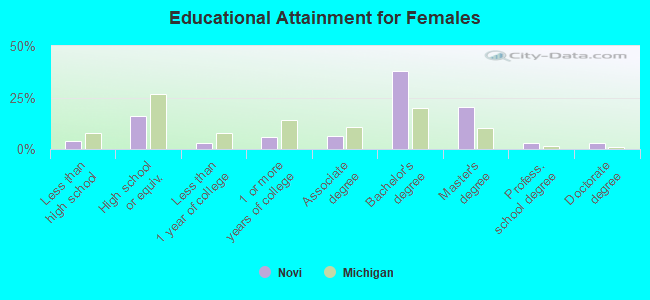
Education attainment for females 25 years and older:
No schooling: 248Nursery to 4th grade: 05th and 6th grade: 497th and 8th grade: 1219th grade: 3710th grade: 16011th grade: 4512th grade, no diploma: 258High school graduate (or equivalency): 3,840Less than 1 year of college: 701Some college more than 1 year, no degree: 1,413Associate degree: 1,515Bachelor's degree: 8,959Master's degree: 4,847Professional school degree: 740Doctorate degree: 689
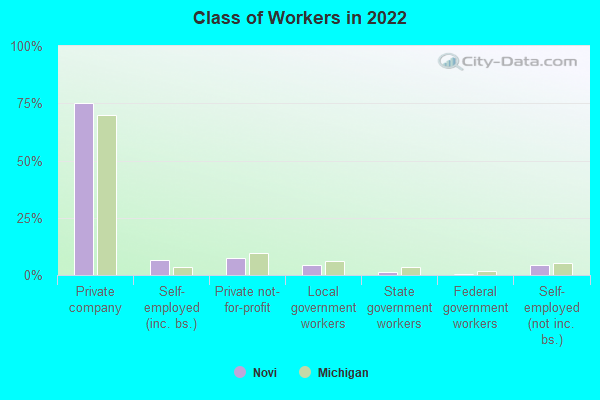
Housing units in structures:
One, detached: 14,763One, attached: 4,600Two: 3843 or 4: 7105 to 9: 2,66610 to 19: 1,16320 to 49: 1,22250 or more: 2,584Mobile homes: 1,519Median worth of mobile homes: $29,600
Housing units lacking complete plumbing facilities in 2022: 0.9%Housing units lacking complete kitchen facilities in 2022: 0.4%House/condo owner moved in on average 10 years ago
Renter moved in on average 2 years ago
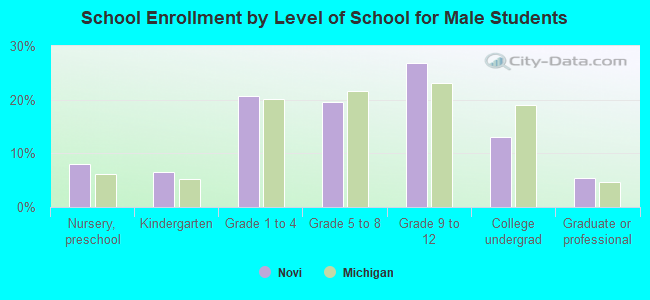
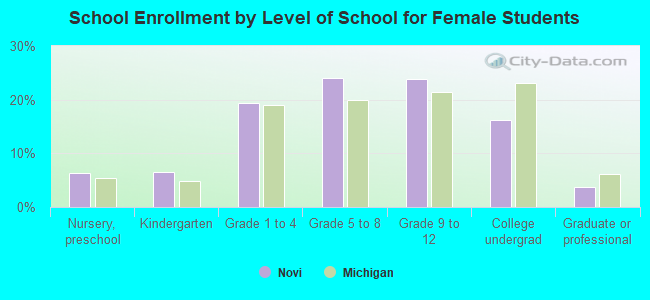
Private vs. public school enrollment:
Students in private schools in grades 1 to 8 (elementary and middle school): 174 Students in private schools in grades 9 to 12 (high school): 524 Students in private undergraduate colleges: 381