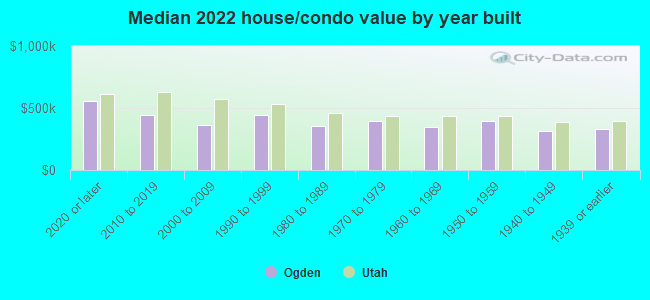
Ogden, UT (Utah) Houses and Residents
| Ogden: | $365,100 |
| Utah: | $499,500 |
Mean price in 2022:
Detached houses: $433,598
Here: $433,598 State: $607,750 Townhouses or other attached units: $352,784
Here: $352,784 State: $444,505 In 2-unit structures: $366,644
Here: $366,644 State: $433,540 In 3-to-4-unit structures: $214,410
Here: $214,410 State: $362,850 In 5-or-more-unit structures: $192,805
Here: $192,805 State: $412,810 Mobile homes: $55,891
Here: $55,891 State: $113,475
Total population: 84,316 (Urban population: 77,202, Rural population: 38 (all nonfarm))
Houses: 36,733 (34,269 occupied: 20,652 owner occupied, 13,617 renter occupied)
| % of renters here: | 40% |
| State: | 29% |
Housing density: 1,379 houses/condos per square mile
Median price asked for vacant for-sale houses and condos in 2022: $594,263.
Median contract rent in 2022: $918 (lower quartile is $605, upper quartile is $1,268)
Median rent asked for vacant for-rent units in 2022: $1,122
Median gross rent in Ogden, UT in 2022: $1,042
Housing units in Ogden with a mortgage: 15,328 (2,198 second mortgage, 0 home equity loan, 1,892 both second mortgage and home equity loan)
Houses without a mortgage: 142
Median household income for houses/condos with a mortgage: $87,983
Median household income for apartments without a mortgage: $54,684
Median monthly housing costs: $1,182
Compare current foreclosures in Ogden, UT:
| Photo | Address | Area | Beds / Baths | Price | Details |
|---|---|---|---|---|---|

|
#1
S 2900 W
Ogden, UT 84401
|
1,186 sq. feet
|
2 baths 3 beds |
show details | |

|
#2
Polk Ave
Ogden, UT 84403
|
1,860 sq. feet
|
1 baths 4 beds |
show details | |

|
#3
N 3450 W
Ogden, UT 84404
|
1,791 sq. feet
|
2 baths 3 beds |
show details | |

|
#4
E Canyon Dr
Ogden, UT 84405
|
1,595 sq. feet
|
2 baths 2 beds |
show details | |

|
#5
Lakeview Dr
Ogden, UT 84414
|
1,595 sq. feet
|
3 baths 6 beds |
show details | |

|
#6
Foothill Dr
Ogden, UT 84403
|
3,219 sq. feet
|
3 baths 4 beds |
show details | |

|
#7
W 4275 S
Ogden, UT 84401
|
2,154 sq. feet
|
3 baths 3 beds |
show details | |

|
#8
16th St
Ogden, UT 84404
|
- sq. feet
|
1 baths 2 beds |
show details | |

|
#9
Chatelain Rd
Ogden, UT 84403
|
- sq. feet
|
2 baths 5 beds |
show details | |

|
#10
W 3450 N
Ogden, UT 84404
|
- sq. feet
|
2 baths 3 beds |
show details |
| Photo | Address | Area | Beds / Baths | Price | Details |
|---|---|---|---|---|---|

|
#11
Orchard Ave
Ogden, UT 84403
|
- sq. feet
|
- baths - beds |
show details | |

|
#12
E 760 N
Ogden, UT 84404
|
- sq. feet
|
- baths - beds |
show details | |

|
#13
N Highway 89, Trlr 218
Ogden, UT 84404
|
- sq. feet
|
- baths - beds |
show details | |

|
#14
E 6600 S Unit 42
Ogden, UT 84405
|
- sq. feet
|
- baths - beds |
show details | |

|
#15
Cook St
Ogden, UT 84404
|
- sq. feet
|
- baths - beds |
show details | |

|
#16
Fowler Ave
Ogden, UT 84401
|
- sq. feet
|
- baths - beds |
show details | |

|
#17
W 4800 S
Ogden, UT 84405
|
- sq. feet
|
- baths - beds |
show details | |

|
#18
N 2000 W Unit 178
Ogden, UT 84404
|
- sq. feet
|
- baths - beds |
show details | |

|
#19
Park Blvd Apt 1073
Ogden, UT 84401
|
- sq. feet
|
- baths - beds |
show details | |

|
#20
Maxfield Dr
Ogden, UT 84404
|
- sq. feet
|
- baths - beds |
show details |
| Photo | Address | Area | Beds / Baths | Price | Details |
|---|---|---|---|---|---|

|
#21
Grant Ave
Ogden, UT 84401
|
- sq. feet
|
- baths - beds |
show details | |

|
#22
W 3550 S
Ogden, UT 84401
|
- sq. feet
|
- baths - beds |
show details | |

|
#23
Wasatch Dr Apt D201
Ogden, UT 84403
|
- sq. feet
|
- baths - beds |
show details | |

|
#24
Fox Chase Dr
Ogden, UT 84403
|
- sq. feet
|
- baths - beds |
show details | |

|
#25
Lake St
Ogden, UT 84401
|
- sq. feet
|
- baths - beds |
show details | |

|
#26
S 1150 W Trlr A
Ogden, UT 84405
|
- sq. feet
|
- baths - beds |
show details | |

|
#27
Midland Dr, Apt I303
Ogden, UT 84401
|
- sq. feet
|
- baths - beds |
show details | |

|
#28
S 100 E
Ogden, UT 84405
|
- sq. feet
|
- baths - beds |
show details | |

|
#29
Harrison Blvd Apt 2b
Ogden, UT 84403
|
- sq. feet
|
- baths - beds |
show details | |

|
#30
S 1100 W Apt H106
Ogden, UT 84401
|
- sq. feet
|
- baths - beds |
show details |
| Photo | Address | Area | Beds / Baths | Price | Details |
|---|---|---|---|---|---|

|
#31
Midland Dr Apt E203
Ogden, UT 84401
|
- sq. feet
|
- baths - beds |
show details | |

|
#32
N 200 E
Ogden, UT 84404
|
- sq. feet
|
- baths - beds |
show details | |

|
#33
S 300 E, Apt 7
Ogden, UT 84405
|
- sq. feet
|
- baths - beds |
show details | |

|
#34
S 1200 W Apt 42
Ogden, UT 84404
|
- sq. feet
|
- baths - beds |
show details | |

|
#35
W 2550 S
Ogden, UT 84401
|
- sq. feet
|
- baths - beds |
show details | |

|
#36
N 550 E
Ogden, UT 84414
|
- sq. feet
|
- baths - beds |
show details | |

|
#37
Madison Ave Apt K12
Ogden, UT 84401
|
- sq. feet
|
- baths - beds |
show details | |

|
#38
N Washington Blvd Apt K204
Ogden, UT 84404
|
- sq. feet
|
- baths - beds |
show details | |

|
#39
Midland Dr Apt I6
Ogden, UT 84401
|
- sq. feet
|
- baths - beds |
show details | |

|
#40
Stone Creek Rd # 18a
Ogden, UT 84401
|
- sq. feet
|
- baths - beds |
show details |
| Photo | Address | Area | Beds / Baths | Price | Details |
|---|---|---|---|---|---|

|
#41
Charleston Ave Apt A3
Ogden, UT 84414
|
- sq. feet
|
- baths - beds |
show details | |

|
#42
Washington Blvd
Ogden, UT 84404
|
- sq. feet
|
- baths - beds |
show details | |

|
#43
S 1100 W Apt F301
Ogden, UT 84401
|
- sq. feet
|
- baths - beds |
show details | |

|
#44
E 2250 S Ste 406
Ogden, UT 84401
|
- sq. feet
|
- baths - beds |
show details | |

|
#45
Canyon Rd Apt 1
Ogden, UT 84404
|
- sq. feet
|
- baths - beds |
show details | |

|
#46
Douglas St
Ogden, UT 84404
|
- sq. feet
|
- baths - beds |
show details | |

|
#47
W 4600 S Apt 4
Ogden, UT 84405
|
- sq. feet
|
- baths - beds |
show details | |

|
#48
N Highway 89, Trlr 435
Ogden, UT 84404
|
- sq. feet
|
- baths - beds |
show details | |

|
#49
Brinker Ave
Ogden, UT 84403
|
- sq. feet
|
- baths - beds |
show details | |

|
Check over 1 million property listings on Foreclosure.com!
|
browse all offers | |||

Latest news about housing in Ogden, UT collected exclusively by city-data.com from local newspapers, TV, and radio stations

 | Ogden vs American Fork (4 replies) |
| Moving to Ogden for work, having trouble finding a rental (22 replies) |
| Ogden, really that bad? / nice area with small homes? (40 replies) |
| Relocating to Ogden from Nashville Tn (24 replies) |
| Looking for a new place to call home! (15 replies) |
| Any lofts or loft style apartments in Ogden? (4 replies) |
Median year apartment built: 1976
Household type by relationship:
Households: 86,813- Male householders: 17,855 (6,595 living alone), Female householders: 16,414 (4,645 living alone)
14,127 spouses (14,087 opposite-sex spouses), 2,449 unmarried partners, (2,392 opposite-sex unmarried partners), 22,198 children (21,389 natural, 271 adopted, 538 stepchildren), 1,624 grandchildren, 1,097 brothers or sisters, 1,680 parents, 0 foster children, 2,933 other relatives, 3,575 non-relatives
- In group quarters: 2,861
Size of family households: 8,293 2-persons, 5,223 3-persons, 3,760 4-persons, 1,790 5-persons, 662 6-persons, 743 7-or-more-persons.
Size of nonfamily households: 11,240 1-person, 2,161 2-persons, 357 3-persons, 40 4-persons.
12,320 married couples with children.
3,384 single-parent households (670 men, 2,714 women).
77.4% of residents of Ogden speak English at home.
19.4% of residents speak Spanish at home (65% speak English very well, 17% speak English well, 15% speak English not well, 3% don't speak English at all).
1.3% of residents speak other Indo-European language at home (88% speak English very well, 5% speak English well, 5% speak English not well, 2% don't speak English at all).
1.5% of residents speak Asian or Pacific Island language at home (78% speak English very well, 15% speak English well, 7% speak English not well).
0.3% of residents speak other language at home (85% speak English very well, 10% speak English well, 3% speak English not well, 2% don't speak English at all).
Foreign born population: 9,042 (10.4%)
(31.8% of them are naturalized citizens)
| Here: | 6.5 |
| State: | 7.6 |
| Here: | 3.9 |
| State: | 4.3 |
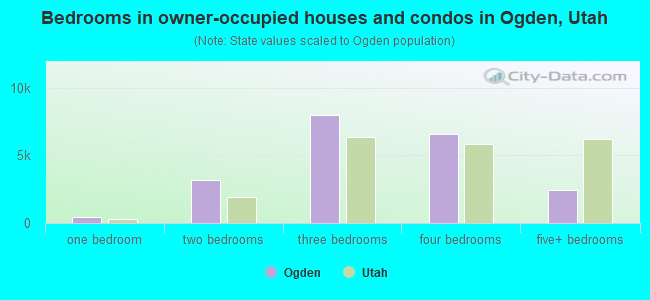
- Bedrooms in owner-occupied houses and condos in Ogden, Utah
- 25no bedroom
- 4791 bedroom
- 3,1822 bedrooms
- 7,9923 bedrooms
- 6,5514 bedrooms
- 2,4235+ bedrooms
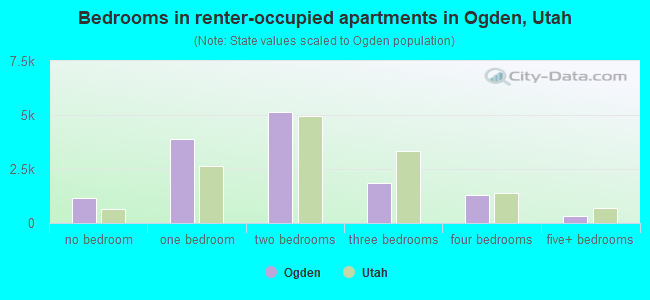
- Bedrooms in renter-occupied apartments in Ogden, Utah
- 1,139no bedroom
- 3,8821 bedroom
- 5,1342 bedrooms
- 1,8693 bedrooms
- 1,2764 bedrooms
- 3175+ bedrooms
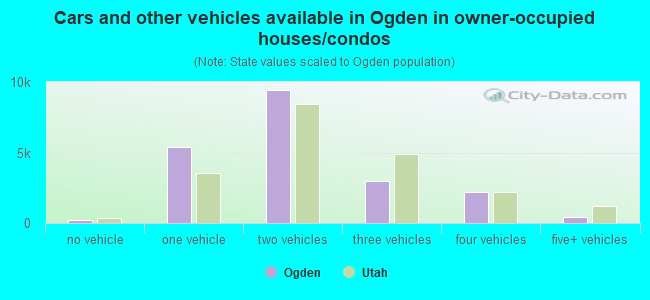
- Cars and other vehicles available in Ogden in owner-occupied houses/condos
- 200no vehicle
- 5,4161 vehicle
- 9,4082 vehicles
- 2,9903 vehicles
- 2,1844 vehicles
- 4545+ vehicles
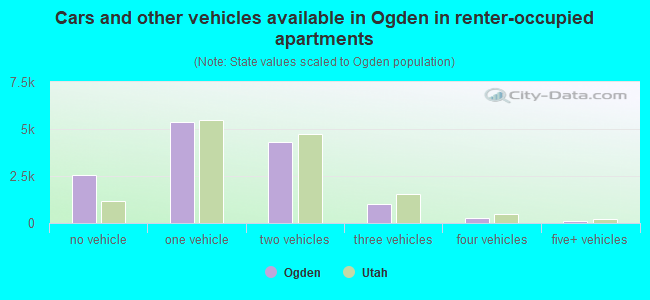
- Cars and other vehicles available in Ogden in renter-occupied apartments
- 2,547no vehicle
- 5,3821 vehicle
- 4,3312 vehicles
- 9963 vehicles
- 2524 vehicles
- 1095+ vehicles
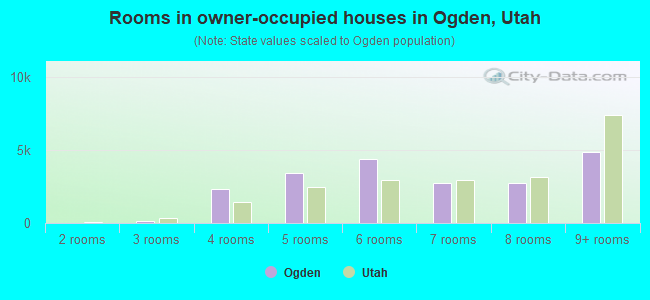
- Rooms in owner-occupied houses in Ogden, Utah
- 251 room
- 02 rooms
- 1613 rooms
- 2,3454 rooms
- 3,3945 rooms
- 4,4016 rooms
- 2,7277 rooms
- 2,7548 rooms
- 4,8459+ rooms
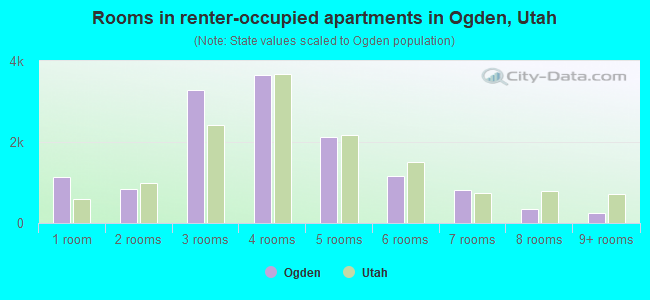
- Rooms in renter-occupied apartments in Ogden, Utah
- 1,1391 room
- 8282 rooms
- 3,2963 rooms
- 3,6594 rooms
- 2,1245 rooms
- 1,1616 rooms
- 8167 rooms
- 3448 rooms
- 2509+ rooms
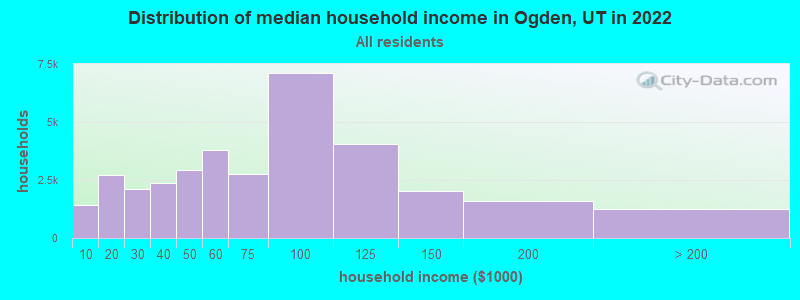
Ogden, UT household income distribution

- 1,442Less than $10,000
- 2,698$10,000 to $19,999
- 2,129$20,000 to $29,999
- 2,390$30,000 to $39,999
- 2,947$40,000 to $49,999
- 3,804$50,000 to $59,999
- 2,761$60,000 to $74,999
- 7,132$75,000 to $99,999
- 4,065$100,000 to $124,999
- 2,046$125,000 to $149,999
- 1,614$150,000 to $199,999
- 1,241$200,000 or more
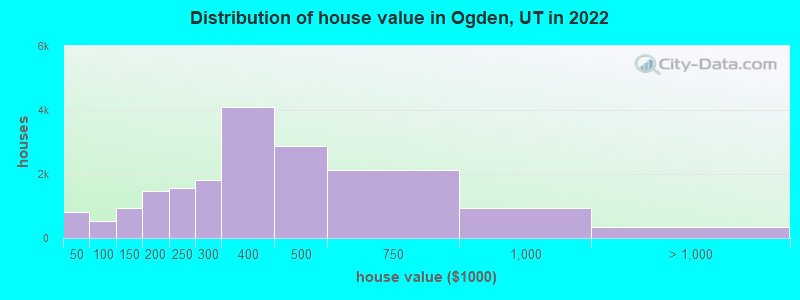
Home value of owner - occupied houses in 2022 in Ogden, UT
-
- 163Less than $10,000
- 92$10,000 to $14,999
- 110$15,000 to $19,999
- 45$20,000 to $24,999
- 74$25,000 to $29,999
- 172$30,000 to $34,999
- 9$35,000 to $39,999
- 158$40,000 to $49,999
- 94$60,000 to $69,999
- 55$70,000 to $79,999
- 132$80,000 to $89,999
- 81$90,000 to $99,999
- 399$100,000 to $124,999
- 539$125,000 to $149,999
- 716$150,000 to $174,999
- 755$175,000 to $199,999
- 1,571$200,000 to $249,999
- 1,802$250,000 to $299,999
- 4,085$300,000 to $399,999
- 2,870$400,000 to $499,999
- 2,130$500,000 to $749,999
- 937$750,000 to $999,999
- 211$1,000,000 to $1,499,999
- 19$1,500,000 to $1,999,999
- 113$2,000,000 or more
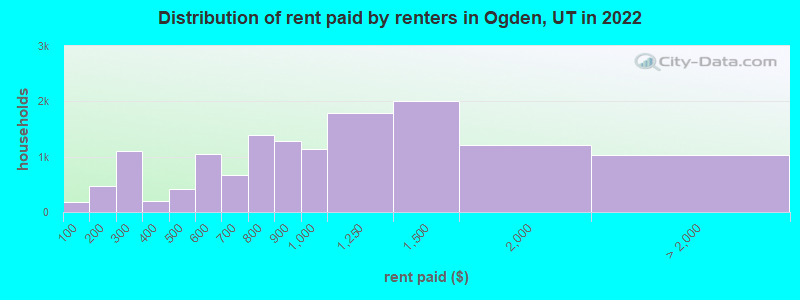
Rent paid by renters in 2022 in Ogden, UT
-
- 181Less than $100
- 168$100 to $149
- 295$150 to $199
- 1,012$200 to $249
- 91$250 to $299
- 117$300 to $349
- 85$350 to $399
- 319$400 to $449
- 90$450 to $499
- 694$500 to $549
- 353$550 to $599
- 497$600 to $649
- 165$650 to $699
- 612$700 to $749
- 774$750 to $799
- 1,291$800 to $899
- 1,137$900 to $999
- 1,788$1,000 to $1,249
- 2,014$1,250 to $1,499
- 1,218$1,500 to $1,999
- 389$2,000 to $2,499
- 179$2,500 to $2,999
- 29$3,000 to $3,499
- 434No cash rent
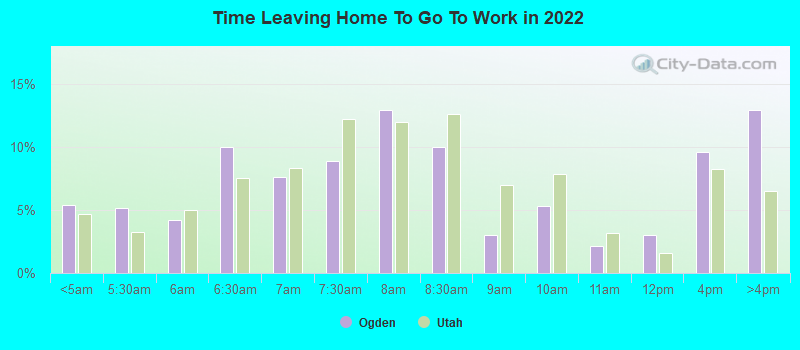
Percentage of workers working in this county: 79.3%
Number of people working at home: 6,164 (13.3% of all workers)
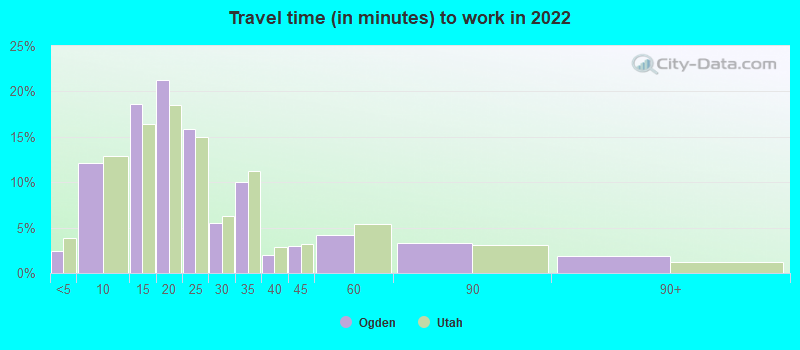
Travel time to work (commute)
- Less than 5 minutes: 1,096
- 5 to 9 minutes: 5,281
- 10 to 14 minutes: 7,589
- 15 to 19 minutes: 7,398
- 20 to 24 minutes: 6,248
- 25 to 29 minutes: 1,849
- 30 to 34 minutes: 2,786
- 35 to 39 minutes: 588
- 40 to 44 minutes: 1,043
- 45 to 59 minutes: 2,383
- 60 to 89 minutes: 1,132
- 90 or more minutes: 481
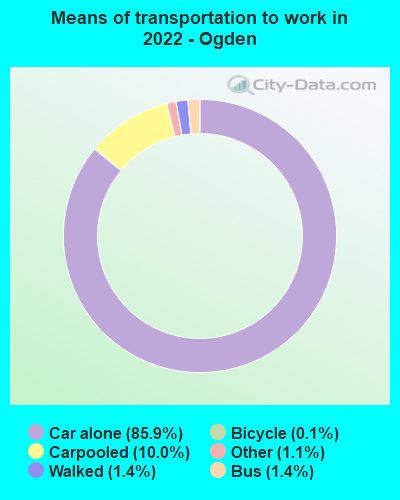
Means of transportation to work:
- Drove a car alone: 49,654 (76.0%)
- Carpooled: 5,771 (8.8%)
- Bus: 796 (1.2%)
- Subway or elevated rail: 45 (0.1%)
- Light rail, streetcar or trolley: 30 (0.0%)
- Taxi: 657 (1.0%)
- Bicycle: 68 (0.1%)
- Walked: 802 (1.2%)
- Worked at home: 7,514 (11.5%)
- Unemployment by race in 2022
- Unemployment rate for White non-Hispanic residents
- 4.7%Males
- 1.5%Females
- Unemployment rate for Black residents
- 1.1%Males
- 5.3%Females
- Unemployment rate for American Indian and Alaska Native residents
- 3.2%Males
- Unemployment rate for Asian residents
- 1.4%Males
- 0.4%Females
- Unemployment rate for other race residents
- 4.0%Males
- 2.5%Females
- Unemployment rate for two or more race residents
- 5.4%Males
- 1.3%Females
- Unemployment rate for Hispanic or Latino residents
- 2.4%Males
- 4.6%Females
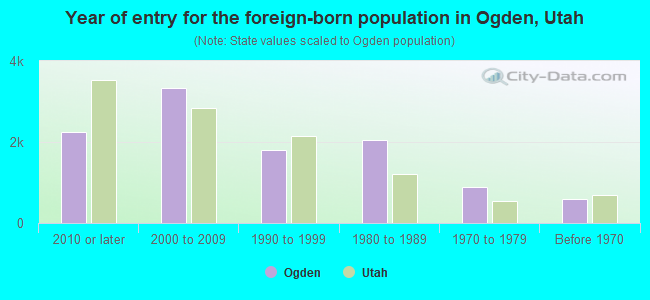
- Year of entry for the foreign-born population in Ogden, Utah
- 2,2572010 or later
- 3,3392000 to 2009
- 1,8131990 to 1999
- 2,0581980 to 1989
- 9001970 to 1979
- 591Before 1970
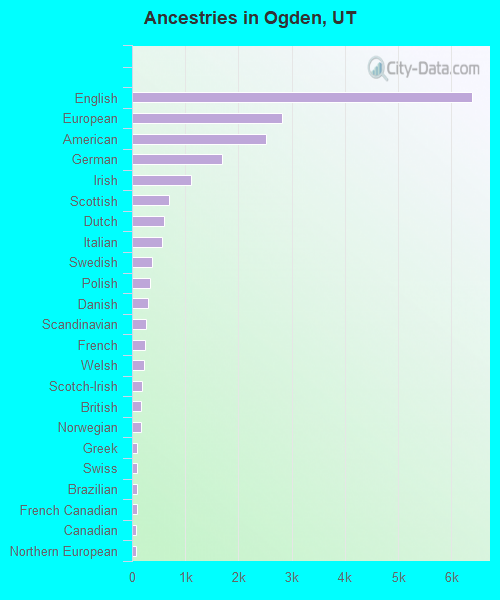
First ancestries reported:
- English: 6,385 (15.7%)
- European: 2,824 (6.9%)
- American: 2,509 (6.2%)
- German: 1,689 (4.2%)
- Irish: 1,107 (2.7%)
- Scottish: 689 (1.7%)
- Dutch: 592 (1.5%)
- Italian: 572 (1.4%)
- Swedish: 377 (0.9%)
- Polish: 341 (0.8%)
- Danish: 292 (0.7%)
- Scandinavian: 267 (0.7%)
- French: 242 (0.6%)
- Welsh: 221 (0.5%)
- Scotch-Irish: 180 (0.4%)
- British: 168 (0.4%)
- Norwegian: 161 (0.4%)
- Greek: 100 (0.2%)
- Swiss: 96 (0.2%)
- Brazilian: 94 (0.2%)
- French Canadian: 91 (0.2%)
- Canadian: 82 (0.2%)
- Northern European: 77 (0.2%)
- Moroccan: 58 (0.1%)
- African: 56 (0.1%)
- Portuguese: 55 (0.1%)
- Eastern European: 53 (0.1%)
- Trinidadian and Tobagonian: 46 (0.1%)
- Nigerian: 44 (0.1%)
- Macedonian: 40 (0.10%)
- Haitian: 37 (0.09%)
- Basque: 35 (0.09%)
- Somali: 35 (0.09%)
- Ukrainian: 32 (0.08%)
- Jamaican: 27 (0.07%)
- Romanian: 26 (0.06%)
- Sudanese: 24 (0.06%)
- Russian: 21 (0.05%)
- Iranian: 20 (0.05%)
- Hungarian: 19 (0.05%)
- Finnish: 19 (0.05%)
- Czechoslovakian: 15 (0.04%)
- Bulgarian: 14 (0.03%)
- Croatian: 13 (0.03%)
- Czech: 13 (0.03%)
- Lebanese: 13 (0.03%)
- Lithuanian: 9 (0.02%)
- Liberian: 7 (0.02%)
- Armenian: 7 (0.02%)
- Slovene: 6 (0.01%)
- Belgian: 5 (0.01%)
- Australian: 4 (0.01%)
Most common places of birth for foreign-born residents (%):
| Ogden: | 65.9% (6,439) |
| Utah: | 36.1% (99,740) |
| Ogden: | 3.6% (356) |
| Utah: | 2.6% (7,211) |
| Ogden: | 2.9% (279) |
| Utah: | 2.6% (7,062) |
| Ogden: | 2.5% (244) |
| Utah: | 0.2% (642) |
| Ogden: | 1.7% (169) |
| Utah: | 2.9% (8,017) |
| Ogden: | 1.5% (149) |
| Utah: | 2.9% (7,901) |
| Ogden: | 1.5% (148) |
| Utah: | 0.1% (279) |
| Ogden: | 1.5% (147) |
| Utah: | 3.0% (8,341) |
Place of birth for U.S.-born residents:
- This state: 48,792
- Other state: 27,116
- Northeast: 2,667
- Midwest: 4,362
- South: 3,507
- West: 16,580
89.0% of Ogden residents lived in the same house 1 years ago.
Out of people who lived in different houses, 27.8% lived in this county.
Out of people who lived in different counties, 65.5% lived in Utah.
| Ogden: | 89.0% |
| State average: | 85.7% |
Education attainment for males 25 years and older:
- No schooling: 965
- Nursery to 4th grade: 45
- 5th and 6th grade: 476
- 7th and 8th grade: 188
- 9th grade: 914
- 10th grade: 742
- 11th grade: 235
- 12th grade, no diploma: 356
- High school graduate (or equivalency): 9,817
- Less than 1 year of college: 2,244
- Some college more than 1 year, no degree: 3,240
- Associate degree: 2,139
- Bachelor's degree: 5,476
- Master's degree: 1,664
- Professional school degree: 644
- Doctorate degree: 347

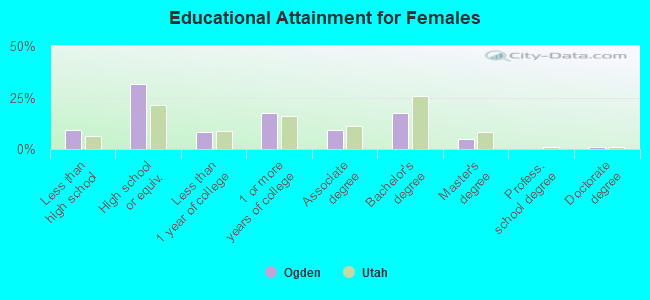
Education attainment for females 25 years and older:
- No schooling: 459
- Nursery to 4th grade: 281
- 5th and 6th grade: 520
- 7th and 8th grade: 200
- 9th grade: 285
- 10th grade: 53
- 11th grade: 353
- 12th grade, no diploma: 407
- High school graduate (or equivalency): 8,560
- Less than 1 year of college: 2,274
- Some college more than 1 year, no degree: 4,701
- Associate degree: 2,552
- Bachelor's degree: 4,726
- Master's degree: 1,305
- Professional school degree: 42
- Doctorate degree: 318
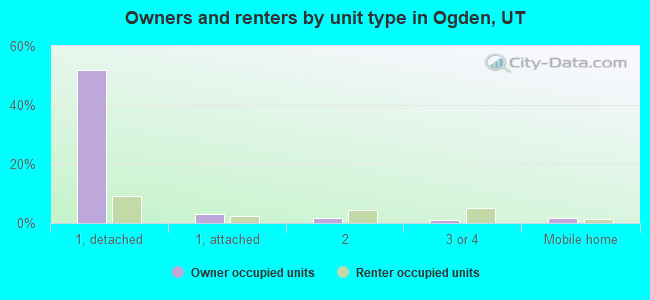
Housing units in structures:
- One, detached: 22,476
- One, attached: 1,861
- Two: 2,257
- 3 or 4: 2,070
- 5 to 9: 951
- 10 to 19: 1,556
- 20 to 49: 2,150
- 50 or more: 2,282
- Mobile homes: 1,130
Median worth of mobile homes: $40,042
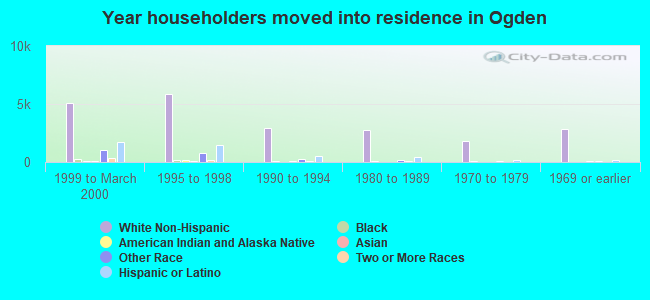
House/condo owner moved in on average 9 years ago
Renter moved in on average 2 years ago
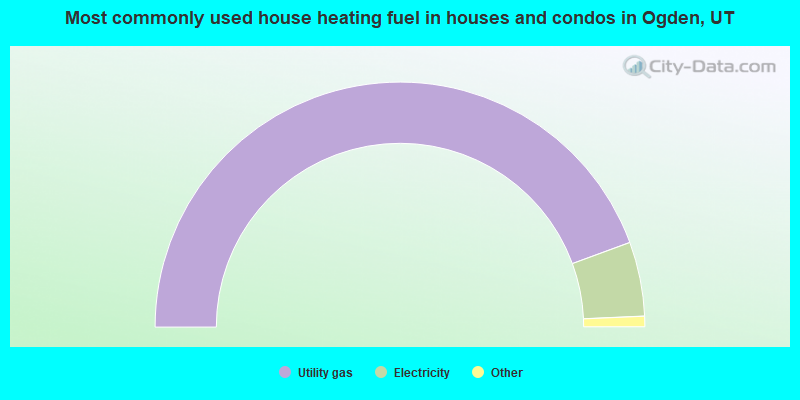
- 88.8%Utility gas
- 9.8%Electricity
- 1.0%Bottled, tank, or LP gas
- 0.2%Wood
- 0.2%Solar energy
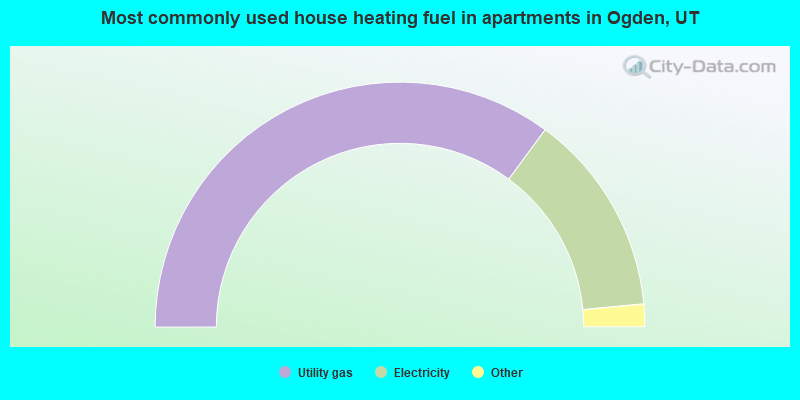
- 70.2%Utility gas
- 26.8%Electricity
- 1.4%Bottled, tank, or LP gas
- 0.8%No fuel used
- 0.6%Other fuel
- 0.1%Wood
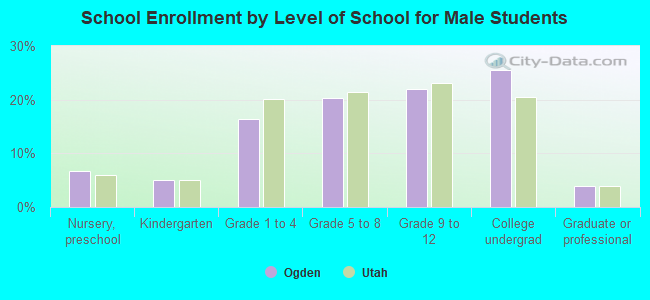
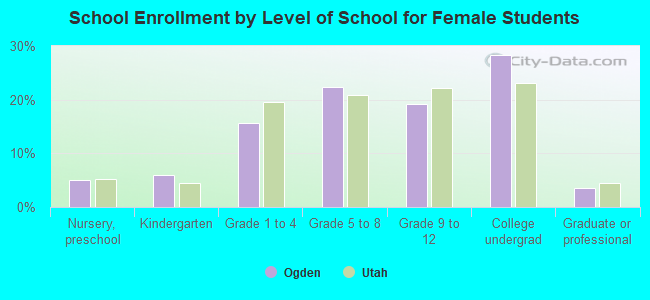
Private vs. public school enrollment:
| Here: | 10.5% |
| Utah: | 7.2% |
| Here: | 4.5% |
| Utah: | 5.3% |
| Here: | 12.6% |
| Utah: | 26.7% |