Olney, IL (Illinois) Houses and Residents
| Olney: | $97,125 |
| Illinois: | $251,600 |
Mean price in 2022:
Detached houses: $113,317
Here: $113,317 State: $310,164 Mobile homes: $67,076
Here: $67,076 State: $78,855
Total population: 9,026 (Urban population: 8,645 (all inside urban clusters), Rural population: 0)
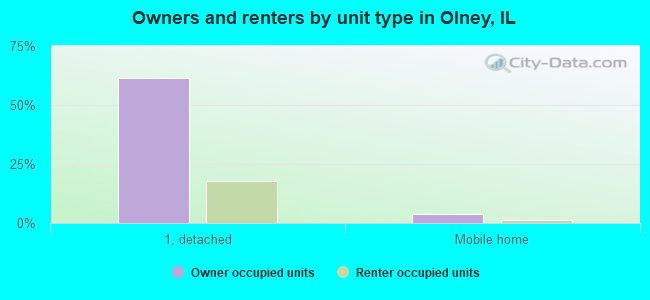
Houses: 4,203 (3,670 occupied: 2,426 owner occupied, 1,292 renter occupied)
| % of renters here: | 35% |
| State: | 33% |
Housing density: 730 houses/condos per square mile
Median price asked for vacant for-sale houses and condos in 2022: $57,751.
Median contract rent in 2022: $550 (lower quartile is $417, upper quartile is $623)
Median rent asked for vacant for-rent units in 2022: $2,364
Median gross rent in Olney, IL in 2022: $718
Housing units in Olney with a mortgage: 1,037 (24 second mortgage, 11 home equity loan, 8 both second mortgage and home equity loan)
Houses without a mortgage: 30
Median household income for houses/condos with a mortgage: $91,260
Median household income for apartments without a mortgage: $60,060
Median monthly housing costs: $626
Compare current foreclosures near Olney, IL:
| Photo | Address | Area | Beds / Baths | Price | Details |
|---|---|---|---|---|---|

|
#1
N Walnut St
Olney, IL 62450
|
1,372 sq. feet
|
2 baths 4 beds |
show details | |

|
#2
Lee Ave
Olney, IL 62450
|
995 sq. feet
|
1 baths 2 beds |
show details | |

|
#3
E Laurel St
Olney, IL 62450
|
1,561 sq. feet
|
1 baths 3 beds |
show details | |

|
#4
Mimosa Dr
Olney, IL 62450
|
1,988 sq. feet
|
2 baths 3 beds |
show details | |

|
#5
E Golf Ln
Olney, IL 62450
|
- sq. feet
|
- baths - beds |
show details | |

|
#6
Fritschle St
Olney, IL 62450
|
- sq. feet
|
- baths - beds |
show details | |

|
#7
N Walnut St
Olney, IL 62450
|
- sq. feet
|
- baths - beds |
show details | |

|
#8
Lee Ave
Olney, IL 62450
|
- sq. feet
|
- baths - beds |
show details | |

|
#9
Lee Ave
Olney, IL 62450
|
- sq. feet
|
- baths - beds |
show details | |

|
#10
E Butler St
Olney, IL 62450
|
- sq. feet
|
- baths - beds |
show details |
| Photo | Address | Area | Beds / Baths | Price | Details |
|---|---|---|---|---|---|

|
#11
Mimosa Dr
Olney, IL 62450
|
- sq. feet
|
- baths - beds |
show details | |

|
#12
N Fair St
Olney, IL 62450
|
- sq. feet
|
- baths - beds |
show details | |

|
#13
Lake Point Cir
Olney, IL 62450
|
- sq. feet
|
- baths - beds |
show details | |

|
#14
W North Ave
Olney, IL 62450
|
- sq. feet
|
- baths - beds |
show details | |

|
#15
S Morgan St
Olney, IL 62450
|
- sq. feet
|
- baths - beds |
show details | |

|
#16
Willow Dr
Olney, IL 62450
|
- sq. feet
|
- baths - beds |
show details | |

|
#17
E Butler St
Olney, IL 62450
|
- sq. feet
|
- baths - beds |
show details | |

|
#18
E South Ave
Olney, IL 62450
|
- sq. feet
|
- baths - beds |
show details | |

|
#19
S Baltimore St
Olney, IL 62450
|
- sq. feet
|
- baths - beds |
show details | |

|
#20
N Palmer St
Noble, IL 62868
|
2,016 sq. feet
|
2 baths 3 beds |
show details |
| Photo | Address | Area | Beds / Baths | Price | Details |
|---|---|---|---|---|---|

|
#21
E Mount Gilead Ln
Dundas, IL 62425
|
- sq. feet
|
1 baths 3 beds |
show details | |

|
#22
E 600th Ave
Newton, IL 62448
|
- sq. feet
|
- baths - beds |
show details | |

|
#23
Kings Hill Rd
Sumner, IL 62466
|
- sq. feet
|
- baths - beds |
show details | |

|
#24
E South St
West Salem, IL 62476
|
- sq. feet
|
- baths - beds |
show details | |

|
#25
N 2300 Ln
West Salem, IL 62476
|
- sq. feet
|
- baths - beds |
show details | |

|
#26
E Liberty Ln
Newton, IL 62448
|
- sq. feet
|
- baths - beds |
show details | |

|
#27
E South Ave
Sumner, IL 62466
|
- sq. feet
|
- baths - beds |
show details | |

|
#28
Fillmore Ln
Sumner, IL 62466
|
- sq. feet
|
- baths - beds |
show details | |

|
#29
S 1st St SE
Clay City, IL 62824
|
- sq. feet
|
- baths - beds |
show details | |

|
#30
Seminary St
West Salem, IL 62476
|
- sq. feet
|
- baths - beds |
show details |
| Photo | Address | Area | Beds / Baths | Price | Details |
|---|---|---|---|---|---|

|
#31
S May St
Sumner, IL 62466
|
- sq. feet
|
- baths - beds |
show details | |

|
#32
S Prairie St
West Salem, IL 62476
|
- sq. feet
|
- baths - beds |
show details | |

|
#33
New St
West Salem, IL 62476
|
- sq. feet
|
- baths - beds |
show details | |

|
#34
E Us Highway 50
Noble, IL 62868
|
- sq. feet
|
- baths - beds |
show details | |

|
Check over 1 million property listings on Foreclosure.com!
|
browse all offers | |||

Latest news about housing in Olney, IL collected exclusively by city-data.com from local newspapers, TV, and radio stations

 | Relocation from Franklin, TN to Chicago (possible burbs?), IL (1 reply) |
| Earthquake in S. IL (24 replies) |
| Help !! Fellow Illinois-ans (10 replies) |
| Relocating From Florida To The Newton, Il Area (12 replies) |

Median year apartment built: 1972
Household type by relationship:
Households: 8,871- Male householders: 1,737 (432 living alone), Female householders: 1,865 (747 living alone)
1,360 spouses (1,360 opposite-sex spouses), 348 unmarried partners, (344 opposite-sex unmarried partners), 2,325 children (2,271 natural, 4 adopted, 49 stepchildren), 227 grandchildren, 24 brothers or sisters, 102 parents, 0 foster children, 154 other relatives, 407 non-relatives
- In group quarters: 316
Size of family households: 962 2-persons, 488 3-persons, 464 4-persons, 203 5-persons, 9 6-persons, 71 7-or-more-persons.
Size of nonfamily households: 1,243 1-person, 227 2-persons, 41 3-persons, 11 5-persons.
1,039 married couples with children.
785 single-parent households (306 men, 479 women).
96.0% of residents of Olney speak English at home.
3.0% of residents speak Spanish at home (45% speak English very well, 25% speak English well, 30% speak English not well).
0.3% of residents speak other Indo-European language at home (79% speak English very well, 7% speak English well, 14% don't speak English at all).
0.3% of residents speak Asian or Pacific Island language at home (50% speak English very well, 50% speak English well).
Foreign born population: 230 (2.6%)
(42.2% of them are naturalized citizens)
| Here: | 6.4 |
| State: | 6.4 |
| Here: | 4.5 |
| State: | 4.1 |
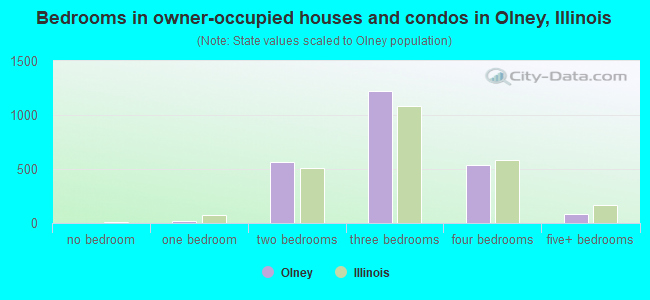
- Bedrooms in owner-occupied houses and condos in Olney, Illinois
- 0no bedroom
- 171 bedroom
- 5652 bedrooms
- 1,2223 bedrooms
- 5364 bedrooms
- 855+ bedrooms
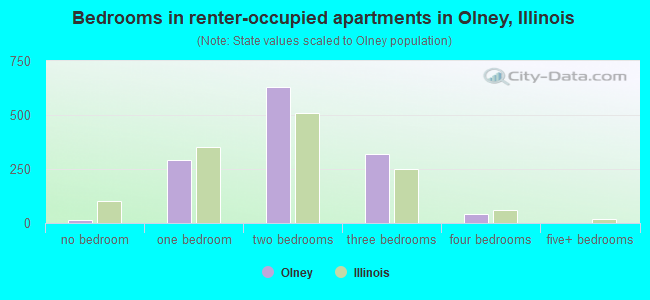
- Bedrooms in renter-occupied apartments in Olney, Illinois
- 12no bedroom
- 2921 bedroom
- 6292 bedrooms
- 3183 bedrooms
- 424 bedrooms
- 05+ bedrooms
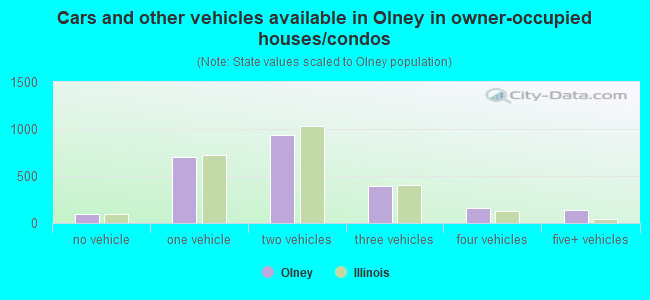
- Cars and other vehicles available in Olney in owner-occupied houses/condos
- 99no vehicle
- 6971 vehicle
- 9382 vehicles
- 3933 vehicles
- 1634 vehicles
- 1365+ vehicles
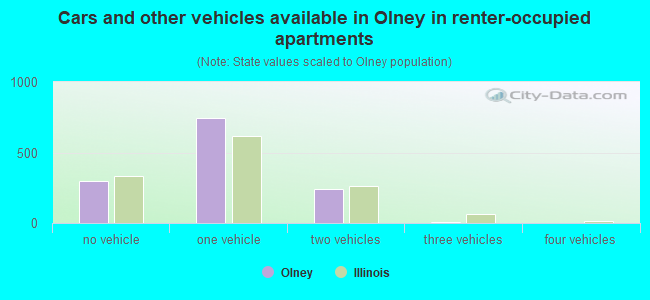
- Cars and other vehicles available in Olney in renter-occupied apartments
- 297no vehicle
- 7451 vehicle
- 2412 vehicles
- 93 vehicles
- 04 vehicles
- 05+ vehicles
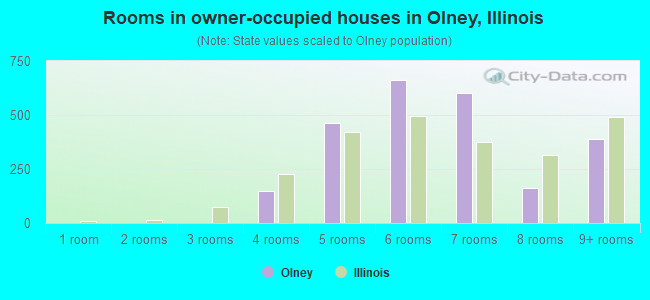
- Rooms in owner-occupied houses in Olney, Illinois
- 01 room
- 02 rooms
- 03 rooms
- 1494 rooms
- 4635 rooms
- 6606 rooms
- 6027 rooms
- 1628 rooms
- 3909+ rooms
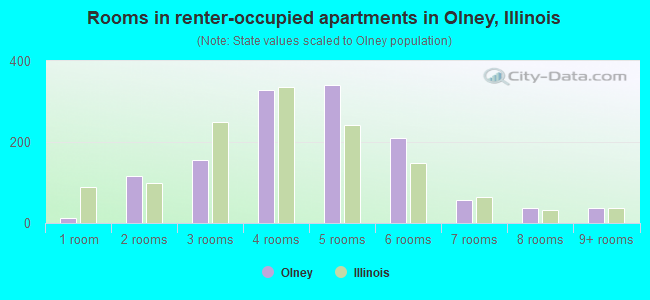
- Rooms in renter-occupied apartments in Olney, Illinois
- 121 room
- 1162 rooms
- 1563 rooms
- 3294 rooms
- 3405 rooms
- 2116 rooms
- 577 rooms
- 368 rooms
- 379+ rooms
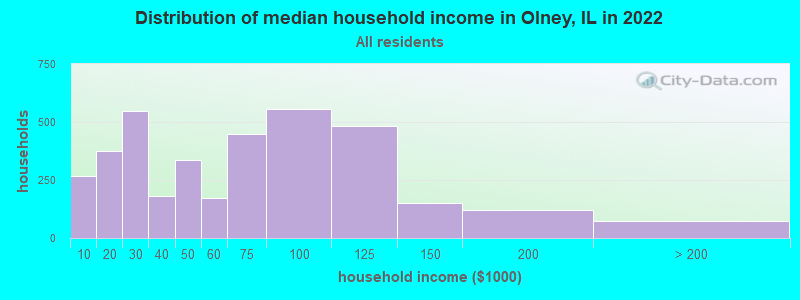
Olney, IL household income distribution

- 268Less than $10,000
- 376$10,000 to $19,999
- 546$20,000 to $29,999
- 181$30,000 to $39,999
- 338$40,000 to $49,999
- 174$50,000 to $59,999
- 448$60,000 to $74,999
- 554$75,000 to $99,999
- 483$100,000 to $124,999
- 151$125,000 to $149,999
- 119$150,000 to $199,999
- 73$200,000 or more
Home value of owner - occupied houses in 2022 in Olney, IL
-
- 61Less than $10,000
- 8$10,000 to $14,999
- 13$15,000 to $19,999
- 66$20,000 to $24,999
- 89$25,000 to $29,999
- 37$30,000 to $34,999
- 91$35,000 to $39,999
- 149$40,000 to $49,999
- 128$50,000 to $59,999
- 150$60,000 to $69,999
- 180$70,000 to $79,999
- 171$80,000 to $89,999
- 197$90,000 to $99,999
- 265$100,000 to $124,999
- 127$125,000 to $149,999
- 194$150,000 to $174,999
- 41$175,000 to $199,999
- 172$200,000 to $249,999
- 106$250,000 to $299,999
- 60$300,000 to $399,999
- 9$400,000 to $499,999
Rent paid by renters in 2022 in Olney, IL
-
- 6Less than $100
- 2$100 to $149
- 10$150 to $199
- 18$200 to $249
- 68$250 to $299
- 65$300 to $349
- 74$350 to $399
- 116$400 to $449
- 82$450 to $499
- 126$500 to $549
- 194$550 to $599
- 106$600 to $649
- 57$650 to $699
- 46$700 to $749
- 37$750 to $799
- 98$800 to $899
- 7$3,000 to $3,499
- 10$3,500 or more
- 118No cash rent
Percentage of workers working in this county: 72.6%
Number of people working at home: 333 (8.2% of all workers)
Travel time to work (commute)
- Less than 5 minutes: 428
- 5 to 9 minutes: 1,352
- 10 to 14 minutes: 576
- 15 to 19 minutes: 166
- 20 to 24 minutes: 67
- 25 to 29 minutes: 196
- 30 to 34 minutes: 345
- 35 to 39 minutes: 53
- 40 to 44 minutes: 81
- 45 to 59 minutes: 181
- 60 to 89 minutes: 164
- 90 or more minutes: 59
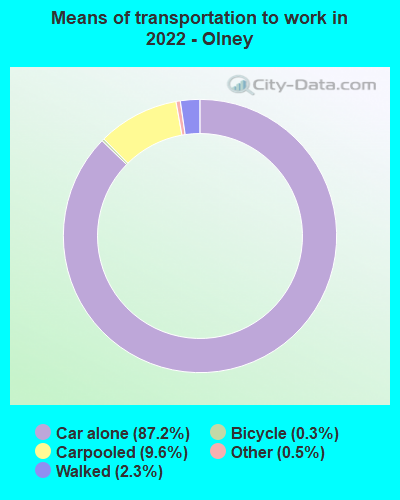
Means of transportation to work:
- Drove a car alone: 4,305 (80.0%)
- Carpooled: 505 (9.4%)
- Taxi: 28 (0.5%)
- Bicycle: 17 (0.3%)
- Walked: 116 (2.2%)
- Worked at home: 333 (6.2%)
- Unemployment by race in 2022
- Unemployment rate for White non-Hispanic residents
- 3.5%Males
- 3.7%Females
- Unemployment rate for other race residents
- 26.8%Males
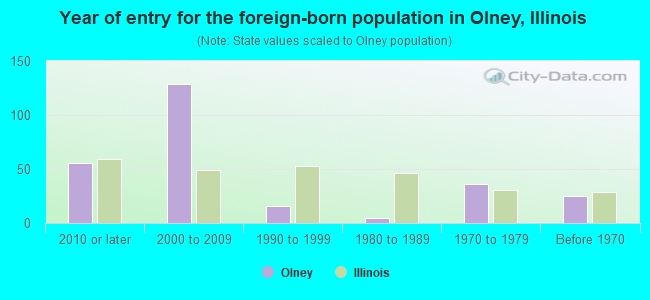
- Year of entry for the foreign-born population in Olney, Illinois
- 562010 or later
- 1292000 to 2009
- 161990 to 1999
- 51980 to 1989
- 361970 to 1979
- 25Before 1970
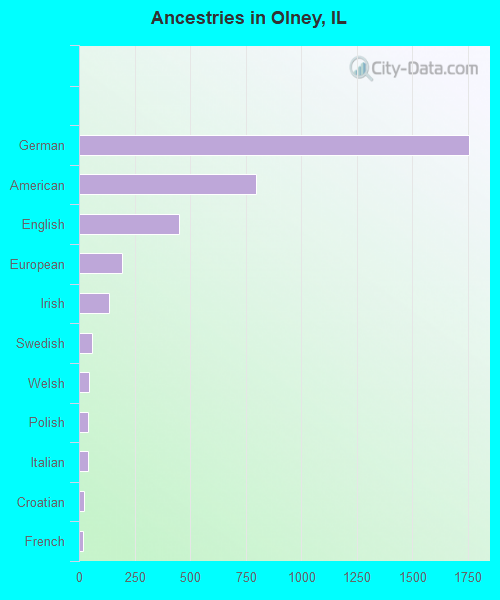
First ancestries reported:
- German: 1,757 (40.2%)
- American: 797 (18.3%)
- English: 450 (10.3%)
- European: 192 (4.4%)
- Irish: 133 (3.0%)
- Swedish: 58 (1.3%)
- Welsh: 43 (1.0%)
- Polish: 40 (0.9%)
- Italian: 39 (0.9%)
- Croatian: 23 (0.5%)
- French: 16 (0.4%)
- Swiss: 15 (0.3%)
- Romanian: 14 (0.3%)
- Scottish: 13 (0.3%)
- Hungarian: 10 (0.2%)
- South African: 10 (0.2%)
- Czech: 9 (0.2%)
- Norwegian: 9 (0.2%)
- Scandinavian: 8 (0.2%)
- Scotch-Irish: 8 (0.2%)
- Eastern European: 7 (0.2%)
- West Indian: 7 (0.2%)
- Northern European: 5 (0.1%)
- Ukrainian: 5 (0.1%)
Most common places of birth for foreign-born residents (%):
| Olney: | 57.8% (133) |
| Illinois: | 34.7% (626,958) |
| Olney: | 6.5% (15) |
| Illinois: | 0.3% (5,016) |
| Olney: | 6.1% (14) |
| Illinois: | 0.9% (15,679) |
| Olney: | 5.7% (13) |
| Illinois: | 5.2% (93,003) |
| Olney: | 5.2% (12) |
| Illinois: | 0.8% (14,736) |
| Olney: | 5.2% (12) |
| Illinois: | 0.2% (3,955) |
| Olney: | 4.3% (10) |
| Illinois: | 1.0% (18,753) |
| Olney: | 3.0% (7) |
| Illinois: | 0.4% (6,611) |
Place of birth for U.S.-born residents:
- This state: 6,601
- Other state: 1,983
- Northeast: 101
- Midwest: 1,322
- South: 365
- West: 199
81.3% of Olney residents lived in the same house 1 years ago.
Out of people who lived in different houses, 38.8% lived in this county.
Out of people who lived in different counties, 85.9% lived in Illinois.
| Olney: | 81.3% |
| State average: | 88.3% |
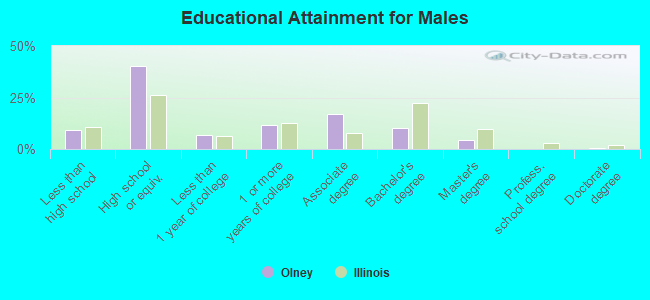
Education attainment for males 25 years and older:
- No schooling: 75
- Nursery to 4th grade: 0
- 5th and 6th grade: 7
- 7th and 8th grade: 9
- 9th grade: 15
- 10th grade: 74
- 11th grade: 15
- 12th grade, no diploma: 67
- High school graduate (or equivalency): 1,144
- Less than 1 year of college: 186
- Some college more than 1 year, no degree: 324
- Associate degree: 483
- Bachelor's degree: 287
- Master's degree: 130
- Professional school degree: 6
- Doctorate degree: 9
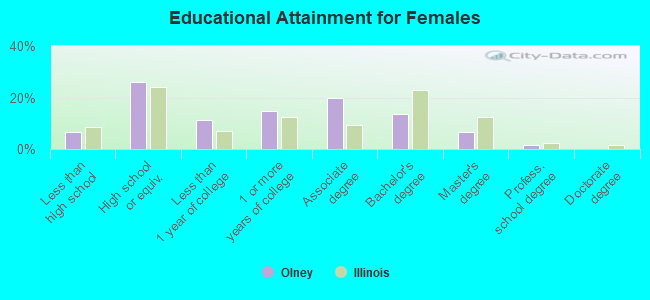
Education attainment for females 25 years and older:
- No schooling: 7
- Nursery to 4th grade: 0
- 5th and 6th grade: 17
- 7th and 8th grade: 38
- 9th grade: 32
- 10th grade: 43
- 11th grade: 36
- 12th grade, no diploma: 35
- High school graduate (or equivalency): 832
- Less than 1 year of college: 363
- Some college more than 1 year, no degree: 469
- Associate degree: 633
- Bachelor's degree: 428
- Master's degree: 214
- Professional school degree: 48
- Doctorate degree: 0

Housing units in structures:
- One, detached: 3,426
- One, attached: 36
- Two: 126
- 3 or 4: 105
- 5 to 9: 71
- 20 to 49: 164
- 50 or more: 58
- Mobile homes: 213
Median worth of mobile homes: $49,359
Housing units lacking complete kitchen facilities in 2022: 7.1%
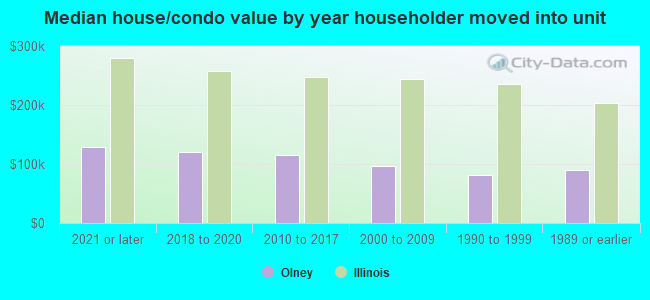
House/condo owner moved in on average 14 years ago
Renter moved in on average 2 years ago
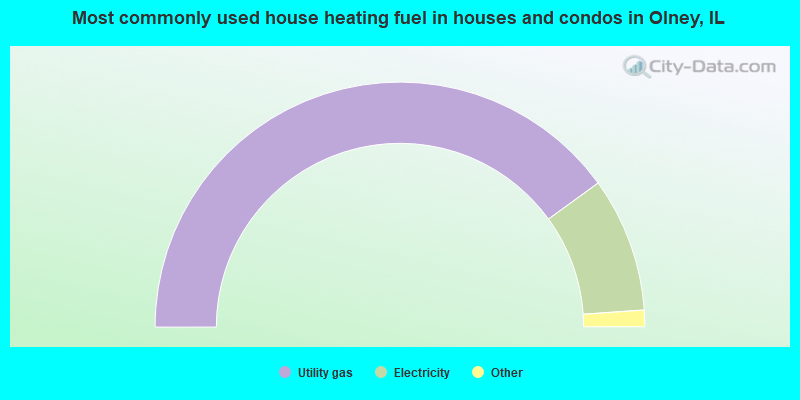
- 80.0%Utility gas
- 17.8%Electricity
- 1.2%Wood
- 0.6%Bottled, tank, or LP gas
- 0.4%Other fuel
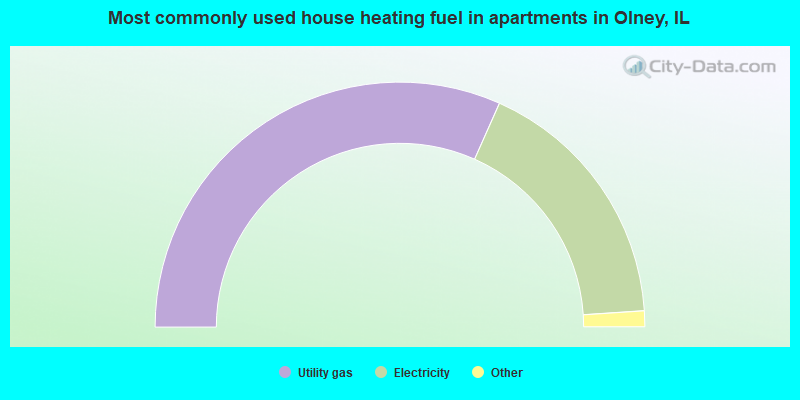
- 63.4%Utility gas
- 34.6%Electricity
- 1.0%Bottled, tank, or LP gas
- 0.9%Other fuel
Private vs. public school enrollment:
| Here: | 22.4% |
| Illinois: | 13.3% |
| Here: | 7.8% |
| Illinois: | 9.9% |
| Here: | 11.2% |
| Illinois: | 27.4% |