Onaqui, UT (Utah) Houses and Residents
| Onaqui: | $456,163 |
| Utah: | $499,500 |
Total population: 1,128 (Urban population: 0, Rural population: 881 (64 farm, 817 nonfarm))
Houses: 357 (288 occupied: 245 owner occupied, 43 renter occupied)
| % of renters here: | 15% |
| State: | 29% |
Housing density: 1 houses/condos per square mile
Median price asked for vacant for-sale houses and condos in 2022 in this county: $1,631,336.
Median contract rent in 2022: $815 (lower quartile is $549, upper quartile is $1,672)
Median rent asked for vacant for-rent units in 2022: $481
Median gross rent in Onaqui, UT in 2022: $911
Housing units in Onaqui with a mortgage: 92 (5 second mortgage, 13 home equity loan, 0 both second mortgage and home equity loan)
Houses without a mortgage: 41


Household type by relationship:
Households: 57,863- In family households: 53,397 (11,260 male householders, 3,059 female householders)
11,589 spouses, 22,998 children (20,770 natural, 736 adopted, 1,492 stepchildren), 1,422 grandchildren, 379 brothers or sisters, 371 parents, foster children, 609 other relatives, 1,205 non-relatives
- In nonfamily households: 4,466 (2,013 male householders (1,604 living alone)), 1,639 female householders (1,418 living alone)), 814 nonrelatives
- In group quarters: 355 (281 institutionalized population)
10,802 married couples with children.
2,056 single-parent households (565 men, 1,491 women).
94.5% of residents of Onaqui speak English at home.
4.3% of residents speak Spanish at home (97% speak English very well, 3% speak English well).
0.2% of residents speak other Indo-European language at home (100% speak English well).
0.7% of residents speak Asian or Pacific Island language at home (50% speak English very well, 50% speak English well).
0.2% of residents speak other language at home (100% speak English very well).
Foreign born population: 17 (1.0%)
(70.6% of them are naturalized citizens)
| Here: | 7.3 |
| State: | 7.6 |
| Here: | 4.4 |
| State: | 4.3 |

- Bedrooms in owner-occupied houses and condos in Onaqui, Utah
- 0no bedroom
- 01 bedroom
- 372 bedrooms
- 1383 bedrooms
- 524 bedrooms
- 185+ bedrooms

- Bedrooms in renter-occupied apartments in Onaqui, Utah
- 2no bedroom
- 01 bedroom
- 232 bedrooms
- 103 bedrooms
- 44 bedrooms
- 45+ bedrooms

- Cars and other vehicles available in Onaqui in owner-occupied houses/condos
- 8no vehicle
- 421 vehicle
- 892 vehicles
- 823 vehicles
- 134 vehicles
- 115+ vehicles

- Cars and other vehicles available in Onaqui in renter-occupied apartments
- 0no vehicle
- 111 vehicle
- 242 vehicles
- 43 vehicles
- 44 vehicles
- 05+ vehicles

- Rooms in owner-occupied houses in Onaqui, Utah
- 01 room
- 02 rooms
- 23 rooms
- 234 rooms
- 665 rooms
- 556 rooms
- 407 rooms
- 288 rooms
- 319+ rooms

- Rooms in renter-occupied apartments in Onaqui, Utah
- 21 room
- 02 rooms
- 23 rooms
- 194 rooms
- 85 rooms
- 06 rooms
- 67 rooms
- 28 rooms
- 49+ rooms


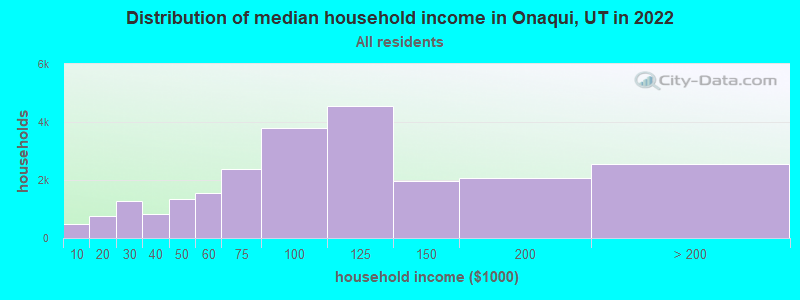
Onaqui, UT household income distribution

- 493Less than $10,000
- 769$10,000 to $19,999
- 1,277$20,000 to $29,999
- 823$30,000 to $39,999
- 1,344$40,000 to $49,999
- 1,549$50,000 to $59,999
- 2,392$60,000 to $74,999
- 3,798$75,000 to $99,999
- 4,555$100,000 to $124,999
- 1,973$125,000 to $149,999
- 2,066$150,000 to $199,999
- 2,558$200,000 or more
Percentage of workers working in this county: 81.3%
Number of people working at home: 79 (16.3% of all workers)
Travel time to work (commute)
- Less than 5 minutes: 7
- 5 to 9 minutes: 10
- 10 to 14 minutes: 9
- 15 to 19 minutes: 23
- 20 to 24 minutes: 44
- 25 to 29 minutes: 18
- 30 to 34 minutes: 37
- 35 to 39 minutes: 20
- 40 to 44 minutes: 25
- 45 to 59 minutes: 38
- 60 to 89 minutes: 64
- 90 or more minutes: 17
Means of transportation to work:
- Drove a car alone: 230 (68.9%)
- Carpooled: 71 (21.3%)
- Bus or trolley bus: 5 (1.5%)
- Walked: 6 (1.8%)
- Worked at home: 22 (6.6%)


- Year of entry for the foreign-born population in Onaqui, Utah
- 01995 to March 2000
- 01990 to 1994
- 01985 to 1989
- 01980 to 1984
- 41975 to 1979
- 11970 to 1974
- 01965 to 1969
- 2Before 1965
Most common places of birth for foreign-born residents (%):
| Onaqui: | 71.4% (5) |
| Utah: | 41.9% (66,478) |
| Onaqui: | 28.6% (2) |
| Utah: | 0.5% (839) |
Place of birth for U.S.-born residents:
- This state: 702
- Other state: 172
- Northeast: 2
- Midwest: 40
- South: 13
- West: 117
60% of Onaqui residents lived in the same house 5 years ago.
Out of people who lived in different houses, 44% lived in this county.
Out of people who lived in different counties, 71% lived in Utah.
Education attainment for males 25 years and older:
- No schooling: 2
- Nursery to 4th grade: 0
- 5th and 6th grade: 2
- 7th and 8th grade: 6
- 9th grade: 5
- 10th grade: 8
- 11th grade: 11
- 12th grade, no diploma: 11
- High school graduate (or equivalency): 93
- Less than 1 year of college: 20
- Some college more than 1 year, no degree: 40
- Associate degree: 17
- Bachelor's degree: 24
- Master's degree: 4
- Professional school degree: 7
- Doctorate degree: 2

Education attainment for females 25 years and older:
- No schooling: 0
- Nursery to 4th grade: 0
- 5th and 6th grade: 0
- 7th and 8th grade: 0
- 9th grade: 2
- 10th grade: 16
- 11th grade: 10
- 12th grade, no diploma: 12
- High school graduate (or equivalency): 110
- Less than 1 year of college: 34
- Some college more than 1 year, no degree: 38
- Associate degree: 20
- Bachelor's degree: 17
- Master's degree: 0
- Professional school degree: 0
- Doctorate degree: 0


Housing units in structures:
- One, detached: 282
- One, attached: 2
- Two: 2
- Mobile homes: 71
Median worth of mobile homes: $64,217
Housing units lacking complete kitchen facilities: 2.2%

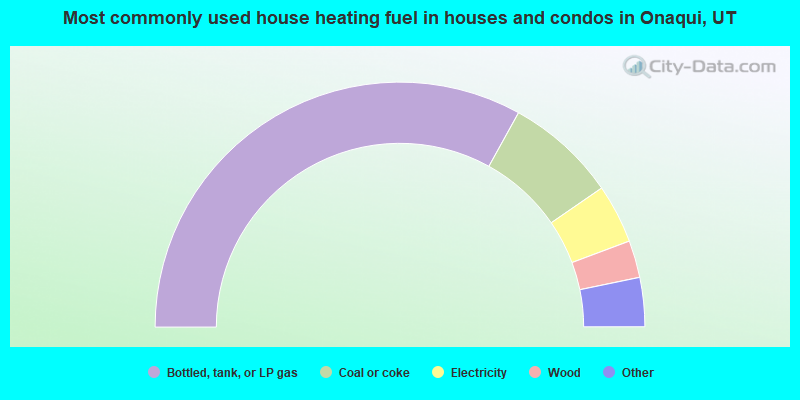
- 66.1%Bottled, tank, or LP gas
- 14.7%Coal or coke
- 7.8%Electricity
- 4.9%Wood
- 2.9%Other fuel
- 2.0%Fuel oil, kerosene, etc.
- 1.6%Utility gas
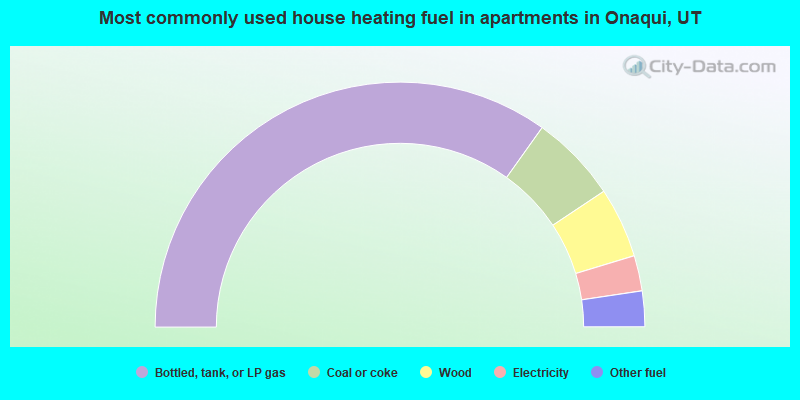
- 69.8%Bottled, tank, or LP gas
- 11.6%Coal or coke
- 9.3%Wood
- 4.7%Electricity
- 4.7%Other fuel
Private vs. public school enrollment:
| Here: | 0.0% |
| Utah: | 4.2% |
| Here: | 0.0% |
| Utah: | 3.9% |
| Here: | 54.5% |
| Utah: | 27.4% |


