Housing density: 1,621 houses/condos per square mile
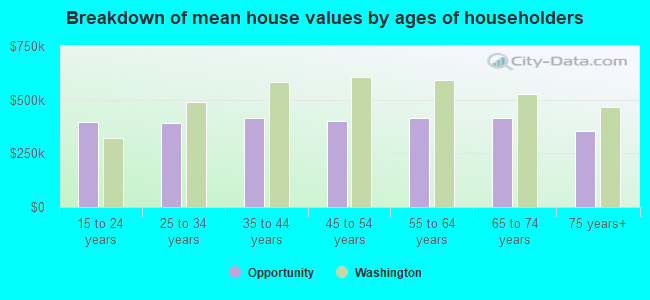
Median price asked for vacant for-sale houses and condos in 2022 in this county: $398,010.
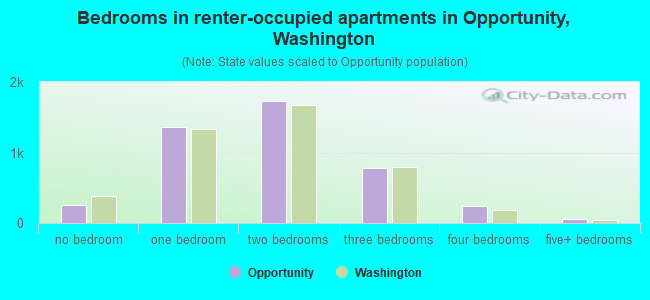
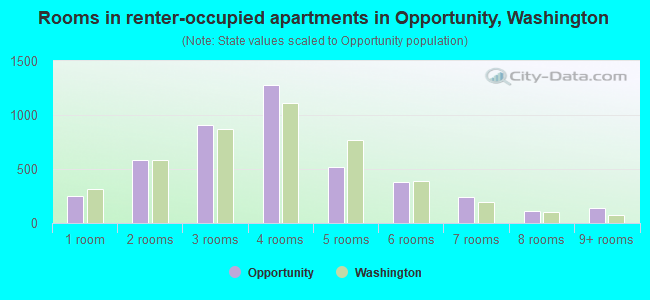
Median contract rent in 2022: $1,159 (lower quartile is $904, upper quartile is $1,551)
Median rent asked for vacant for-rent units in 2022: $1,173
Median gross rent in Opportunity, WA in 2022: $1,275
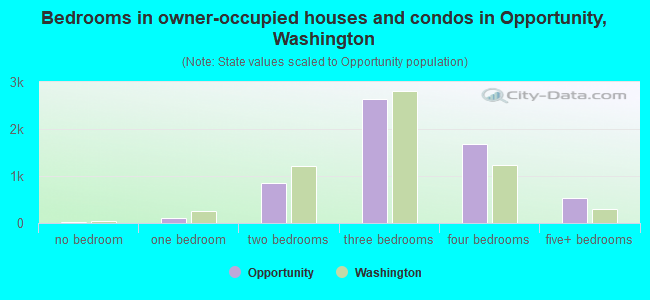
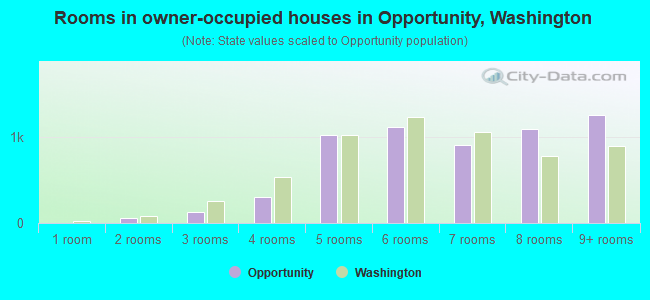
Housing units in Opportunity with a mortgage: 3,848 (658 second mortgage, 398 home equity loan, 29 both second mortgage and home equity loan) Houses without a mortgage: 1,482
Compare current foreclosures near Opportunity, WA:
In family households: 366,690 (83,287 male householders, 34,925 female householders)
88,280 spouses, 127,815 children (116,710 natural, 4,033 adopted, 7,072 stepchildren), 7,024 grandchildren, 3,522 brothers or sisters, 2,875 parents, foster children, 3,766 other relatives, 12,897 non-relatives
In nonfamily households: 89,839 (32,533 male householders (24,107 living alone)), 36,422 female householders (29,515 living alone)), 20,884 nonrelatives
In group quarters: 14,692 (5,666 institutionalized population)
72,314 married couples with children.
26,546 single-parent households (6,454 men, 20,092 women).
95.4% of residents of Opportunity speak English at home.
2.2% of residents speak Spanish at home (69% speak English very well, 13% speak English well, 18% speak English not well).
1.5% of residents speak other Indo-European language at home (64% speak English very well, 17% speak English well, 17% speak English not well, 2% don't speak English at all).
0.8% of residents speak Asian or Pacific Island language at home (49% speak English very well, 19% speak English well, 31% speak English not well).
0.2% of residents speak other language at home (79% speak English very well, 21% speak English well).
Foreign born population: 1,299 (3.9%)
(68.5% of them are naturalized citizens)
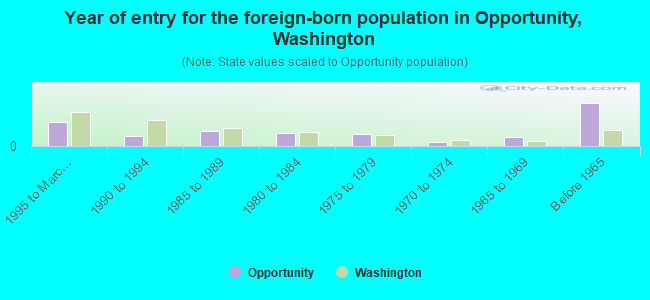
Year of entry for the foreign-born population in Opportunity, Washington
1641995 to March 2000
701990 to 1994
1011985 to 1989
871980 to 1984
831975 to 1979
251970 to 1974
611965 to 1969
287Before 1965
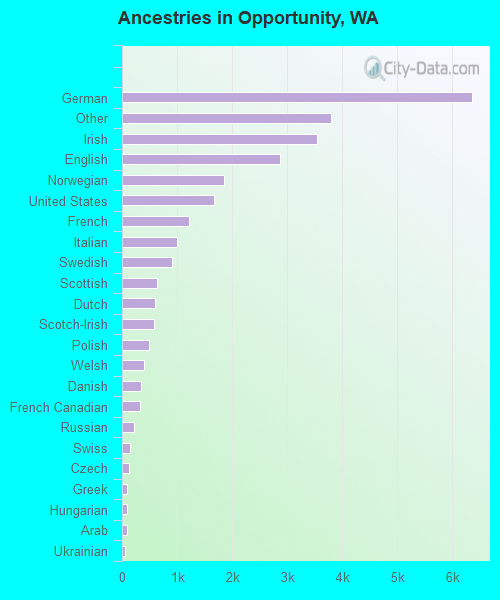
First ancestries reported:
German: 6,346 (23.1%)
Other: 3,791 (13.8%)
Irish: 3,549 (12.9%)
English: 2,877 (10.5%)
Norwegian: 1,857 (6.8%)
United States: 1,676 (6.1%)
French: 1,222 (4.4%)
Italian: 1,000 (3.6%)
Swedish: 899 (3.3%)
Scottish: 643 (2.3%)
Dutch: 600 (2.2%)
Scotch-Irish: 582 (2.1%)
Polish: 498 (1.8%)
Welsh: 395 (1.4%)
Danish: 344 (1.3%)
French Canadian: 320 (1.2%)
Russian: 214 (0.8%)
Swiss: 138 (0.5%)
Czech: 134 (0.5%)
Greek: 88 (0.3%)
Hungarian: 85 (0.3%)
Arab: 84 (0.3%)
Ukrainian: 62 (0.2%)
Subsaharan African: 48 (0.2%)
Lithuanian: 26 (0.09%)
Portuguese: 10 (0.04%)
West Indian: 8 (0.03%)
Most common places of birth for foreign-born residents (%):
Canada
Opportunity:
22.9% (201)
Washington:
7.7% (47,568)
Vietnam
Opportunity:
11.3% (99)
Washington:
6.7% (40,879)
Germany
Opportunity:
10.5% (92)
Washington:
3.4% (21,167)
Philippines
Opportunity:
7.1% (62)
Washington:
7.6% (46,733)
United Kingdom
Opportunity:
5.6% (49)
Washington:
3.3% (20,321)
Ukraine
Opportunity:
3.2% (28)
Washington:
3.0% (18,572)
Mexico
Opportunity:
3.0% (26)
Washington:
24.1% (148,115)
Netherlands
Opportunity:
2.8% (25)
Washington:
0.6% (3,795)
Yugoslavia
Opportunity:
2.8% (25)
Washington:
0.2% (1,110)
Japan
Opportunity:
2.8% (25)
Washington:
2.8% (16,936)
Poland
Opportunity:
2.6% (23)
Washington:
0.7% (4,092)
El Salvador
Opportunity:
2.2% (19)
Washington:
0.7% (4,492)
Other Northern Europe
Opportunity:
2.1% (18)
Washington:
1.0% (6,393)
France
Opportunity:
2.1% (18)
Washington:
0.5% (3,086)
India
Opportunity:
2.1% (18)
Washington:
2.4% (14,714)
China, excluding Hong Kong and Taiwan
Opportunity:
1.9% (17)
Washington:
3.3% (20,530)
Jordan
Opportunity:
1.9% (17)
Washington:
0.1% (380)
Korea
Opportunity:
1.8% (16)
Washington:
6.2% (38,172)
Cuba
Opportunity:
1.8% (16)
Washington:
0.2% (1,259)
Dominican Republic
Opportunity:
1.8% (16)
Washington:
0.1% (448)
Place of birth for U.S.-born residents:
This state: 13,259
Other state: 10,672
Northeast: 664
Midwest: 2,595
South: 1,252
West: 6,161
50% of Opportunity residents lived in the same house 5 years ago. Out of people who lived in different houses, 66% lived in this county. Out of people who lived in different counties, 41% lived in Washington.
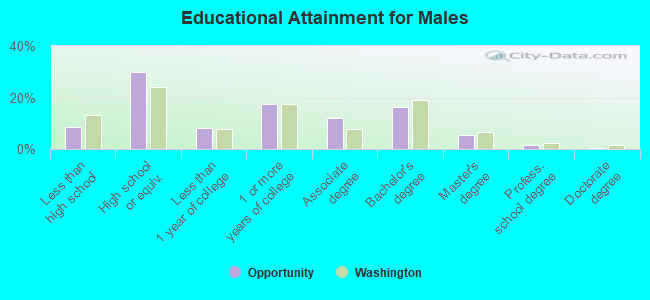
Education attainment for males 25 years and older:
No schooling: 4
Nursery to 4th grade: 5
5th and 6th grade: 31
7th and 8th grade: 87
9th grade: 35
10th grade: 173
11th grade: 109
12th grade, no diploma: 195
High school graduate (or equivalency): 2,218
Less than 1 year of college: 617
Some college more than 1 year, no degree: 1,289
Associate degree: 903
Bachelor's degree: 1,219
Master's degree: 396
Professional school degree: 118
Doctorate degree: 21
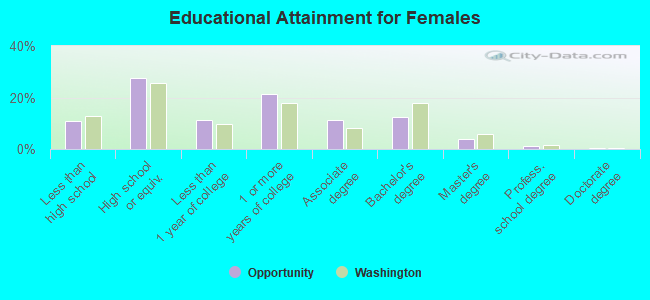
Education attainment for females 25 years and older:
No schooling: 32
Nursery to 4th grade: 6
5th and 6th grade: 49
7th and 8th grade: 173
9th grade: 123
10th grade: 170
11th grade: 178
12th grade, no diploma: 200
High school graduate (or equivalency): 2,411
Less than 1 year of college: 995
Some college more than 1 year, no degree: 1,869
Associate degree: 982
Bachelor's degree: 1,075
Master's degree: 322
Professional school degree: 94
Doctorate degree: 24
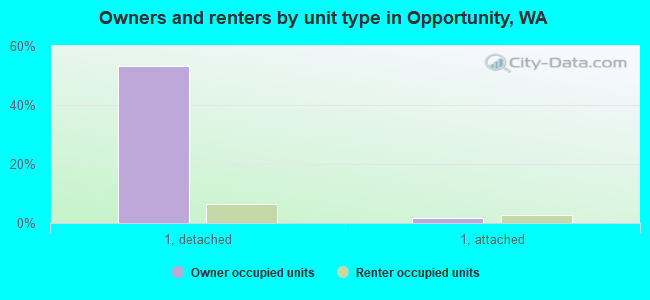
Housing units in structures:
One, detached: 6,320
One, attached: 468
Two: 501
3 or 4: 412
5 to 9: 467
10 to 19: 868
20 to 49: 658
50 or more: 1,114
Mobile homes: 38
Median worth of mobile homes: $237,229
Housing units lacking complete plumbing facilities: 0.6%
Housing units lacking complete kitchen facilities: 1.8%