Paradise, NV (Nevada) Houses and Residents
Estimated median house or condo value in 2022: $380,500 (it was $134,200 in 2000 )
Paradise:
$380,500Nevada:
$434,700
Lower value quartile - upper value quartile: $287,300 - $486,000Mean price in 2022: Detached houses: $457,458 Here:
$457,458State:
$549,327
Townhouses or other attached units: $291,895 Here:
$291,895State:
$328,893
In 2-unit structures: $144,582 Here:
$144,582State:
$326,466
In 3-to-4-unit structures: $191,893 Here:
$191,893State:
$295,216
In 5-or-more-unit structures: $540,860 Here:
$540,860State:
$297,847
Mobile homes: $64,273 Here:
$64,273State:
$159,995
Total population: 223,167 (Urban population: 185,728, Rural population: 104 (all nonfarm) )
Houses: 93,764 (74,554 occupied: 28,559 owner occupied, 45,995 renter occupied )
% of renters here:
62%State:
40%
Housing density: 1,989 houses/condos per square mile
Median price asked for vacant for-sale houses and condos in 2022: $253,680.
Median contract rent in 2022: $1,177 (lower quartile is $921, upper quartile is $1,485)
Median rent asked for vacant for-rent units in 2022: $2,746
Median gross rent in Paradise, NV in 2022: $1,302
Housing units in Paradise with a mortgage: 19,574 (1,003 second mortgage, 0 home equity loan, 510 both second mortgage and home equity loan )Houses without a mortgage: 442
Median household income for houses/condos with a mortgage: $101,111
Median household income for apartments without a mortgage: $61,799
Median monthly housing costs: $1,289
Data:
Median house or condo value ($)
Median house or condo value ($ change since 2000)
Median house or condo value ($) - White
Median house or condo value ($) - Black or African American
Median house or condo value ($) - Asian
Median house or condo value ($) - Hispanic or Latino
Median house or condo value ($) - American Indian and Alaska Native
Median house or condo value ($) - Multirace
Median house or condo value ($) - Other Race
Median price asked for mobile homes ($)
Household density (households per square mile)
Mean house or condo value by units in structure - 1, detached ($)
Mean house or condo value by units in structure - 1, attached ($)
Mean house or condo value by units in structure - 2 ($)
Mean house or condo value by units in structure by units in structure - 3 or 4 ($)
Mean house or condo value by units in structure - 5 or more ($)
Mean house or condo value by units in structure - Boat, RV, van, etc. ($)
Mean house or condo value by units in structure - Mobile home ($)
Median contract rent ($)
Median contract rent - Lower quartile ($)
Median contract rent - Upper quartile ($)
Median gross rent ($)
Urban houses (%)
Rural houses (%)
Houses occupied (%)
Houses occupied (% change since 2000)
Houses owner occupied (%)
Houses owner occupied (% change since 2000)
Houses renter occupied (%)
Houses renter occupied (% change since 2000)
Vacant housing units - For rent (%)
Vacant housing units - For rent (% change since 2000)
Vacant housing units - For sale only (%)
Vacant housing units - For sale only (% change since 2000)
Vacant housing units - Rented or sold, not occupied (%)
Vacant housing units - Rented or sold, not occupied (% change since 2000)
Vacant housing units - For seasonal, recreational, or occasional use (%)
Vacant housing units - For seasonal, recreational, or occasional use (% change since 2000)
Vacant housing units - For migrant workers (%)
Vacant housing units - For migrant workers (% change since 2000)
Vacant housing units - Other vacant (%)
Vacant housing units - Other vacant (% change since 2000)
Median monthly housing costs ($)
Median household income for houses/condos with a mortgage ($)
Median household income for houses/condos without a mortgage ($)
Median household income ($)
Median household income ($) - White
Median household income ($) - Black or African American
Median household income ($) - Asian
Median household income ($) - Hispanic or Latino
Median household income ($) - American Indian and Alaska Native
Median household income ($) - Multirace
Median household income ($) - Other Race
Mortgage status - with mortgage (%)
Mortgage status - with second mortgage (%)
Mortgage status - with home equity loan (%)
Mortgage status - with both second mortgage and home equity loan (%)
Mortgage status - without a mortgage (%)
Median year house/condo built
Median year apartment built
Household type by relationship - Male householder living alone (%)
Household type by relationship - Male householder not living alone (%)
Household type by relationship - Female householder living alone (%)
Household type by relationship - Female householder not living alone (%)
Household type by relationship - Opposite-Sex spouse (%)
Household type by relationship - Same-Sex spouse (%)
Household type by relationship - Opposite-Sex unmarried partner (%)
Household type by relationship - Same-Sex unmarried partner (%)
Household type by relationship - In group quarters (%)
Size of family households - 2-person household (%)
Size of family households - 3-person household (%)
Size of family households - 4-person household (%)
Size of family households - 5-person household (%)
Size of family households - 6-person household (%)
Size of family households - 7-or-more-person household (%)
Size of nonfamily households - 1-person household (%)
Size of nonfamily households - 2-person household (%)
Size of nonfamily households - 3-person household (%)
Size of nonfamily households - 4-person household (%)
Size of nonfamily households - 5-person household (%)
Size of nonfamily households - 6-person household (%)
Size of nonfamily households - 7-or-moreperson household (%)
Year house built - Built 2010 or later (%)
Year house built - Built 2000 to 2009 (%)
Year house built - Built 1990 to 1999 (%)
Year house built - Built 1980 to 1989 (%)
Year house built - Built 1970 to 1979 (%)
Year house built - Built 1960 to 1969 (%)
Year house built - Built 1950 to 1959 (%)
Year house built - Built 1940 to 1949 (%)
Year house built - Built 1939 or earlier (%)
Median number of rooms in houses and condos
Median number of rooms in apartments
Median number of bedrooms in owner occupied houses
Mean number of bedrooms in owner occupied houses
Median number of bedrooms in renter occupied houses
Mean number of bedrooms in renter occupied houses
Median number of vehichles in owner occupied houses
Mean number of vehichles in owner occupied houses
Median number of vehichles in renter occupied houses
Mean number of vehichles in renter occupied houses
Rooms in owner-occupied houses - 1 room (%)
Rooms in owner-occupied houses - 2 rooms (%)
Rooms in owner-occupied houses - 3 rooms (%)
Rooms in owner-occupied houses - 4 rooms (%)
Rooms in owner-occupied houses - 5 rooms (%)
Rooms in owner-occupied houses - 6 rooms (%)
Rooms in owner-occupied houses - 7 rooms (%)
Rooms in owner-occupied houses - 8 rooms (%)
Rooms in owner-occupied houses - 9+ rooms (%)
Rooms in renter-occupied houses - 1 room (%)
Rooms in renter-occupied houses - 2 rooms (%)
Rooms in renter-occupied houses - 3 rooms (%)
Rooms in renter-occupied houses - 4 rooms (%)
Rooms in renter-occupied houses - 5 rooms (%)
Rooms in renter-occupied houses - 6 rooms (%)
Rooms in renter-occupied houses - 7 rooms (%)
Rooms in renter-occupied houses - 8 rooms (%)
Rooms in renter-occupied houses - 9+ rooms (%)
Bedrooms in owner-occupied houses - no bedrooms (%)
Bedrooms in owner-occupied houses - 1 bedroom (%)
Bedrooms in owner-occupied houses - 2 bedrooms (%)
Bedrooms in owner-occupied houses - 3 bedrooms (%)
Bedrooms in owner-occupied houses - 4 bedrooms (%)
Bedrooms in owner-occupied houses - 5+ bedrooms (%)
Bedrooms in renter-occupied houses - no bedrooms (%)
Bedrooms in renter-occupied houses - 1 bedroom (%)
Bedrooms in renter-occupied houses - 2 bedrooms (%)
Bedrooms in renter-occupied houses - 3 bedrooms (%)
Bedrooms in renter-occupied houses - 4 bedrooms (%)
Bedrooms in renter-occupied houses - 5+ bedrooms (%)
Vehicles available in owner-occupied houses - no vehicle available (%)
Vehicles available in owner-occupied houses - 1 vehicle available(%)
Vehicles available in owner-occupied houses - 2 Vehicles available (%)
Vehicles available in owner-occupied houses - 3 Vehicles available (%)
Vehicles available in owner-occupied houses - 4 Vehicles available (%)
Vehicles available in owner-occupied houses - 5+ Vehicles available (%)
Vehicles available in renter-occupied houses - no vehicle available (%)
Vehicles available in renter-occupied houses - 1 vehicle available (%)
Vehicles available in renter-occupied houses - 2 Vehicles available (%)
Vehicles available in renter-occupied houses - 3 Vehicles available (%)
Vehicles available in renter-occupied houses - 4 Vehicles available (%)
Vehicles available in renter-occupied houses - 5+ Vehicles available (%)
Housing units in structures - 1, detached (%)
Housing units in structures - 1, attached (%)
Housing units in structures - 2 (%)
Housing units in structures - 3 or 4 (%)
Housing units in structures - 5 to 9 (%)
Housing units in structures - 10 to 19 (%)
Housing units in structures - 20 to 49 (%)
Housing units in structures - 50 or more (%)
Housing units in structures - Mobile home (%)
Housing units in structures - Boat, RV, van, etc. (%)
Housing units in structures - Owners - 1, detached (%)
Housing units in structures - Owners - 1, attached (%)
Housing units in structures - Owners - 2 (%)
Housing units in structures - Owners - 3 or 4 (%)
Housing units in structures - Owners - 5 to 9 (%)
Housing units in structures - Owners - 10 to 19 (%)
Housing units in structures - Owners - 20 to 49 (%)
Housing units in structures - Owners - 50 or more (%)
Housing units in structures - Owners - Mobile home (%)
Housing units in structures - Owners - Boat, RV, van, etc. (%)
Housing units in structures - Renters - 1, detached (%)
Housing units in structures - Renters - 1, attached (%)
Housing units in structures - Renters - 2 (%)
Housing units in structures - Renters - 3 or 4 (%)
Housing units in structures - Renters - 5 to 9 (%)
Housing units in structures - Renters - 10 to 19 (%)
Housing units in structures - Renters - 20 to 49 (%)
Housing units in structures - Renters - 50 or more (%)
Housing units in structures - Renters - Mobile home (%)
Housing units in structures - Renters - Boat, RV, van, etc. (%)
House/condo owner moved in on average (years ago)
Renter moved in on average (years ago)
Year householder moved into unit - Moved in 1999 to March 2000 (%)
Year householder moved into unit - Moved in 1999 to March 2000 (%) - White
Year householder moved into unit - Moved in 1999 to March 2000 (%) - Black or African American
Year householder moved into unit - Moved in 1999 to March 2000 (%) - Asian
Year householder moved into unit - Moved in 1999 to March 2000 (%) - Hispanic or Latino
Year householder moved into unit - Moved in 1999 to March 2000 (%) - American Indian and Alaska Native
Year householder moved into unit - Moved in 1999 to March 2000 (%) - Multirace
Year householder moved into unit - Moved in 1999 to March 2000 (%) - Other Race
Year householder moved into unit - Moved in 1995 to 1998 (%)
Year householder moved into unit - Moved in 1995 to 1998 (%) - White
Year householder moved into unit - Moved in 1995 to 1998 (%) - Black or African American
Year householder moved into unit - Moved in 1995 to 1998 (%) - Asian
Year householder moved into unit - Moved in 1995 to 1998 (%) - Hispanic or Latino
Year householder moved into unit - Moved in 1995 to 1998 (%) - American Indian and Alaska Native
Year householder moved into unit - Moved in 1995 to 1998 (%) - Multirace
Year householder moved into unit - Moved in 1995 to 1998 (%) - Other Race
Year householder moved into unit - Moved in 1990 to 1994 (%)
Year householder moved into unit - Moved in 1990 to 1994 (%) - White
Year householder moved into unit - Moved in 1990 to 1994 (%) - Black or African American
Year householder moved into unit - Moved in 1990 to 1994 (%) - Asian
Year householder moved into unit - Moved in 1990 to 1994 (%) - Hispanic or Latino
Year householder moved into unit - Moved in 1990 to 1994 (%) - American Indian and Alaska Native
Year householder moved into unit - Moved in 1990 to 1994 (%) - Multirace
Year householder moved into unit - Moved in 1990 to 1994 (%) - Other Race
Year householder moved into unit - Moved in 1980 to 1989 (%)
Year householder moved into unit - Moved in 1980 to 1989 (%) - White
Year householder moved into unit - Moved in 1980 to 1989 (%) - Black or African American
Year householder moved into unit - Moved in 1980 to 1989 (%) - Asian
Year householder moved into unit - Moved in 1980 to 1989 (%) - Hispanic or Latino
Year householder moved into unit - Moved in 1980 to 1989 (%) - American Indian and Alaska Native
Year householder moved into unit - Moved in 1980 to 1989 (%) - Multirace
Year householder moved into unit - Moved in 1980 to 1989 (%) - Other Race
Year householder moved into unit - Moved in 1970 to 1979 (%)
Year householder moved into unit - Moved in 1970 to 1979 (%) - White
Year householder moved into unit - Moved in 1970 to 1979 (%) - Black or African American
Year householder moved into unit - Moved in 1970 to 1979 (%) - Asian
Year householder moved into unit - Moved in 1970 to 1979 (%) - Hispanic or Latino
Year householder moved into unit - Moved in 1970 to 1979 (%) - American Indian and Alaska Native
Year householder moved into unit - Moved in 1970 to 1979 (%) - Multirace
Year householder moved into unit - Moved in 1970 to 1979 (%) - Other Race
Year householder moved into unit - Moved in 1969 or earlier (%)
Year householder moved into unit - Moved in 1969 or earlier (%) - White
Year householder moved into unit - Moved in 1969 or earlier (%) - Black or African American
Year householder moved into unit - Moved in 1969 or earlier (%) - Asian
Year householder moved into unit - Moved in 1969 or earlier (%) - Hispanic or Latino
Year householder moved into unit - Moved in 1969 or earlier (%) - American Indian and Alaska Native
Year householder moved into unit - Moved in 1969 or earlier (%) - Multirace
Year householder moved into unit - Moved in 1969 or earlier (%) - Other Race
Housing units lacking complete plumbing facilities (%)
Housing units lacking complete kitchen facilities (%)
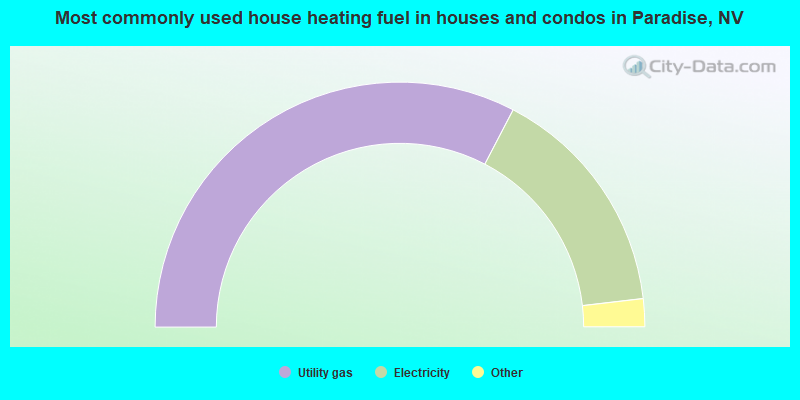
House heating fuel used in houses and condos - Utility gas (%)
House heating fuel used in houses and condos - Bottled, tank, or LP gas (%)
House heating fuel used in houses and condos - Electricity (%)
House heating fuel used in houses and condos - Fuel oil, kerosene, etc. (%)
House heating fuel used in houses and condos - Coal or coke (%)
House heating fuel used in houses and condos - Wood (%)
House heating fuel used in houses and condos - Solar energy (%)
House heating fuel used in houses and condos - Other fuel (%)
House heating fuel used in houses and condos - No fuel used (%)
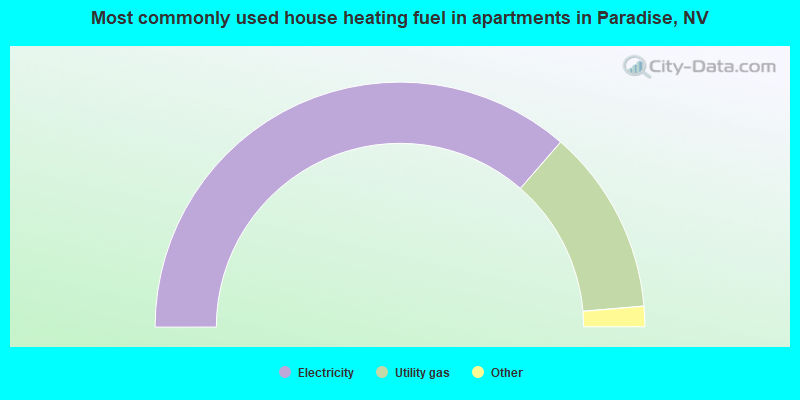
House heating fuel used in apartments - Utility gas (%)
House heating fuel used in apartments - Bottled, tank, or LP gas (%)
House heating fuel used in apartments - Electricity (%)
House heating fuel used in apartments - Fuel oil, kerosene, etc. (%)
House heating fuel used in apartments - Coal or coke (%)
House heating fuel used in apartments - Wood (%)
House heating fuel used in apartments - Solar energy (%)
House heating fuel used in apartments - Other fuel (%)
House heating fuel used in apartments - No fuel used (%)
Latest news about housing in Paradise, NV collected exclusively by city-data.com from local newspapers, TV, and radio stations
Median year house/condo built: 1983Median year apartment built: 1988Household type by relationship:
Households: 183,321
Male householders: 36,459 (12,888 living alone ), Female householders: 38,095 (13,515 living alone )23,585 spouses (23,050 opposite-sex spouses ), 5,855 unmarried partners , (5,396 opposite-sex unmarried partners ), 47,937 children (43,687 natural , 1,937 adopted , 2,313 stepchildren ), 2,223 grandchildren , 4,731 brothers or sisters , 5,063 parents , 73 foster children , 6,997 other relatives , 10,187 non-relatives In group quarters: 2,116
Size of family households: 17,337 2-persons , 8,654 3-persons , 6,858 4-persons , 3,932 5-persons , 2,484 6-persons , 1,022 7-or-more-persons .
Size of nonfamily households: 26,403 1-person , 7,027 2-persons , 629 3-persons , 119 4-persons , 89 6-persons .
17,622 married couples with children. single-parent households (2,561 men , 12,319 women ).
61.0% of residents of Paradise speak English at home. of residents speak Spanish at home (56% speak English very well , 23% speak English well , 16% speak English not well , 5% don't speak English at all ).of residents speak other Indo-European language at home (57% speak English very well , 31% speak English well , 12% speak English not well ).of residents speak Asian or Pacific Island language at home (56% speak English very well , 32% speak English well , 11% speak English not well , 1% don't speak English at all ).of residents speak other language at home (51% speak English very well , 40% speak English well , 9% speak English not well ).
Foreign born population: 47,423 (25.9%)of them are naturalized citizens )
Median number of rooms in houses and condos:
Median number of rooms in apartments
Owner-occupied Renter-occupied
Bedrooms in owner-occupied houses and condos in Paradise, Nevada
0 no bedroom 920 1 bedroom 5,360 2 bedrooms 12,517 3 bedrooms 8,359 4 bedrooms 1,403 5+ bedrooms
Bedrooms in renter-occupied apartments in Paradise, Nevada
5,505 no bedroom 14,007 1 bedroom 17,499 2 bedrooms 6,812 3 bedrooms 1,901 4 bedrooms 271 5+ bedrooms
Owner-occupied Renter-occupied
Rooms in owner-occupied houses in Paradise, Nevada
0 1 room 149 2 rooms 1,266 3 rooms 4,087 4 rooms 7,287 5 rooms 6,167 6 rooms 4,352 7 rooms 2,449 8 rooms 2,802 9+ rooms
Rooms in renter-occupied apartments in Paradise, Nevada
5,396 1 room 4,327 2 rooms 12,678 3 rooms 11,855 4 rooms 6,003 5 rooms 3,072 6 rooms 1,015 7 rooms 788 8 rooms 861 9+ rooms
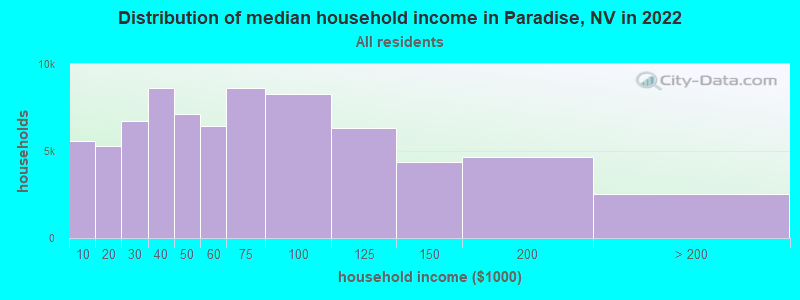
Paradise, NV household income distribution 5,550 Less than $10,0005,260 $10,000 to $19,9996,707 $20,000 to $29,9998,642 $30,000 to $39,9997,117 $40,000 to $49,9996,420 $50,000 to $59,9998,603 $60,000 to $74,9998,304 $75,000 to $99,9996,329 $100,000 to $124,9994,389 $125,000 to $149,9994,678 $150,000 to $199,9992,555 $200,000 or more
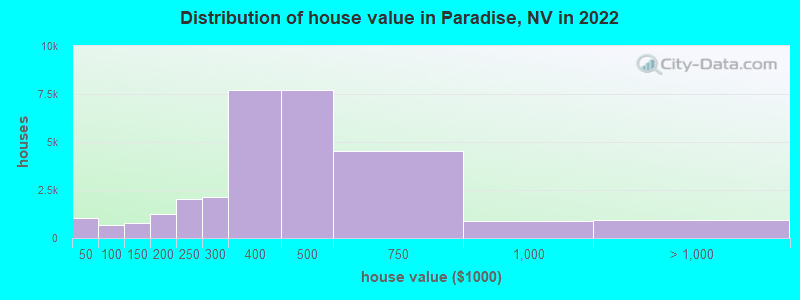
Home value of owner - occupied houses in 2022 in Paradise, NV 396 Less than $10,00017 $10,000 to $14,99980 $15,000 to $19,999131 $20,000 to $24,999129 $25,000 to $29,99939 $30,000 to $34,99976 $35,000 to $39,999179 $40,000 to $49,999203 $50,000 to $59,99965 $60,000 to $69,99948 $70,000 to $79,999119 $80,000 to $89,99956 $90,000 to $99,999486 $100,000 to $124,999279 $125,000 to $149,999720 $150,000 to $174,999520 $175,000 to $199,9992,046 $200,000 to $249,9992,115 $250,000 to $299,9997,697 $300,000 to $399,9997,698 $400,000 to $499,9994,552 $500,000 to $749,999908 $750,000 to $999,999425 $1,000,000 to $1,499,999224 $1,500,000 to $1,999,999262 $2,000,000 or moreRent paid by renters in 2022 in Paradise, NV 209 $200 to $249404 $250 to $299120 $350 to $39973 $450 to $499287 $500 to $549619 $550 to $599210 $600 to $649721 $650 to $6991,327 $700 to $7491,454 $750 to $7994,953 $800 to $8994,337 $900 to $99911,192 $1,000 to $1,2498,494 $1,250 to $1,4999,241 $1,500 to $1,9991,049 $2,000 to $2,499255 $2,500 to $2,999109 $3,000 to $3,499182 $3,500 or more759 No cash rent
Percentage of workers working in this county: 98.4%Number of people working at home: 11,800 (13.1% of all workers )
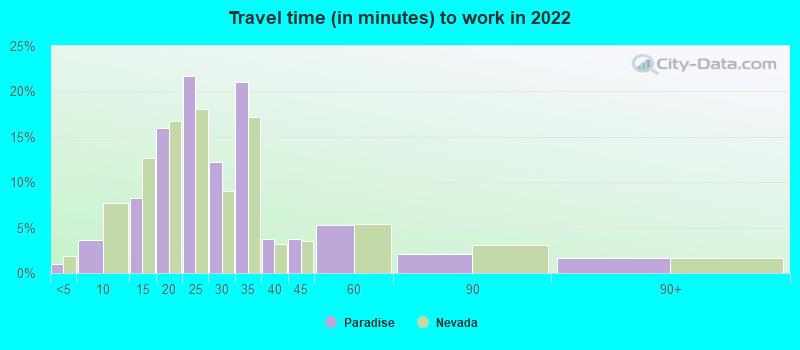
Travel time to work (commute)
Less than 5 minutes: 6735 to 9 minutes: 6,48010 to 14 minutes: 13,09815 to 19 minutes: 17,31220 to 24 minutes: 15,37125 to 29 minutes: 4,81030 to 34 minutes: 11,85035 to 39 minutes: 1,12640 to 44 minutes: 90645 to 59 minutes: 2,47760 to 89 minutes: 2,36790 or more minutes: 2,071
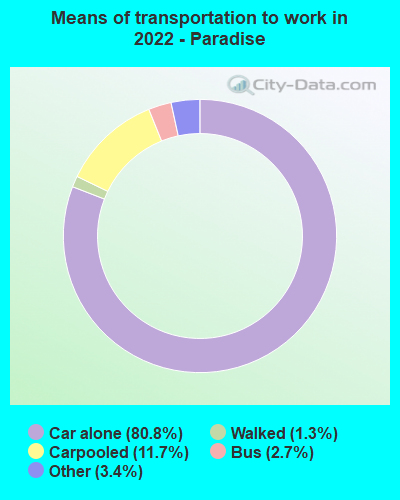
Means of transportation to work:
Drove a car alone: 190,868 (76.9%)Carpooled: 27,753 (11.2%)Bus : 6,280 (2.5%)Subway or elevated rail : 49 (0.0%)Long-distance train or commuter rail : 72 (0.0%)Taxi: 8,107 (3.3%)Bicycle: 159 (0.1%)Walked: 3,023 (1.2%)Worked at home: 11,800 (4.8%)
Unemployment by race in 2022
Unemployment rate for White non-Hispanic residents 8.7% Males9.6% FemalesUnemployment rate for Black residents 7.5% Males6.0% FemalesUnemployment rate for American Indian and Alaska Native residents 15.3% Males8.4% FemalesUnemployment rate for Asian residents 5.2% MalesUnemployment rate for other race residents 4.9% Males6.6% FemalesUnemployment rate for two or more race residents 3.8% Males3.0% FemalesUnemployment rate for Hispanic or Latino residents 6.0% Males4.0% Females
Year of entry for the foreign-born population in Paradise, Nevada
12,217 2010 or later 12,456 2000 to 2009 9,818 1990 to 1999 11,001 1980 to 1989 6,041 1970 to 1979 5,027 Before 1970
First ancestries reported:
English: 4,377 (3.8%)
American: 3,358 (2.9%)
German: 3,305 (2.8%)
Irish: 3,291 (2.8%)
Italian: 3,258 (2.8%)
African: 1,587 (1.4%)
European: 1,114 (1.0%)
Polish: 851 (0.7%)
Scottish: 580 (0.5%)
Norwegian: 452 (0.4%)
Hungarian: 389 (0.3%)
French: 385 (0.3%)
Ethiopian: 340 (0.3%)
British: 333 (0.3%)
Russian: 299 (0.3%)
Moroccan: 286 (0.2%)
Jordanian: 280 (0.2%)
Jamaican: 268 (0.2%)
Dutch: 237 (0.2%)
Greek: 224 (0.2%)
Iranian: 215 (0.2%)
Nigerian: 203 (0.2%)
Ugandan: 195 (0.2%)
Ukrainian: 191 (0.2%)
French Canadian: 189 (0.2%)
Eastern European: 179 (0.2%)
Lebanese: 172 (0.1%)
Armenian: 165 (0.1%)
Palestinian: 163 (0.1%)
Lithuanian: 160 (0.1%)
Romanian: 153 (0.1%)
Israeli: 147 (0.1%)
Brazilian: 141 (0.1%)
Syrian: 137 (0.1%)
Swedish: 132 (0.1%)
Arab: 131 (0.1%)
Portuguese: 129 (0.1%)
Scotch-Irish: 128 (0.1%)
Welsh: 124 (0.1%)
Somali: 116 (0.10%)
Scandinavian: 115 (0.10%)
Canadian: 108 (0.09%)
Trinidadian and Tobagonian: 106 (0.09%)
Sudanese: 96 (0.08%)
Haitian: 89 (0.08%)
Czech: 83 (0.07%)
Albanian: 81 (0.07%)
British West Indian: 81 (0.07%)
Afghan: 80 (0.07%)
Bulgarian: 69 (0.06%)
Belizean: 69 (0.06%)
Liberian: 64 (0.05%)
Swiss: 61 (0.05%)
Turkish: 57 (0.05%)
Yugoslavian: 56 (0.05%)
Iraqi: 49 (0.04%)
Northern European: 49 (0.04%)
Slavic: 45 (0.04%)
Serbian: 43 (0.04%)
Danish: 42 (0.04%)
Slovak: 40 (0.03%)
Macedonian: 38 (0.03%)
Slovene: 37 (0.03%)
Finnish: 33 (0.03%)
Austrian: 31 (0.03%)
West Indian: 31 (0.03%)
Australian: 30 (0.03%)
Basque: 27 (0.02%)
Belgian: 22 (0.02%)
Czechoslovakian: 18 (0.02%)
Cajun: 17 (0.01%)
Croatian: 17 (0.01%)
Icelander: 16 (0.01%)
German Russian: 11 (0.01%)
New Zealander: 10 (0.01%)
Assyrian: 7 (0.01%)
Latvian: 7 (0.01%)
Most common places of birth for foreign-born residents (%): Mexico Paradise:
27.2% (14,222)Nevada:
36.8% (218,248)
Philippines Paradise:
18.9% (9,856)Nevada:
15.5% (91,628)
Cuba Paradise:
13.1% (6,868)Nevada:
4.2% (24,711)
El Salvador Paradise:
5.6% (2,921)Nevada:
4.0% (23,923)
Vietnam Paradise:
2.7% (1,427)Nevada:
2.0% (11,718)
Guatemala Paradise:
2.6% (1,366)Nevada:
2.4% (14,384)
India Paradise:
2.3% (1,226)Nevada:
1.5% (9,074)
China, excluding Hong Kong and Taiwan Paradise:
1.7% (893)Nevada:
3.3% (19,621)
Place of birth for U.S.-born residents:
This state: 39,165Other state: 91,468Northeast: 13,232Midwest: 16,232South: 12,021West: 49,983 85.4% of Paradise residents lived in the same house 1 years ago.
Out of people who lived in different houses, 40.1% lived in this county.
Out of people who lived in different counties, 3.0% lived in Nevada.
Paradise:
85.4%State average:
86.4%
Education attainment for males 25 years and older:
No schooling: 1,502Nursery to 4th grade: 6285th and 6th grade: 8547th and 8th grade: 5879th grade: 1,01810th grade: 1,00011th grade: 67212th grade, no diploma: 3,429High school graduate (or equivalency): 18,618Less than 1 year of college: 4,834Some college more than 1 year, no degree: 9,178Associate degree: 5,892Bachelor's degree: 10,340Master's degree: 3,444Professional school degree: 1,043Doctorate degree: 468
Education attainment for females 25 years and older:
No schooling: 2,133Nursery to 4th grade: 3015th and 6th grade: 8437th and 8th grade: 2309th grade: 90810th grade: 46611th grade: 1,31412th grade, no diploma: 4,078High school graduate (or equivalency): 20,479Less than 1 year of college: 5,649Some college more than 1 year, no degree: 8,833Associate degree: 4,703Bachelor's degree: 10,301Master's degree: 3,609Professional school degree: 440Doctorate degree: 145
Housing units in structures:
One, detached: 29,206One, attached: 5,428Two: 1,2433 or 4: 7,6705 to 9: 9,57910 to 19: 7,45220 to 49: 9,07550 or more: 22,863Mobile homes: 1,248Median worth of mobile homes: $100,800
Housing units lacking complete plumbing facilities in 2022: 1.2%Housing units lacking complete kitchen facilities in 2022: 2.6%House/condo owner moved in on average 9 years ago
Renter moved in on average 2 years ago
Private vs. public school enrollment:
Students in private schools in grades 1 to 8 (elementary and middle school): 1,443 Students in private schools in grades 9 to 12 (high school): 856 Students in private undergraduate colleges: 730