Patesville, KY (Kentucky) Houses and Residents
| Patesville: | $102,800 |
| Kentucky: | $196,300 |
Total population: 2,503 (Urban population: 0, Rural population: 2,454 (425 farm, 2,029 nonfarm))
Houses: 1,018 (911 occupied: 809 owner occupied, 102 renter occupied)
| % of renters here: | 11% |
| State: | 31% |
Housing density: 11 houses/condos per square mile
Median price asked for vacant for-sale houses and condos in 2022 in this county: $74,317.
Median contract rent in 2022: $581 (lower quartile is $694, upper quartile is $754)
Median rent asked for vacant for-rent units in 2022: $504
Median gross rent in Patesville, KY in 2022: $878
Housing units in Patesville with a mortgage: 103 (21 second mortgage, 21 home equity loan, 0 both second mortgage and home equity loan)
Houses without a mortgage: 69
Compare current foreclosures near Patesville, KY:
| Photo | Address | Area | Beds / Baths | Price | Details |
|---|---|---|---|---|---|

|
#1
Murray Ave
Cloverport, KY 40111
|
823 sq. feet
|
1 baths 2 beds |
$28,500
|
show details |

|
#2
18th St
Tell City, IN 47586
|
1,800 sq. feet
|
2 baths 4 beds |
show details | |

|
#3
Reid Rd
Owensboro, KY 42303
|
988 sq. feet
|
2 baths 3 beds |
show details | |

|
#4
Squirrel Tail Hollow Rd
Hawesville, KY 42348
|
1,983 sq. feet
|
3 baths 5 beds |
show details | |

|
#5
25th St
Tell City, IN 47586
|
2,397 sq. feet
|
1 baths 4 beds |
show details | |

|
#6
13th St
Tell City, IN 47586
|
1,288 sq. feet
|
1 baths 4 beds |
show details | |

|
#7
Scotland Dr
Owensboro, KY 42303
|
2,064 sq. feet
|
2 baths 3 beds |
show details | |

|
#8
Boteler Rd
Philpot, KY 42366
|
1,736 sq. feet
|
1 baths 3 beds |
show details | |

|
#9
Washington St
Tell City, IN 47586
|
988 sq. feet
|
1 baths 2 beds |
show details | |

|
#10
22nd St
Tell City, IN 47586
|
1,665 sq. feet
|
2 baths 2 beds |
show details |
| Photo | Address | Area | Beds / Baths | Price | Details |
|---|---|---|---|---|---|

|
#11
14th St
Tell City, IN 47586
|
2,444 sq. feet
|
1 baths 2 beds |
show details | |

|
#12
S Hardin St
Hardinsburg, KY 40143
|
1,120 sq. feet
|
1 baths 2 beds |
show details | |

|
#13
23rd St
Tell City, IN 47586
|
1,488 sq. feet
|
2 baths 3 beds |
show details | |

|
#14
18th St
Tell City, IN 47586
|
925 sq. feet
|
1 baths 2 beds |
show details | |

|
#15
Tell St
Tell City, IN 47586
|
1,372 sq. feet
|
1 baths 3 beds |
show details | |

|
#16
10th St
Tell City, IN 47586
|
1,664 sq. feet
|
1 baths 2 beds |
show details | |

|
#17
13th St
Tell City, IN 47586
|
1,680 sq. feet
|
1 baths 3 beds |
show details | |

|
#18
Hillbrook Loop
Hardinsburg, KY 40143
|
1,547 sq. feet
|
1 baths 4 beds |
show details | |

|
#19
Shady Rd
Cannelton, IN 47520
|
1,432 sq. feet
|
1 baths 2 beds |
show details | |

|
#20
Main St
Tell City, IN 47586
|
1,680 sq. feet
|
1 baths 2 beds |
show details |
| Photo | Address | Area | Beds / Baths | Price | Details |
|---|---|---|---|---|---|

|
#21
Lakeshore Dr
Hardinsburg, KY 40143
|
3,134 sq. feet
|
3 baths 3 beds |
show details | |

|
#22
12th St
Tell City, IN 47586
|
1,435 sq. feet
|
1 baths 3 beds |
show details | |

|
#23
Yelvington Ln
Maceo, KY 42355
|
716 sq. feet
|
1 baths 2 beds |
show details | |

|
#24
Old Highway 54
Philpot, KY 42366
|
1,380 sq. feet
|
1 baths 2 beds |
show details | |

|
#25
Sand Hill Rd
Lewisport, KY 42351
|
970 sq. feet
|
1 baths 2 beds |
show details | |

|
#26
N Highway 259
Hardinsburg, KY 40143
|
1,344 sq. feet
|
2 baths 3 beds |
show details | |

|
#27
Old Highway 54
Philpot, KY 42366
|
1,088 sq. feet
|
1 baths 2 beds |
show details | |

|
#28
Kelly Cemetery Rd
Maceo, KY 42355
|
1,176 sq. feet
|
1 baths 3 beds |
show details | |

|
#29
Old State Rd
Philpot, KY 42366
|
1,440 sq. feet
|
1 baths 2 beds |
show details | |

|
#30
Sutter Loop E
Owensboro, KY 42303
|
1,014 sq. feet
|
1 baths 3 beds |
show details |
| Photo | Address | Area | Beds / Baths | Price | Details |
|---|---|---|---|---|---|

|
#31
Scott Ct
Owensboro, KY 42303
|
1,189 sq. feet
|
1 baths 3 beds |
show details | |

|
#32
River Rd
Lewisport, KY 42351
|
1,320 sq. feet
|
2 baths 4 beds |
show details | |

|
#33
Meadowlane Dr
Lewisport, KY 42351
|
1,228 sq. feet
|
1 baths 3 beds |
show details | |

|
#34
Terrace Ave
Tell City, IN 47586
|
1,080 sq. feet
|
1 baths 3 beds |
show details | |

|
#35
Creek Run Rd
Hardinsburg, KY 40143
|
4,497 sq. feet
|
3 baths 4 beds |
show details | |

|
#36
Upper Washington Ln
Hawesville, KY 42348
|
1,428 sq. feet
|
1 baths 4 beds |
show details | |

|
#37
Hawesville Easton Rd
Reynolds Station, KY 42368
|
1,008 sq. feet
|
2 baths 3 beds |
show details | |

|
#38
Happy Hollow Rd
Hawesville, KY 42348
|
1,260 sq. feet
|
2 baths 2 beds |
show details | |

|
#39
Masonville Habit Rd
Philpot, KY 42366
|
1,359 sq. feet
|
1 baths 3 beds |
show details | |

|
#40
W Houston St
Cloverport, KY 40111
|
1,680 sq. feet
|
2 baths 3 beds |
show details |
| Photo | Address | Area | Beds / Baths | Price | Details |
|---|---|---|---|---|---|

|
#41
Happy Hollow Rd
Hawesville, KY 42348
|
1,232 sq. feet
|
2 baths 3 beds |
show details | |

|
#42
Cannonade Loop S
Owensboro, KY 42303
|
1,460 sq. feet
|
2 baths 3 beds |
show details | |

|
#43
5th St
Cloverport, KY 40111
|
2,164 sq. feet
|
1 baths 2 beds |
show details | |

|
#44
State Route 2181
Hawesville, KY 42348
|
1,335 sq. feet
|
1 baths 3 beds |
show details | |

|
#45
Tarfork Easton Ln
Falls Of Rough, KY 40119
|
1,494 sq. feet
|
2 baths 2 beds |
show details | |

|
#46
E Main St
Cloverport, KY 40111
|
1,792 sq. feet
|
2 baths 4 beds |
show details | |

|
#47
Elm Tree Ln
Hawesville, KY 42348
|
1,200 sq. feet
|
2 baths 3 beds |
show details | |

|
#48
Court Dijon
Owensboro, KY 42303
|
1,340 sq. feet
|
2 baths 3 beds |
show details | |

|
#49
Carolyn Ln
Hardinsburg, KY 40143
|
1,372 sq. feet
|
2 baths 3 beds |
show details | |

|
Check over 1 million property listings on Foreclosure.com!
|
browse all offers | |||

Household type by relationship:
Households: 8,475- In family households: 7,526 (1,895 male householders, 556 female householders)
1,984 spouses, 2,588 children (2,296 natural, 69 adopted, 223 stepchildren), 170 grandchildren, 35 brothers or sisters, 34 parents, foster children, 61 other relatives, 174 non-relatives
- In nonfamily households: 949 (431 male householders (381 living alone)), 403 female householders (360 living alone)), 115 nonrelatives
- In group quarters: 90 (39 institutionalized population)
1,753 married couples with children.
356 single-parent households (87 men, 269 women).
98.5% of residents of Patesville speak English at home.
0.8% of residents speak Spanish at home (59% speak English very well, 41% speak English well).
0.7% of residents speak other Indo-European language at home (100% speak English very well).
Foreign born population: 28 (1.1%)
(75.0% of them are naturalized citizens)
| Here: | 6.4 |
| State: | 6.4 |
| Here: | 6.2 |
| State: | 4.4 |

- Bedrooms in owner-occupied houses and condos in Patesville, Kentucky
- 0no bedroom
- 621 bedroom
- 1712 bedrooms
- 4903 bedrooms
- 624 bedrooms
- 245+ bedrooms

- Bedrooms in renter-occupied apartments in Patesville, Kentucky
- 0no bedroom
- 81 bedroom
- 232 bedrooms
- 383 bedrooms
- 94 bedrooms
- 245+ bedrooms

- Cars and other vehicles available in Patesville in owner-occupied houses/condos
- 38no vehicle
- 1321 vehicle
- 3622 vehicles
- 2253 vehicles
- 304 vehicles
- 225+ vehicles

- Cars and other vehicles available in Patesville in renter-occupied apartments
- 17no vehicle
- 321 vehicle
- 392 vehicles
- 73 vehicles
- 74 vehicles
- 05+ vehicles

- Rooms in owner-occupied houses in Patesville, Kentucky
- 01 room
- 62 rooms
- 173 rooms
- 1614 rooms
- 2525 rooms
- 1426 rooms
- 1527 rooms
- 348 rooms
- 459+ rooms

- Rooms in renter-occupied apartments in Patesville, Kentucky
- 01 room
- 02 rooms
- 03 rooms
- 314 rooms
- 235 rooms
- 206 rooms
- 127 rooms
- 78 rooms
- 99+ rooms


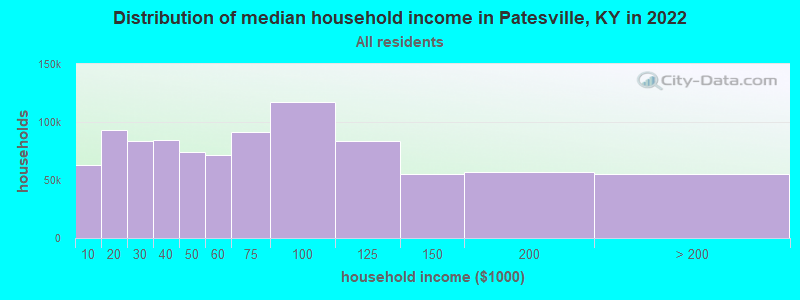
Patesville, KY household income distribution

- 54,644Less than $10,000
- 88,655$10,000 to $19,999
- 74,705$20,000 to $29,999
- 79,147$30,000 to $39,999
- 60,482$40,000 to $49,999
- 66,449$50,000 to $59,999
- 76,231$60,000 to $74,999
- 105,647$75,000 to $99,999
- 75,496$100,000 to $124,999
- 46,323$125,000 to $149,999
- 45,911$150,000 to $199,999
- 39,467$200,000 or more
Percentage of workers working in this county: 40.7%
Number of people working at home: 93 (8.5% of all workers)
Travel time to work (commute)
- Less than 5 minutes: 26
- 5 to 9 minutes: 21
- 10 to 14 minutes: 44
- 15 to 19 minutes: 122
- 20 to 24 minutes: 177
- 25 to 29 minutes: 81
- 30 to 34 minutes: 228
- 35 to 39 minutes: 36
- 40 to 44 minutes: 71
- 45 to 59 minutes: 128
- 60 to 89 minutes: 63
- 90 or more minutes: 28
Means of transportation to work:
- Drove a car alone: 912 (86.7%)
- Carpooled: 92 (8.7%)
- Bus or trolley bus: 3 (0.3%)
- Walked: 6 (0.6%)
- Other means: 12 (1.1%)
- Worked at home: 27 (2.6%)


- Year of entry for the foreign-born population in Patesville, Kentucky
- 41995 to March 2000
- 61990 to 1994
- 01985 to 1989
- 01980 to 1984
- 01975 to 1979
- 01970 to 1974
- 61965 to 1969
- 0Before 1965
Most common places of birth for foreign-born residents (%):
| Patesville: | 37.5% (6) |
| Kentucky: | 8.3% (6,658) |
| Patesville: | 37.5% (6) |
| Kentucky: | 0.1% (112) |
| Patesville: | 25.0% (4) |
| Kentucky: | 1.5% (1,174) |
Place of birth for U.S.-born residents:
- This state: 1,916
- Other state: 518
- Northeast: 50
- Midwest: 363
- South: 74
- West: 31
62% of Patesville residents lived in the same house 5 years ago.
Out of people who lived in different houses, 47% lived in this county.
Out of people who lived in different counties, 58% lived in Kentucky.
Education attainment for males 25 years and older:
- No schooling: 8
- Nursery to 4th grade: 8
- 5th and 6th grade: 0
- 7th and 8th grade: 77
- 9th grade: 25
- 10th grade: 27
- 11th grade: 16
- 12th grade, no diploma: 42
- High school graduate (or equivalency): 379
- Less than 1 year of college: 49
- Some college more than 1 year, no degree: 83
- Associate degree: 21
- Bachelor's degree: 47
- Master's degree: 13
- Professional school degree: 0
- Doctorate degree: 0

Education attainment for females 25 years and older:
- No schooling: 5
- Nursery to 4th grade: 14
- 5th and 6th grade: 0
- 7th and 8th grade: 72
- 9th grade: 57
- 10th grade: 43
- 11th grade: 9
- 12th grade, no diploma: 26
- High school graduate (or equivalency): 345
- Less than 1 year of college: 32
- Some college more than 1 year, no degree: 125
- Associate degree: 37
- Bachelor's degree: 24
- Master's degree: 0
- Professional school degree: 5
- Doctorate degree: 0


Housing units in structures:
- One, detached: 537
- One, attached: 23
- Two: 6
- Mobile homes: 452
Median worth of mobile homes: $57,660
Housing units lacking complete kitchen facilities: 0.9%

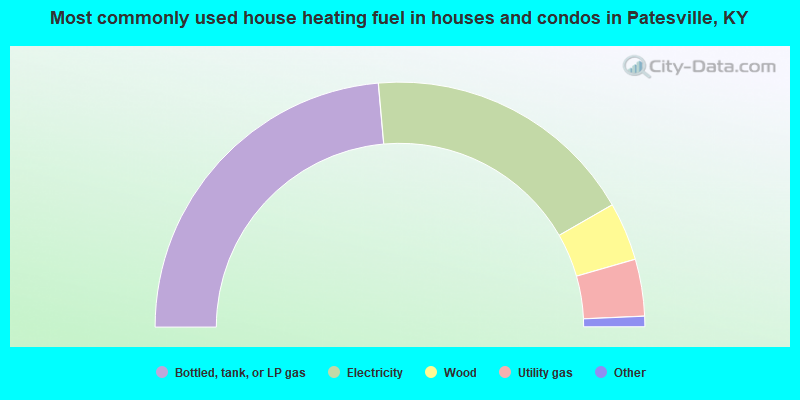
- 47.2%Bottled, tank, or LP gas
- 36.2%Electricity
- 7.7%Wood
- 7.5%Utility gas
- 0.7%Fuel oil, kerosene, etc.
- 0.6%Coal or coke
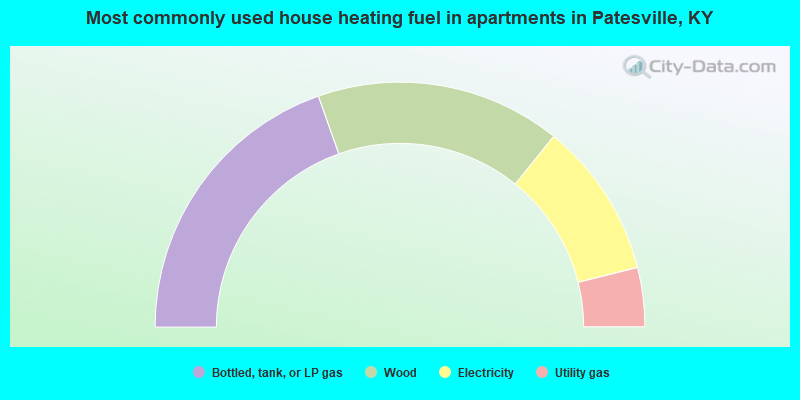
- 39.2%Bottled, tank, or LP gas
- 32.4%Wood
- 20.6%Electricity
- 7.8%Utility gas
Private vs. public school enrollment:
| Here: | 15.4% |
| Kentucky: | 11.9% |
| Here: | 10.9% |
| Kentucky: | 10.6% |
| Here: | 22.6% |
| Kentucky: | 18.1% |


