Pearland, TX (Texas) Houses and Residents
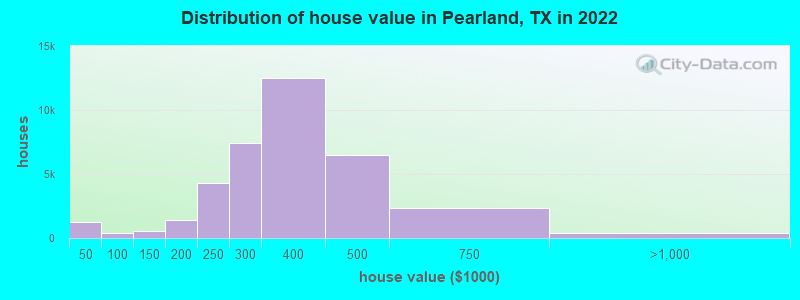
Estimated median house or condo value in 2022: $334,800 (it was $114,100 in 2000 )
Pearland:
$334,800Texas:
$275,400
Lower value quartile - upper value quartile: $266,700 - $398,000Mean price in 2022: Detached houses: $377,923 Here:
$377,923State:
$369,058
Townhouses or other attached units: $550,321 Here:
$550,321State:
$327,631
Mobile homes: $98,835 Here:
$98,835State:
$124,413
Total population: 103,441 (Urban population: 37,324, Rural population: 272 (all nonfarm) )
Houses: 45,142 (43,744 occupied: 33,481 owner occupied, 10,263 renter occupied )
% of renters here:
23%State:
38%
Housing density: 1,148 houses/condos per square mile
Median price asked for vacant for-sale houses and condos in 2022: $735,045.
Median contract rent in 2022: $1,447 (lower quartile is $994, upper quartile is $1,785)
Median rent asked for vacant for-rent units in 2022: $1,334
Median gross rent in Pearland, TX in 2022: $1,567
Housing units in Pearland with a mortgage: 21,537 (744 second mortgage, 35 home equity loan, 660 both second mortgage and home equity loan )Houses without a mortgage: 193
Median household income for houses/condos with a mortgage: $128,277
Median household income for apartments without a mortgage: $123,485
Median monthly housing costs: $1,771
Data:
Median house or condo value ($)
Median house or condo value ($ change since 2000)
Median house or condo value ($) - White
Median house or condo value ($) - Black or African American
Median house or condo value ($) - Asian
Median house or condo value ($) - Hispanic or Latino
Median house or condo value ($) - American Indian and Alaska Native
Median house or condo value ($) - Multirace
Median house or condo value ($) - Other Race
Median price asked for mobile homes ($)
Household density (households per square mile)
Mean house or condo value by units in structure - 1, detached ($)
Mean house or condo value by units in structure - 1, attached ($)
Mean house or condo value by units in structure - 2 ($)
Mean house or condo value by units in structure by units in structure - 3 or 4 ($)
Mean house or condo value by units in structure - 5 or more ($)
Mean house or condo value by units in structure - Boat, RV, van, etc. ($)
Mean house or condo value by units in structure - Mobile home ($)
Median contract rent ($)
Median contract rent - Lower quartile ($)
Median contract rent - Upper quartile ($)
Median gross rent ($)
Urban houses (%)
Rural houses (%)
Houses occupied (%)
Houses occupied (% change since 2000)
Houses owner occupied (%)
Houses owner occupied (% change since 2000)
Houses renter occupied (%)
Houses renter occupied (% change since 2000)
Vacant housing units - For rent (%)
Vacant housing units - For rent (% change since 2000)
Vacant housing units - For sale only (%)
Vacant housing units - For sale only (% change since 2000)
Vacant housing units - Rented or sold, not occupied (%)
Vacant housing units - Rented or sold, not occupied (% change since 2000)
Vacant housing units - For seasonal, recreational, or occasional use (%)
Vacant housing units - For seasonal, recreational, or occasional use (% change since 2000)
Vacant housing units - For migrant workers (%)
Vacant housing units - For migrant workers (% change since 2000)
Vacant housing units - Other vacant (%)
Vacant housing units - Other vacant (% change since 2000)
Median monthly housing costs ($)
Median household income for houses/condos with a mortgage ($)
Median household income for houses/condos without a mortgage ($)
Median household income ($)
Median household income ($) - White
Median household income ($) - Black or African American
Median household income ($) - Asian
Median household income ($) - Hispanic or Latino
Median household income ($) - American Indian and Alaska Native
Median household income ($) - Multirace
Median household income ($) - Other Race
Mortgage status - with mortgage (%)
Mortgage status - with second mortgage (%)
Mortgage status - with home equity loan (%)
Mortgage status - with both second mortgage and home equity loan (%)
Mortgage status - without a mortgage (%)
Median year house/condo built
Median year apartment built
Household type by relationship - Male householder living alone (%)
Household type by relationship - Male householder not living alone (%)
Household type by relationship - Female householder living alone (%)
Household type by relationship - Female householder not living alone (%)
Household type by relationship - Opposite-Sex spouse (%)
Household type by relationship - Same-Sex spouse (%)
Household type by relationship - Opposite-Sex unmarried partner (%)
Household type by relationship - Same-Sex unmarried partner (%)
Household type by relationship - In group quarters (%)
Size of family households - 2-person household (%)
Size of family households - 3-person household (%)
Size of family households - 4-person household (%)
Size of family households - 5-person household (%)
Size of family households - 6-person household (%)
Size of family households - 7-or-more-person household (%)
Size of nonfamily households - 1-person household (%)
Size of nonfamily households - 2-person household (%)
Size of nonfamily households - 3-person household (%)
Size of nonfamily households - 4-person household (%)
Size of nonfamily households - 5-person household (%)
Size of nonfamily households - 6-person household (%)
Size of nonfamily households - 7-or-moreperson household (%)
Year house built - Built 2010 or later (%)
Year house built - Built 2000 to 2009 (%)
Year house built - Built 1990 to 1999 (%)
Year house built - Built 1980 to 1989 (%)
Year house built - Built 1970 to 1979 (%)
Year house built - Built 1960 to 1969 (%)
Year house built - Built 1950 to 1959 (%)
Year house built - Built 1940 to 1949 (%)
Year house built - Built 1939 or earlier (%)
Median number of rooms in houses and condos
Median number of rooms in apartments
Median number of bedrooms in owner occupied houses
Mean number of bedrooms in owner occupied houses
Median number of bedrooms in renter occupied houses
Mean number of bedrooms in renter occupied houses
Median number of vehichles in owner occupied houses
Mean number of vehichles in owner occupied houses
Median number of vehichles in renter occupied houses
Mean number of vehichles in renter occupied houses
Rooms in owner-occupied houses - 1 room (%)
Rooms in owner-occupied houses - 2 rooms (%)
Rooms in owner-occupied houses - 3 rooms (%)
Rooms in owner-occupied houses - 4 rooms (%)
Rooms in owner-occupied houses - 5 rooms (%)
Rooms in owner-occupied houses - 6 rooms (%)
Rooms in owner-occupied houses - 7 rooms (%)
Rooms in owner-occupied houses - 8 rooms (%)
Rooms in owner-occupied houses - 9+ rooms (%)
Rooms in renter-occupied houses - 1 room (%)
Rooms in renter-occupied houses - 2 rooms (%)
Rooms in renter-occupied houses - 3 rooms (%)
Rooms in renter-occupied houses - 4 rooms (%)
Rooms in renter-occupied houses - 5 rooms (%)
Rooms in renter-occupied houses - 6 rooms (%)
Rooms in renter-occupied houses - 7 rooms (%)
Rooms in renter-occupied houses - 8 rooms (%)
Rooms in renter-occupied houses - 9+ rooms (%)
Bedrooms in owner-occupied houses - no bedrooms (%)
Bedrooms in owner-occupied houses - 1 bedroom (%)
Bedrooms in owner-occupied houses - 2 bedrooms (%)
Bedrooms in owner-occupied houses - 3 bedrooms (%)
Bedrooms in owner-occupied houses - 4 bedrooms (%)
Bedrooms in owner-occupied houses - 5+ bedrooms (%)
Bedrooms in renter-occupied houses - no bedrooms (%)
Bedrooms in renter-occupied houses - 1 bedroom (%)
Bedrooms in renter-occupied houses - 2 bedrooms (%)
Bedrooms in renter-occupied houses - 3 bedrooms (%)
Bedrooms in renter-occupied houses - 4 bedrooms (%)
Bedrooms in renter-occupied houses - 5+ bedrooms (%)
Vehicles available in owner-occupied houses - no vehicle available (%)
Vehicles available in owner-occupied houses - 1 vehicle available(%)
Vehicles available in owner-occupied houses - 2 Vehicles available (%)
Vehicles available in owner-occupied houses - 3 Vehicles available (%)
Vehicles available in owner-occupied houses - 4 Vehicles available (%)
Vehicles available in owner-occupied houses - 5+ Vehicles available (%)
Vehicles available in renter-occupied houses - no vehicle available (%)
Vehicles available in renter-occupied houses - 1 vehicle available (%)
Vehicles available in renter-occupied houses - 2 Vehicles available (%)
Vehicles available in renter-occupied houses - 3 Vehicles available (%)
Vehicles available in renter-occupied houses - 4 Vehicles available (%)
Vehicles available in renter-occupied houses - 5+ Vehicles available (%)
Housing units in structures - 1, detached (%)
Housing units in structures - 1, attached (%)
Housing units in structures - 2 (%)
Housing units in structures - 3 or 4 (%)
Housing units in structures - 5 to 9 (%)
Housing units in structures - 10 to 19 (%)
Housing units in structures - 20 to 49 (%)
Housing units in structures - 50 or more (%)
Housing units in structures - Mobile home (%)
Housing units in structures - Boat, RV, van, etc. (%)
Housing units in structures - Owners - 1, detached (%)
Housing units in structures - Owners - 1, attached (%)
Housing units in structures - Owners - 2 (%)
Housing units in structures - Owners - 3 or 4 (%)
Housing units in structures - Owners - 5 to 9 (%)
Housing units in structures - Owners - 10 to 19 (%)
Housing units in structures - Owners - 20 to 49 (%)
Housing units in structures - Owners - 50 or more (%)
Housing units in structures - Owners - Mobile home (%)
Housing units in structures - Owners - Boat, RV, van, etc. (%)
Housing units in structures - Renters - 1, detached (%)
Housing units in structures - Renters - 1, attached (%)
Housing units in structures - Renters - 2 (%)
Housing units in structures - Renters - 3 or 4 (%)
Housing units in structures - Renters - 5 to 9 (%)
Housing units in structures - Renters - 10 to 19 (%)
Housing units in structures - Renters - 20 to 49 (%)
Housing units in structures - Renters - 50 or more (%)
Housing units in structures - Renters - Mobile home (%)
Housing units in structures - Renters - Boat, RV, van, etc. (%)
House/condo owner moved in on average (years ago)
Renter moved in on average (years ago)
Year householder moved into unit - Moved in 1999 to March 2000 (%)
Year householder moved into unit - Moved in 1999 to March 2000 (%) - White
Year householder moved into unit - Moved in 1999 to March 2000 (%) - Black or African American
Year householder moved into unit - Moved in 1999 to March 2000 (%) - Asian
Year householder moved into unit - Moved in 1999 to March 2000 (%) - Hispanic or Latino
Year householder moved into unit - Moved in 1999 to March 2000 (%) - American Indian and Alaska Native
Year householder moved into unit - Moved in 1999 to March 2000 (%) - Multirace
Year householder moved into unit - Moved in 1999 to March 2000 (%) - Other Race
Year householder moved into unit - Moved in 1995 to 1998 (%)
Year householder moved into unit - Moved in 1995 to 1998 (%) - White
Year householder moved into unit - Moved in 1995 to 1998 (%) - Black or African American
Year householder moved into unit - Moved in 1995 to 1998 (%) - Asian
Year householder moved into unit - Moved in 1995 to 1998 (%) - Hispanic or Latino
Year householder moved into unit - Moved in 1995 to 1998 (%) - American Indian and Alaska Native
Year householder moved into unit - Moved in 1995 to 1998 (%) - Multirace
Year householder moved into unit - Moved in 1995 to 1998 (%) - Other Race
Year householder moved into unit - Moved in 1990 to 1994 (%)
Year householder moved into unit - Moved in 1990 to 1994 (%) - White
Year householder moved into unit - Moved in 1990 to 1994 (%) - Black or African American
Year householder moved into unit - Moved in 1990 to 1994 (%) - Asian
Year householder moved into unit - Moved in 1990 to 1994 (%) - Hispanic or Latino
Year householder moved into unit - Moved in 1990 to 1994 (%) - American Indian and Alaska Native
Year householder moved into unit - Moved in 1990 to 1994 (%) - Multirace
Year householder moved into unit - Moved in 1990 to 1994 (%) - Other Race
Year householder moved into unit - Moved in 1980 to 1989 (%)
Year householder moved into unit - Moved in 1980 to 1989 (%) - White
Year householder moved into unit - Moved in 1980 to 1989 (%) - Black or African American
Year householder moved into unit - Moved in 1980 to 1989 (%) - Asian
Year householder moved into unit - Moved in 1980 to 1989 (%) - Hispanic or Latino
Year householder moved into unit - Moved in 1980 to 1989 (%) - American Indian and Alaska Native
Year householder moved into unit - Moved in 1980 to 1989 (%) - Multirace
Year householder moved into unit - Moved in 1980 to 1989 (%) - Other Race
Year householder moved into unit - Moved in 1970 to 1979 (%)
Year householder moved into unit - Moved in 1970 to 1979 (%) - White
Year householder moved into unit - Moved in 1970 to 1979 (%) - Black or African American
Year householder moved into unit - Moved in 1970 to 1979 (%) - Asian
Year householder moved into unit - Moved in 1970 to 1979 (%) - Hispanic or Latino
Year householder moved into unit - Moved in 1970 to 1979 (%) - American Indian and Alaska Native
Year householder moved into unit - Moved in 1970 to 1979 (%) - Multirace
Year householder moved into unit - Moved in 1970 to 1979 (%) - Other Race
Year householder moved into unit - Moved in 1969 or earlier (%)
Year householder moved into unit - Moved in 1969 or earlier (%) - White
Year householder moved into unit - Moved in 1969 or earlier (%) - Black or African American
Year householder moved into unit - Moved in 1969 or earlier (%) - Asian
Year householder moved into unit - Moved in 1969 or earlier (%) - Hispanic or Latino
Year householder moved into unit - Moved in 1969 or earlier (%) - American Indian and Alaska Native
Year householder moved into unit - Moved in 1969 or earlier (%) - Multirace
Year householder moved into unit - Moved in 1969 or earlier (%) - Other Race
Housing units lacking complete plumbing facilities (%)
Housing units lacking complete kitchen facilities (%)
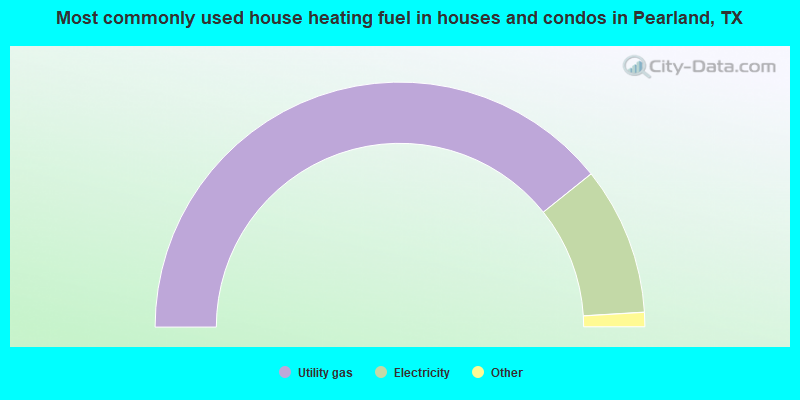
House heating fuel used in houses and condos - Utility gas (%)
House heating fuel used in houses and condos - Bottled, tank, or LP gas (%)
House heating fuel used in houses and condos - Electricity (%)
House heating fuel used in houses and condos - Fuel oil, kerosene, etc. (%)
House heating fuel used in houses and condos - Coal or coke (%)
House heating fuel used in houses and condos - Wood (%)
House heating fuel used in houses and condos - Solar energy (%)
House heating fuel used in houses and condos - Other fuel (%)
House heating fuel used in houses and condos - No fuel used (%)
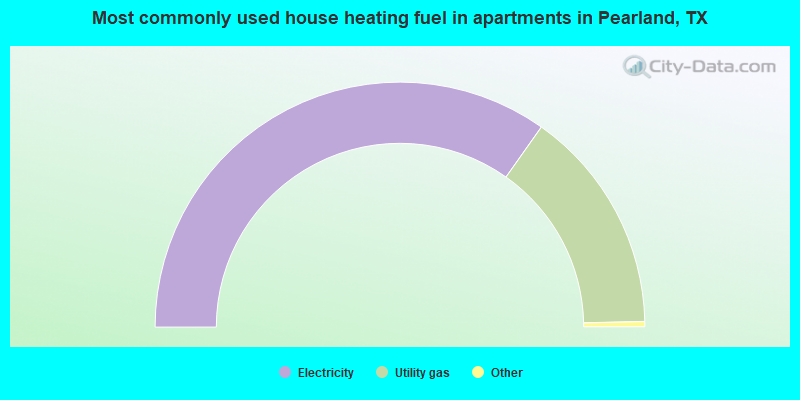
House heating fuel used in apartments - Utility gas (%)
House heating fuel used in apartments - Bottled, tank, or LP gas (%)
House heating fuel used in apartments - Electricity (%)
House heating fuel used in apartments - Fuel oil, kerosene, etc. (%)
House heating fuel used in apartments - Coal or coke (%)
House heating fuel used in apartments - Wood (%)
House heating fuel used in apartments - Solar energy (%)
House heating fuel used in apartments - Other fuel (%)
House heating fuel used in apartments - No fuel used (%)
Latest news about housing in Pearland, TX collected exclusively by city-data.com from local newspapers, TV, and radio stations
Median year house/condo built: 2004Median year apartment built: 2002Household type by relationship:
Households: 127,170
Male householders: 23,331 (4,226 living alone ), Female householders: 20,413 (5,294 living alone )25,830 spouses (25,775 opposite-sex spouses ), 3,563 unmarried partners , (3,563 opposite-sex unmarried partners ), 44,524 children (41,339 natural , 749 adopted , 2,436 stepchildren ), 1,838 grandchildren , 715 brothers or sisters , 2,167 parents , 58 foster children , 1,731 other relatives , 2,397 non-relatives In group quarters: 603
Size of family households: 9,938 2-persons , 7,969 3-persons , 9,015 4-persons , 2,605 5-persons , 1,457 6-persons , 850 7-or-more-persons .
Size of nonfamily households: 9,520 1-person , 2,233 2-persons , 53 3-persons , 104 4-persons .
23,356 married couples with children. single-parent households (2,317 men , 5,196 women ).
70.3% of residents of Pearland speak English at home. of residents speak Spanish at home (71% speak English very well , 20% speak English well , 7% speak English not well , 1% don't speak English at all ).of residents speak other Indo-European language at home (62% speak English very well , 25% speak English well , 12% speak English not well , 1% don't speak English at all ).of residents speak Asian or Pacific Island language at home (61% speak English very well , 22% speak English well , 14% speak English not well , 3% don't speak English at all ).of residents speak other language at home (67% speak English very well , 27% speak English well , 5% speak English not well , 1% don't speak English at all ).
Foreign born population: 24,669 (19.4%)of them are naturalized citizens )
Median number of rooms in houses and condos:
Median number of rooms in apartments
Owner-occupied Renter-occupied
Rooms in owner-occupied houses in Pearland, Texas
0 1 room 0 2 rooms 194 3 rooms 1,046 4 rooms 5,503 5 rooms 6,703 6 rooms 5,525 7 rooms 5,971 8 rooms 8,539 9+ rooms
Rooms in renter-occupied apartments in Pearland, Texas
41 1 room 1,266 2 rooms 2,916 3 rooms 2,390 4 rooms 1,508 5 rooms 1,086 6 rooms 496 7 rooms 527 8 rooms 33 9+ rooms
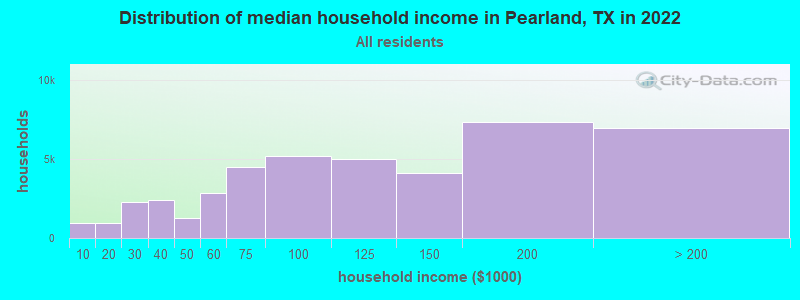
Pearland, TX household income distribution 968 Less than $10,000924 $10,000 to $19,9992,275 $20,000 to $29,9992,417 $30,000 to $39,9991,281 $40,000 to $49,9992,835 $50,000 to $59,9994,510 $60,000 to $74,9995,187 $75,000 to $99,9994,969 $100,000 to $124,9994,114 $125,000 to $149,9997,322 $150,000 to $199,9996,942 $200,000 or more
Home value of owner - occupied houses in 2022 in Pearland, TX 550 Less than $10,00015 $10,000 to $14,99993 $15,000 to $19,999185 $20,000 to $24,999138 $25,000 to $29,999140 $30,000 to $34,99995 $35,000 to $39,99964 $40,000 to $49,99960 $50,000 to $59,99940 $60,000 to $69,99996 $70,000 to $79,99950 $80,000 to $89,999104 $90,000 to $99,999373 $100,000 to $124,999192 $125,000 to $149,999559 $150,000 to $174,999839 $175,000 to $199,9994,314 $200,000 to $249,9997,448 $250,000 to $299,99912,529 $300,000 to $399,9996,513 $400,000 to $499,9992,321 $500,000 to $749,999235 $750,000 to $999,99997 $1,000,000 to $1,499,99937 $1,500,000 to $1,999,99934 $2,000,000 or moreRent paid by renters in 2022 in Pearland, TX 7 $100 to $14948 $250 to $29928 $350 to $39937 $400 to $44919 $450 to $499101 $500 to $54976 $550 to $59963 $650 to $69935 $700 to $749126 $750 to $799635 $800 to $899356 $900 to $9991,861 $1,000 to $1,2492,070 $1,250 to $1,4994,098 $1,500 to $1,9991,024 $2,000 to $2,499173 $2,500 to $2,99972 $3,000 to $3,49924 $3,500 or more127 No cash rent
Percentage of workers working in this county: 42.5%Number of people working at home: 8,787 (13.6% of all workers )
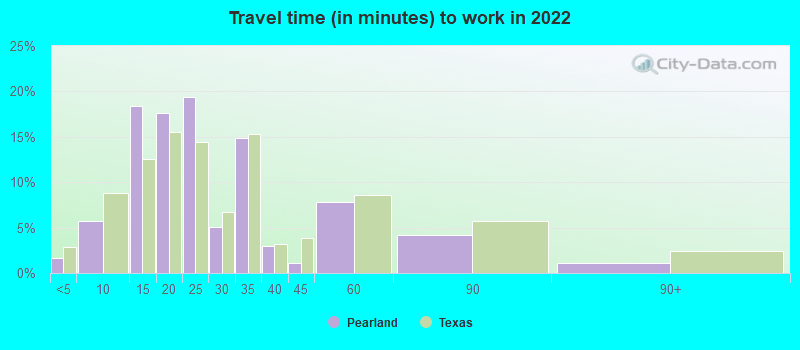
Travel time to work (commute)
Less than 5 minutes: 3775 to 9 minutes: 2,02410 to 14 minutes: 3,43515 to 19 minutes: 3,82420 to 24 minutes: 8,89925 to 29 minutes: 3,98930 to 34 minutes: 13,40635 to 39 minutes: 2,70740 to 44 minutes: 5,17145 to 59 minutes: 6,72860 to 89 minutes: 4,10990 or more minutes: 428
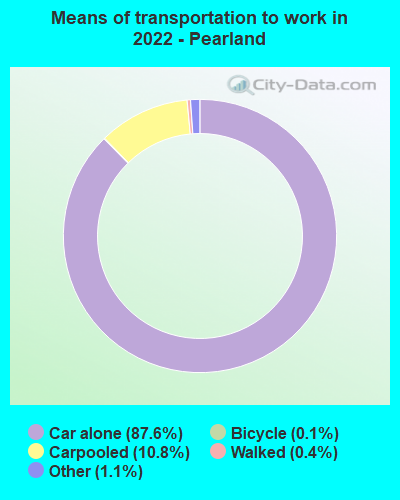
Means of transportation to work:
Drove a car alone: 26,777 (69.2%)Carpooled: 3,938 (10.2%)Bus : 14 (0.0%)Taxi: 434 (1.1%)Bicycle: 35 (0.1%)Walked: 75 (0.2%)Worked at home: 7,973 (20.6%)
Unemployment by race in 2022
Unemployment rate for White non-Hispanic residents 1.5% Males1.6% FemalesUnemployment rate for Black residents 8.0% Males1.9% FemalesUnemployment rate for Asian residents 5.7% Males2.5% FemalesUnemployment rate for other race residents 3.8% Males1.4% FemalesUnemployment rate for two or more race residents 1.2% Males1.0% FemalesUnemployment rate for Hispanic or Latino residents 4.2% Males0.4% Females
Year of entry for the foreign-born population in Pearland, Texas
6,753 2010 or later 7,644 2000 to 2009 4,750 1990 to 1999 710 1980 to 1989 697 1970 to 1979 425 Before 1970
First ancestries reported:
English: 4,156 (5.4%)
American: 3,413 (4.5%)
German: 2,814 (3.7%)
Irish: 2,675 (3.5%)
European: 809 (1.1%)
French: 639 (0.8%)
Italian: 635 (0.8%)
African: 553 (0.7%)
Scottish: 450 (0.6%)
Nigerian: 401 (0.5%)
Czech: 352 (0.5%)
Haitian: 330 (0.4%)
Dutch: 305 (0.4%)
Polish: 279 (0.4%)
British: 277 (0.4%)
Scotch-Irish: 264 (0.3%)
Austrian: 212 (0.3%)
Norwegian: 212 (0.3%)
Greek: 204 (0.3%)
French Canadian: 199 (0.3%)
Russian: 196 (0.3%)
Northern European: 149 (0.2%)
Hungarian: 128 (0.2%)
Palestinian: 115 (0.2%)
Brazilian: 104 (0.1%)
Eastern European: 91 (0.1%)
Arab: 74 (0.10%)
Jamaican: 66 (0.09%)
Portuguese: 64 (0.08%)
Lebanese: 61 (0.08%)
Swedish: 61 (0.08%)
Egyptian: 58 (0.08%)
Welsh: 56 (0.07%)
Maltese: 45 (0.06%)
Israeli: 40 (0.05%)
Cajun: 40 (0.05%)
Iranian: 38 (0.05%)
Czechoslovakian: 38 (0.05%)
Ukrainian: 37 (0.05%)
Latvian: 35 (0.05%)
Icelander: 34 (0.04%)
Scandinavian: 33 (0.04%)
Canadian: 33 (0.04%)
Lithuanian: 32 (0.04%)
Ethiopian: 32 (0.04%)
Croatian: 29 (0.04%)
Danish: 27 (0.04%)
Swiss: 24 (0.03%)
Barbadian: 21 (0.03%)
Trinidadian and Tobagonian: 16 (0.02%)
British West Indian: 8 (0.01%)
Most common places of birth for foreign-born residents (%): India Pearland:
19.2% (4,550)Texas:
6.1% (306,347)
Mexico Pearland:
16.8% (3,981)Texas:
48.4% (2,411,723)
Philippines Pearland:
13.7% (3,231)Texas:
2.1% (103,148)
Vietnam Pearland:
11.0% (2,596)Texas:
3.7% (184,770)
China, excluding Hong Kong and Taiwan Pearland:
5.0% (1,185)Texas:
2.3% (115,558)
Venezuela Pearland:
3.8% (898)Texas:
1.5% (72,413)
Pakistan Pearland:
3.2% (757)Texas:
1.2% (62,159)
Korea Pearland:
2.0% (476)Texas:
1.2% (60,172)
Honduras Pearland:
1.8% (435)Texas:
3.0% (147,182)
Cameroon Pearland:
1.7% (408)Texas:
0.3% (15,833)
Place of birth for U.S.-born residents:
This state: 75,192Other state: 25,753Northeast: 2,312Midwest: 6,410South: 10,995West: 6,036 88.5% of Pearland residents lived in the same house 1 years ago.
Out of people who lived in different houses, 23.7% lived in this county.
Out of people who lived in different counties, 78.2% lived in Texas.
Pearland:
88.5%State average:
85.7%
Education attainment for males 25 years and older:
No schooling: 875Nursery to 4th grade: 05th and 6th grade: 597th and 8th grade: 4209th grade: 10610th grade: 15911th grade: 5612th grade, no diploma: 522High school graduate (or equivalency): 9,810Less than 1 year of college: 1,505Some college more than 1 year, no degree: 6,604Associate degree: 3,731Bachelor's degree: 10,444Master's degree: 3,355Professional school degree: 1,070Doctorate degree: 890
Education attainment for females 25 years and older:
No schooling: 1,421Nursery to 4th grade: 1405th and 6th grade: 627th and 8th grade: 919th grade: 15610th grade: 8611th grade: 6812th grade, no diploma: 642High school graduate (or equivalency): 9,156Less than 1 year of college: 2,137Some college more than 1 year, no degree: 5,789Associate degree: 2,389Bachelor's degree: 14,226Master's degree: 4,641Professional school degree: 1,638Doctorate degree: 1,060
Housing units in structures:
One, detached: 35,419One, attached: 1,382Two: 4363 or 4: 4035 to 9: 44610 to 19: 2,82020 to 49: 1,09750 or more: 1,304Mobile homes: 1,382Boats, RVs, vans, etc.: 453Median worth of mobile homes: $70,100
Housing units lacking complete plumbing facilities in 2022: 0.6%Housing units lacking complete kitchen facilities in 2022: 0.8%House/condo owner moved in on average 9 years ago
Renter moved in on average 0 years ago
Private vs. public school enrollment:
Students in private schools in grades 1 to 8 (elementary and middle school): 934 Students in private schools in grades 9 to 12 (high school): 733 Students in private undergraduate colleges: 845