Pekin, IL (Illinois) Houses and Residents
| Pekin: | $113,763 |
| Illinois: | $251,600 |
Total population: 33,824 (Urban population: 33,650, Rural population: 190 (all nonfarm))
Houses: 14,999 (13,600 occupied: 9,020 owner occupied, 4,738 renter occupied)
| % of renters here: | 34% |
| State: | 33% |
Housing density: 1,141 houses/condos per square mile
Median price asked for vacant for-sale houses and condos in 2022: $99,206.
Median contract rent in 2022: $622 (lower quartile is $489, upper quartile is $795)
Median rent asked for vacant for-rent units in 2022: $885
Median gross rent in Pekin, IL in 2022: $757
Housing units in Pekin with a mortgage: 5,862 (478 second mortgage, 61 home equity loan, 398 both second mortgage and home equity loan)
Houses without a mortgage: 150
Median household income for houses/condos with a mortgage: $70,265
Median household income for apartments without a mortgage: $60,983
Median monthly housing costs: $865
Compare current foreclosures in Pekin, IL:
| Photo | Address | Area | Beds / Baths | Price | Details |
|---|---|---|---|---|---|

|
#1
Herman St
Pekin, IL 61554
|
915 sq. feet
|
1 baths 2 beds |
$135,000
|
show details |

|
#2
2nd St
Pekin, IL 61554
|
1,058 sq. feet
|
1 baths 3 beds |
$127,000
|
show details |

|
#3
State St
Pekin, IL 61554
|
1,652 sq. feet
|
1 baths 6 beds |
$29,900
|
show details |

|
#4
Illinois St
Pekin, IL 61554
|
1,008 sq. feet
|
1 baths 2 beds |
show details | |

|
#5
Royal Ave
Pekin, IL 61554
|
1,324 sq. feet
|
1 baths 3 beds |
show details | |

|
#6
Franklin St
Pekin, IL 61554
|
1,254 sq. feet
|
2 baths 3 beds |
show details | |

|
#7
N 18th St
Pekin, IL 61554
|
1,548 sq. feet
|
1 baths 3 beds |
show details | |

|
#8
S 7th St
Pekin, IL 61554
|
2,040 sq. feet
|
3 baths 3 beds |
show details | |

|
#9
Illinois St
Pekin, IL 61554
|
840 sq. feet
|
1 baths 2 beds |
show details | |

|
#10
Parkfield Dr
Pekin, IL 61554
|
2,123 sq. feet
|
2 baths 3 beds |
show details |
| Photo | Address | Area | Beds / Baths | Price | Details |
|---|---|---|---|---|---|

|
#11
Kaskaskia Rd
Pekin, IL 61554
|
2,292 sq. feet
|
2 baths 3 beds |
show details | |

|
#12
Cypress St
Pekin, IL 61554
|
1,008 sq. feet
|
1 baths 3 beds |
show details | |

|
#13
Douglas Rd
Pekin, IL 61554
|
974 sq. feet
|
1 baths 2 beds |
show details | |

|
#14
Summer St
Pekin, IL 61554
|
876 sq. feet
|
1 baths 2 beds |
show details | |

|
#15
Parkway Ln
Pekin, IL 61554
|
1,066 sq. feet
|
2 baths 3 beds |
show details | |

|
#16
Radisson Rd
Pekin, IL 61554
|
1,528 sq. feet
|
1 baths 3 beds |
show details | |

|
#17
Cypress St
Pekin, IL 61554
|
1,040 sq. feet
|
2 baths 3 beds |
show details | |

|
#18
Grand View Ave
Pekin, IL 61554
|
1,256 sq. feet
|
2 baths 3 beds |
show details | |

|
#19
Memory Ln
Pekin, IL 61554
|
1,200 sq. feet
|
1 baths 3 beds |
show details | |

|
#20
Fenley Ave
Pekin, IL 61554
|
944 sq. feet
|
1 baths 3 beds |
show details |
| Photo | Address | Area | Beds / Baths | Price | Details |
|---|---|---|---|---|---|

|
#21
Hillyer St
Pekin, IL 61554
|
726 sq. feet
|
3 baths 4 beds |
show details | |

|
#22
Catherine St
Pekin, IL 61554
|
1,076 sq. feet
|
1 baths 3 beds |
show details | |

|
#23
Charlotte St
Pekin, IL 61554
|
1,384 sq. feet
|
1 baths 3 beds |
show details | |

|
#24
Jefferson St
Pekin, IL 61554
|
1,064 sq. feet
|
2 baths 3 beds |
show details | |

|
#25
Charlotte St
Pekin, IL 61554
|
1,382 sq. feet
|
2 baths 3 beds |
show details | |

|
#26
Highwood Ave
Pekin, IL 61554
|
2,055 sq. feet
|
2 baths 3 beds |
show details | |

|
#27
N Capitol St
Pekin, IL 61554
|
814 sq. feet
|
1 baths 2 beds |
show details | |

|
#28
Hilltop Dr
Pekin, IL 61554
|
1,422 sq. feet
|
1 baths 3 beds |
show details | |

|
#29
Sierra Ct
Pekin, IL 61554
|
1,650 sq. feet
|
1 baths 3 beds |
show details | |

|
#30
Center St
Pekin, IL 61554
|
808 sq. feet
|
1 baths 3 beds |
show details |
| Photo | Address | Area | Beds / Baths | Price | Details |
|---|---|---|---|---|---|

|
#31
Valentine Ave
Pekin, IL 61554
|
1,850 sq. feet
|
1 baths 3 beds |
show details | |

|
#32
Willow St
Pekin, IL 61554
|
1,547 sq. feet
|
1 baths 3 beds |
show details | |

|
#33
Elm St
Pekin, IL 61554
|
1,280 sq. feet
|
2 baths 4 beds |
show details | |

|
#34
Alton St
Pekin, IL 61554
|
864 sq. feet
|
1 baths 3 beds |
show details | |

|
#35
Rainbow Dr
Pekin, IL 61554
|
1,014 sq. feet
|
1 baths 3 beds |
show details | |

|
#36
Rosenberg Ct
Pekin, IL 61554
|
1,180 sq. feet
|
1 baths 3 beds |
show details | |

|
#37
Partridge Rd
Pekin, IL 61554
|
1,092 sq. feet
|
1 baths 3 beds |
show details | |

|
#38
State St
Pekin, IL 61554
|
1,280 sq. feet
|
2 baths 4 beds |
show details | |

|
#39
Fisher St
Pekin, IL 61554
|
936 sq. feet
|
1 baths 1 beds |
show details | |

|
#40
N 16th St
Pekin, IL 61554
|
- sq. feet
|
- baths - beds |
show details |
| Photo | Address | Area | Beds / Baths | Price | Details |
|---|---|---|---|---|---|

|
#41
S 12th St
Pekin, IL 61554
|
- sq. feet
|
- baths - beds |
show details | |

|
#42
Henrietta St
Pekin, IL 61554
|
- sq. feet
|
- baths - beds |
show details | |

|
#43
N 11th St
Pekin, IL 61554
|
- sq. feet
|
- baths - beds |
show details | |

|
#44
Buena Vista Ave Apt 16
Pekin, IL 61554
|
- sq. feet
|
- baths - beds |
show details | |

|
#45
S 5th St
Pekin, IL 61554
|
- sq. feet
|
- baths - beds |
show details | |

|
#46
N 2nd St
Pekin, IL 61554
|
- sq. feet
|
- baths - beds |
show details | |

|
#47
N 8th St
Pekin, IL 61554
|
- sq. feet
|
- baths - beds |
show details | |

|
#48
Caroline St
Pekin, IL 61554
|
- sq. feet
|
- baths - beds |
show details | |

|
#49
N 4th St
Pekin, IL 61554
|
- sq. feet
|
- baths - beds |
show details | |

|
Check over 1 million property listings on Foreclosure.com!
|
browse all offers | |||

Latest news about housing in Pekin, IL collected exclusively by city-data.com from local newspapers, TV, and radio stations

 | Relocating to pekin il - need housing help (rentals!) (1 reply) |
| Trouble finding rental homes in Peoria Area (4 replies) |
| GLBT in Pekin, IL (6 replies) |
| Potential Relocation - Job in Pekin - Where to Rent/Peoria Pekin Area? (3 replies) |
| When did Rogers Park decline as a neighborhood? (69 replies) |
| Moving to Peoria for Caterpillar, where to rent? (15 replies) |
Median year apartment built: 1974
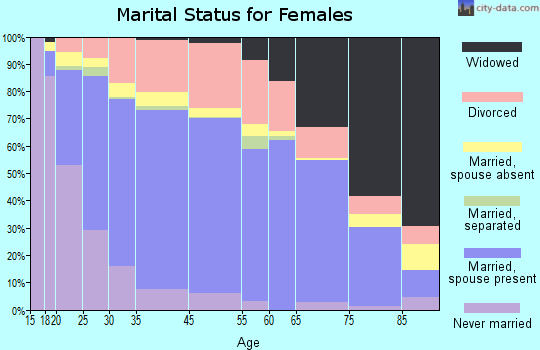
Household type by relationship:
Households: 31,741- Male householders: 6,545 (2,364 living alone), Female householders: 6,888 (2,806 living alone)
5,066 spouses (4,955 opposite-sex spouses), 1,224 unmarried partners, (1,129 opposite-sex unmarried partners), 7,748 children (6,948 natural, 270 adopted, 529 stepchildren), 594 grandchildren, 250 brothers or sisters, 367 parents, 11 foster children, 335 other relatives, 1,097 non-relatives
- In group quarters: 1,611
Size of family households: 3,795 2-persons, 1,512 3-persons, 1,321 4-persons, 379 5-persons, 299 6-persons, 131 7-or-more-persons.
Size of nonfamily households: 4,975 1-person, 854 2-persons, 361 3-persons, 50 4-persons, 68 5-persons, 6 6-persons.
3,440 married couples with children.
1,924 single-parent households (722 men, 1,202 women).
96.6% of residents of Pekin speak English at home.
1.6% of residents speak Spanish at home (69% speak English very well, 21% speak English well, 10% speak English not well).
0.7% of residents speak other Indo-European language at home (90% speak English very well, 10% don't speak English at all).
0.4% of residents speak Asian or Pacific Island language at home (91% speak English very well, 9% speak English well).
0.3% of residents speak other language at home (100% speak English very well).
Foreign born population: 539 (1.7%)
(20.4% of them are naturalized citizens)
| Here: | 6.2 |
| State: | 6.4 |
| Here: | 4.1 |
| State: | 4.1 |
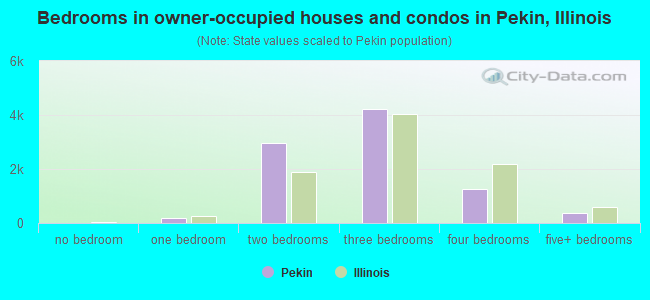
- Bedrooms in owner-occupied houses and condos in Pekin, Illinois
- 9no bedroom
- 1901 bedroom
- 2,9712 bedrooms
- 4,2213 bedrooms
- 1,2424 bedrooms
- 3885+ bedrooms
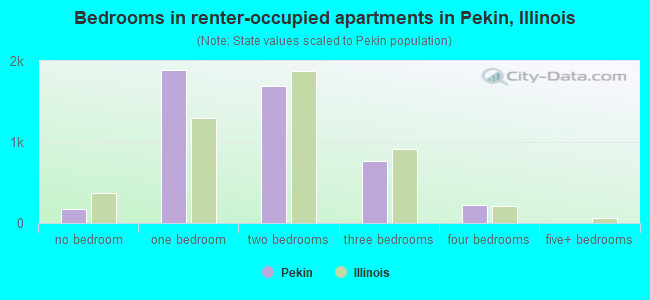
- Bedrooms in renter-occupied apartments in Pekin, Illinois
- 170no bedroom
- 1,8831 bedroom
- 1,6892 bedrooms
- 7683 bedrooms
- 2274 bedrooms
- 05+ bedrooms
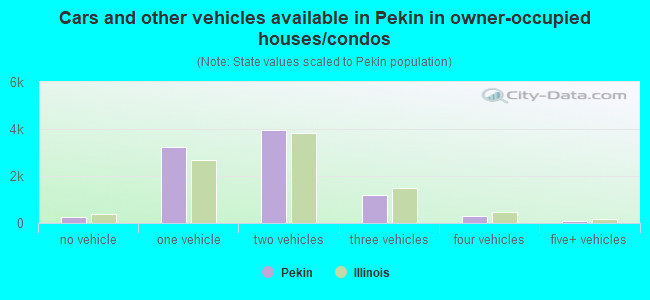
- Cars and other vehicles available in Pekin in owner-occupied houses/condos
- 235no vehicle
- 3,2381 vehicle
- 3,9562 vehicles
- 1,1873 vehicles
- 3194 vehicles
- 855+ vehicles
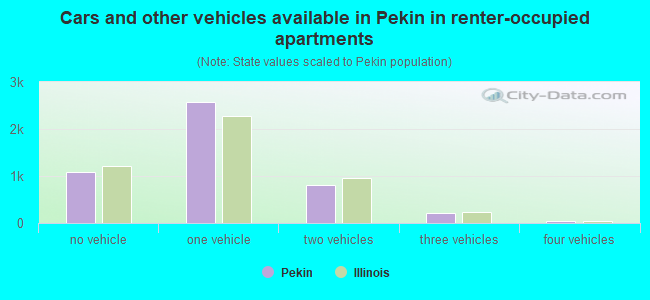
- Cars and other vehicles available in Pekin in renter-occupied apartments
- 1,082no vehicle
- 2,5781 vehicle
- 8122 vehicles
- 2203 vehicles
- 404 vehicles
- 65+ vehicles
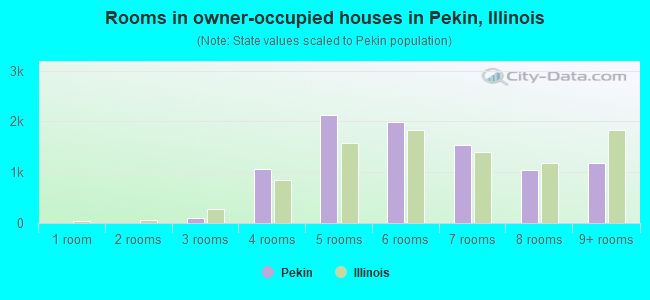
- Rooms in owner-occupied houses in Pekin, Illinois
- 91 room
- 02 rooms
- 973 rooms
- 1,0554 rooms
- 2,1265 rooms
- 1,9926 rooms
- 1,5337 rooms
- 1,0358 rooms
- 1,1739+ rooms
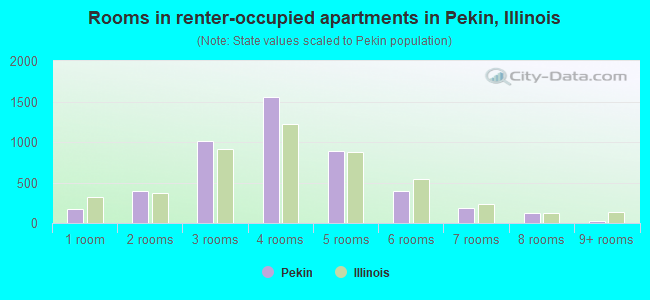
- Rooms in renter-occupied apartments in Pekin, Illinois
- 1701 room
- 3922 rooms
- 1,0153 rooms
- 1,5544 rooms
- 8875 rooms
- 3936 rooms
- 1877 rooms
- 1218 rooms
- 199+ rooms
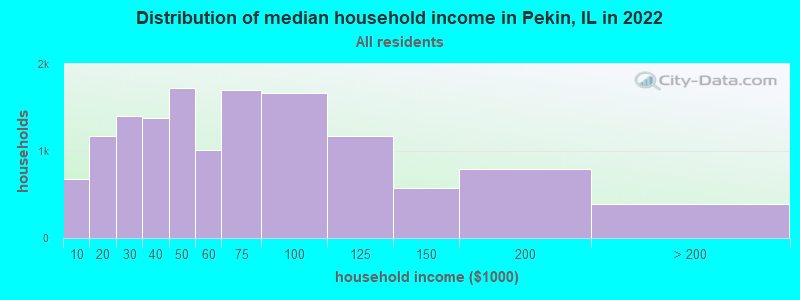
Pekin, IL household income distribution

- 679Less than $10,000
- 1,177$10,000 to $19,999
- 1,398$20,000 to $29,999
- 1,384$30,000 to $39,999
- 1,728$40,000 to $49,999
- 1,006$50,000 to $59,999
- 1,699$60,000 to $74,999
- 1,663$75,000 to $99,999
- 1,167$100,000 to $124,999
- 571$125,000 to $149,999
- 789$150,000 to $199,999
- 393$200,000 or more
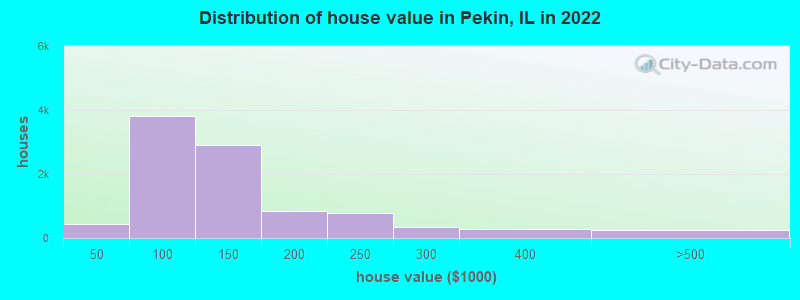
Home value of owner - occupied houses in 2022 in Pekin, IL
-
- 92Less than $10,000
- 82$10,000 to $14,999
- 10$15,000 to $19,999
- 29$20,000 to $24,999
- 4$25,000 to $29,999
- 11$30,000 to $34,999
- 12$35,000 to $39,999
- 202$40,000 to $49,999
- 138$50,000 to $59,999
- 447$60,000 to $69,999
- 741$70,000 to $79,999
- 1,113$80,000 to $89,999
- 1,175$90,000 to $99,999
- 1,765$100,000 to $124,999
- 1,151$125,000 to $149,999
- 580$150,000 to $174,999
- 248$175,000 to $199,999
- 786$200,000 to $249,999
- 345$250,000 to $299,999
- 282$300,000 to $399,999
- 174$400,000 to $499,999
- 48$500,000 to $749,999
- 2$750,000 to $999,999
- 8$1,000,000 to $1,499,999
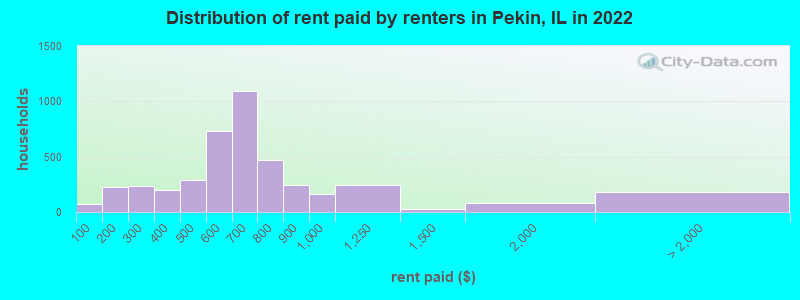
Rent paid by renters in 2022 in Pekin, IL
-
- 68Less than $100
- 148$100 to $149
- 77$150 to $199
- 141$200 to $249
- 91$250 to $299
- 105$300 to $349
- 90$350 to $399
- 187$400 to $449
- 103$450 to $499
- 549$500 to $549
- 181$550 to $599
- 641$600 to $649
- 447$650 to $699
- 320$700 to $749
- 148$750 to $799
- 246$800 to $899
- 164$900 to $999
- 241$1,000 to $1,249
- 26$1,250 to $1,499
- 81$1,500 to $1,999
- 48$2,500 to $2,999
- 23$3,000 to $3,499
- 110No cash rent
Percentage of workers working in this county: 62.4%
Number of people working at home: 1,154 (8.2% of all workers)
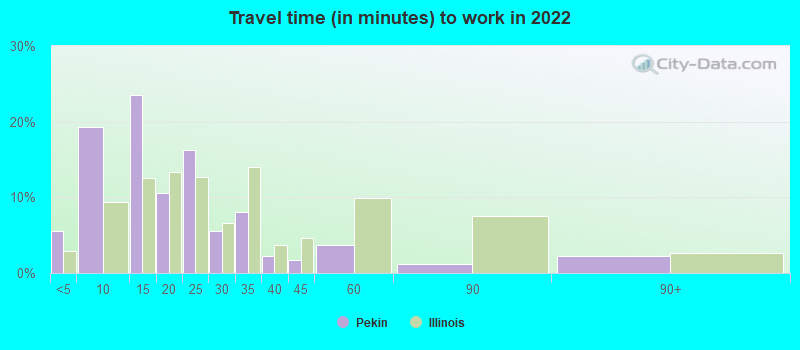
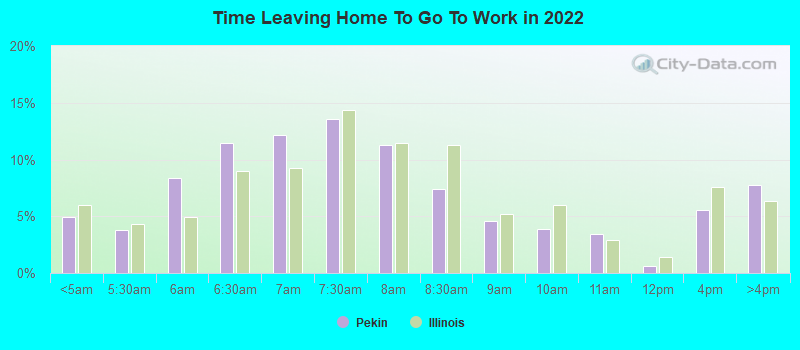
Travel time to work (commute)
- Less than 5 minutes: 476
- 5 to 9 minutes: 2,117
- 10 to 14 minutes: 2,439
- 15 to 19 minutes: 1,150
- 20 to 24 minutes: 1,780
- 25 to 29 minutes: 1,435
- 30 to 34 minutes: 1,941
- 35 to 39 minutes: 288
- 40 to 44 minutes: 167
- 45 to 59 minutes: 719
- 60 to 89 minutes: 200
- 90 or more minutes: 298
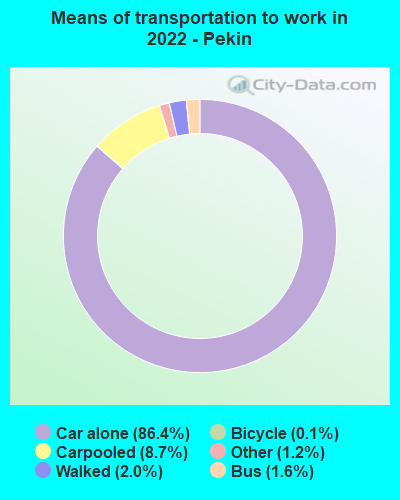
Means of transportation to work:
- Drove a car alone: 9,771 (77.4%)
- Carpooled: 1,045 (8.3%)
- Bus: 170 (1.3%)
- Taxi: 155 (1.2%)
- Bicycle: 13 (0.1%)
- Walked: 232 (1.8%)
- Worked at home: 1,154 (9.1%)
- Unemployment by race in 2022
- Unemployment rate for White non-Hispanic residents
- 2.5%Males
- 8.3%Females
- Unemployment rate for Black residents
- 100.0%Females
- Unemployment rate for two or more race residents
- 7.3%Males
- 5.6%Females
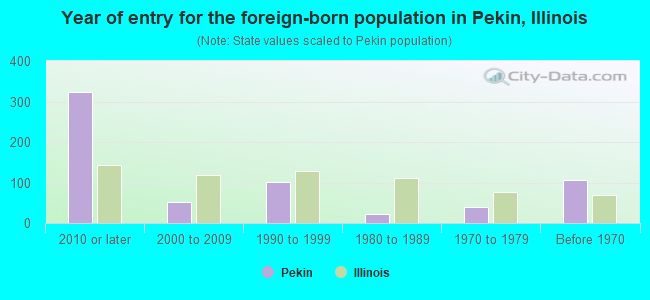
- Year of entry for the foreign-born population in Pekin, Illinois
- 3242010 or later
- 522000 to 2009
- 1011990 to 1999
- 231980 to 1989
- 401970 to 1979
- 107Before 1970
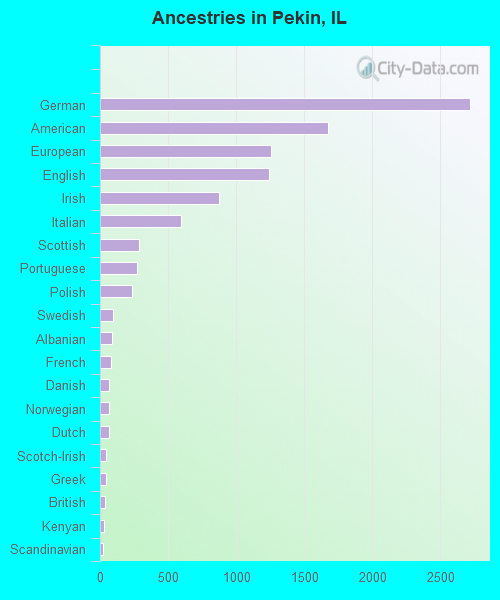
First ancestries reported:
- German: 2,722 (22.2%)
- American: 1,673 (13.6%)
- European: 1,257 (10.2%)
- English: 1,239 (10.1%)
- Irish: 872 (7.1%)
- Italian: 598 (4.9%)
- Scottish: 284 (2.3%)
- Portuguese: 272 (2.2%)
- Polish: 238 (1.9%)
- Swedish: 99 (0.8%)
- Albanian: 85 (0.7%)
- French: 80 (0.7%)
- Danish: 67 (0.5%)
- Norwegian: 66 (0.5%)
- Dutch: 64 (0.5%)
- Scotch-Irish: 45 (0.4%)
- Greek: 42 (0.3%)
- British: 34 (0.3%)
- Kenyan: 28 (0.2%)
- Scandinavian: 25 (0.2%)
- Ukrainian: 23 (0.2%)
- Hungarian: 22 (0.2%)
- Northern European: 19 (0.2%)
- Czech: 17 (0.1%)
- African: 15 (0.1%)
- Belgian: 14 (0.1%)
- Austrian: 13 (0.1%)
- French Canadian: 12 (0.10%)
- Slovene: 12 (0.10%)
- Welsh: 12 (0.10%)
- Croatian: 11 (0.09%)
- Eastern European: 9 (0.07%)
- Romanian: 6 (0.05%)
- Slovak: 6 (0.05%)
- Russian: 3 (0.02%)
Most common places of birth for foreign-born residents (%):
| Pekin: | 22.4% (120) |
| Illinois: | 34.7% (626,958) |
| Pekin: | 16.6% (89) |
| Illinois: | 0.4% (6,488) |
| Pekin: | 15.9% (85) |
| Illinois: | 5.2% (93,003) |
| Pekin: | 11.0% (59) |
| Illinois: | 0.9% (16,553) |
| Pekin: | 7.3% (39) |
| Illinois: | 9.2% (166,409) |
| Pekin: | 6.0% (32) |
| Illinois: | 0.1% (2,357) |
| Pekin: | 4.7% (25) |
| Illinois: | 0.0% (68) |
| Pekin: | 4.5% (24) |
| Illinois: | 1.6% (29,316) |
| Pekin: | 3.7% (20) |
| Illinois: | 1.1% (19,306) |
| Pekin: | 2.8% (15) |
| Illinois: | 0.6% (10,943) |
| Pekin: | 2.1% (11) |
| Illinois: | 1.0% (18,753) |
| Pekin: | 1.7% (9) |
| Illinois: | 0.9% (16,308) |
Place of birth for U.S.-born residents:
- This state: 25,338
- Other state: 5,713
- Northeast: 399
- Midwest: 2,930
- South: 1,845
- West: 563
84.9% of Pekin residents lived in the same house 1 years ago.
Out of people who lived in different houses, 34.1% lived in this county.
Out of people who lived in different counties, 59.9% lived in Illinois.
| Pekin: | 84.9% |
| State average: | 88.3% |
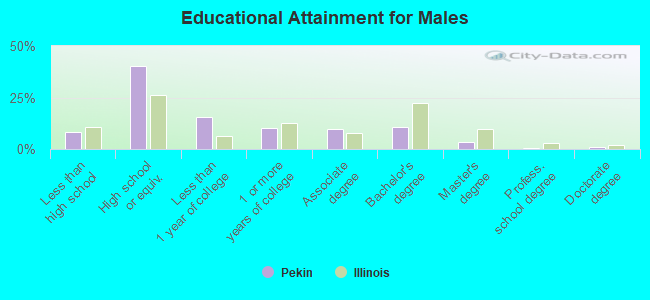
Education attainment for males 25 years and older:
- No schooling: 66
- Nursery to 4th grade: 0
- 5th and 6th grade: 8
- 7th and 8th grade: 73
- 9th grade: 126
- 10th grade: 173
- 11th grade: 268
- 12th grade, no diploma: 190
- High school graduate (or equivalency): 4,395
- Less than 1 year of college: 1,716
- Some college more than 1 year, no degree: 1,101
- Associate degree: 1,087
- Bachelor's degree: 1,191
- Master's degree: 388
- Professional school degree: 75
- Doctorate degree: 94
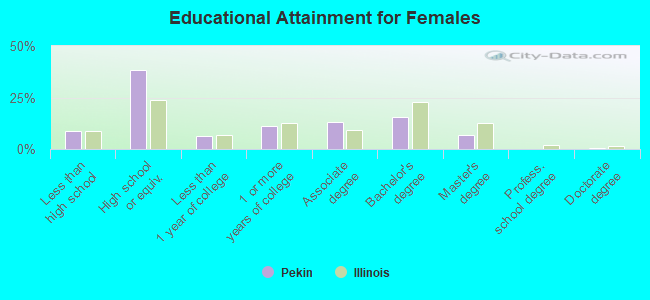
Education attainment for females 25 years and older:
- No schooling: 66
- Nursery to 4th grade: 15
- 5th and 6th grade: 25
- 7th and 8th grade: 278
- 9th grade: 173
- 10th grade: 179
- 11th grade: 126
- 12th grade, no diploma: 189
- High school graduate (or equivalency): 4,525
- Less than 1 year of college: 740
- Some college more than 1 year, no degree: 1,305
- Associate degree: 1,549
- Bachelor's degree: 1,828
- Master's degree: 793
- Professional school degree: 12
- Doctorate degree: 44
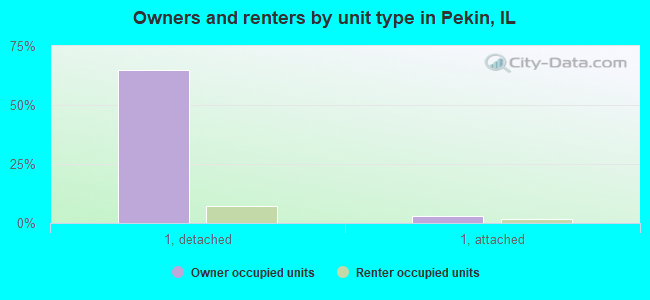
Housing units in structures:
- One, detached: 10,497
- One, attached: 591
- Two: 553
- 3 or 4: 905
- 5 to 9: 1,069
- 10 to 19: 540
- 20 to 49: 185
- 50 or more: 627
- Mobile homes: 30
Housing units lacking complete kitchen facilities in 2022: 3.6%
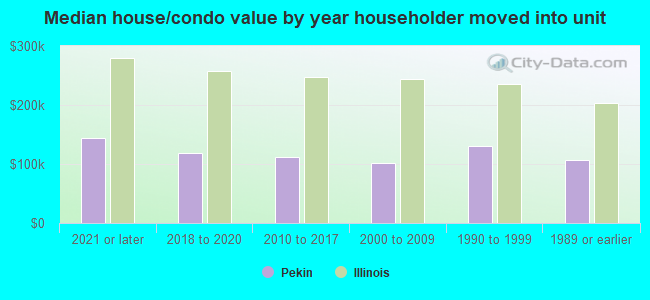
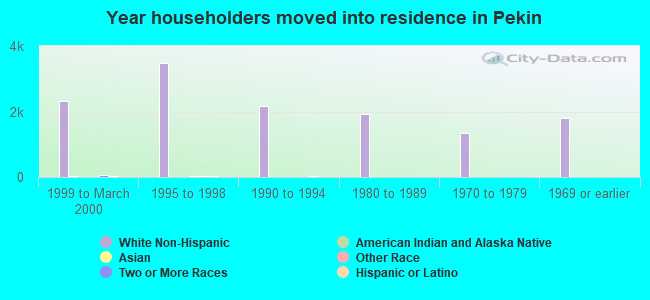
House/condo owner moved in on average 10 years ago
Renter moved in on average 2 years ago
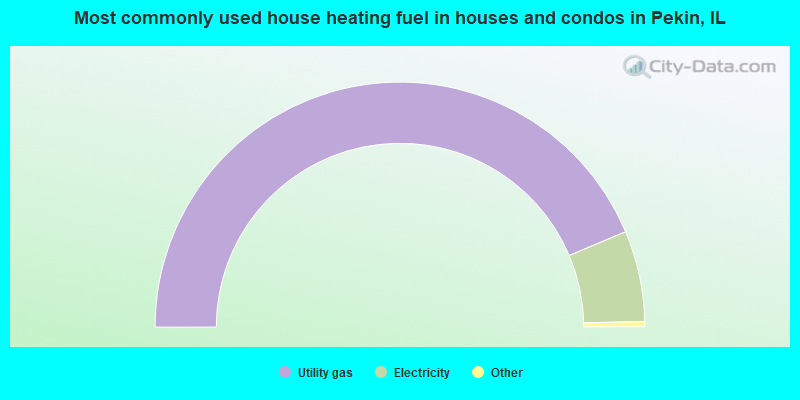
- 87.3%Utility gas
- 12.0%Electricity
- 0.2%Bottled, tank, or LP gas
- 0.2%No fuel used
- 0.2%Other fuel
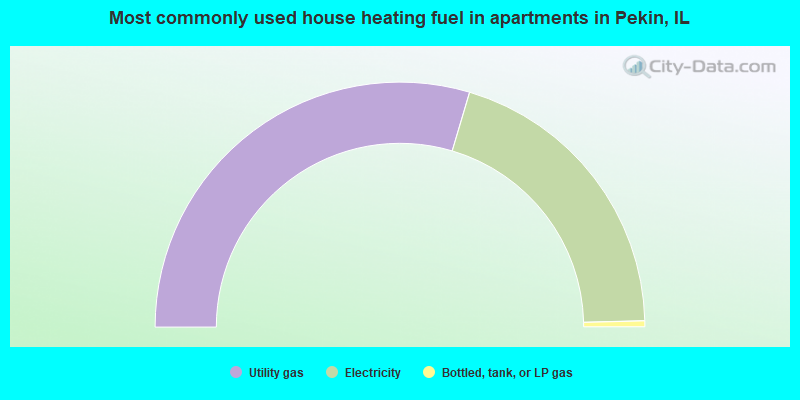
- 59.2%Utility gas
- 40.0%Electricity
- 0.8%Bottled, tank, or LP gas
Private vs. public school enrollment:
| Here: | 7.3% |
| Illinois: | 13.3% |
| Here: | 6.1% |
| Illinois: | 9.9% |
| Here: | 6.4% |
| Illinois: | 27.4% |