Housing density: 365 houses/condos per square mile
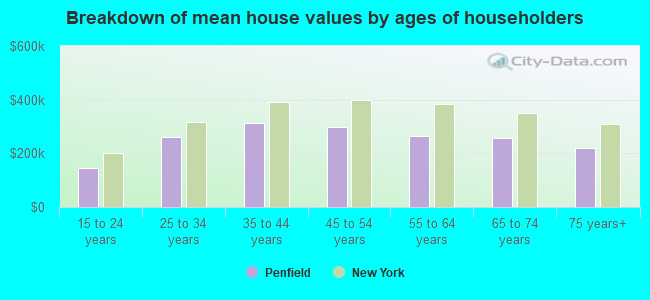
Median price asked for vacant for-sale houses and condos in 2022 in this county: $131,871.
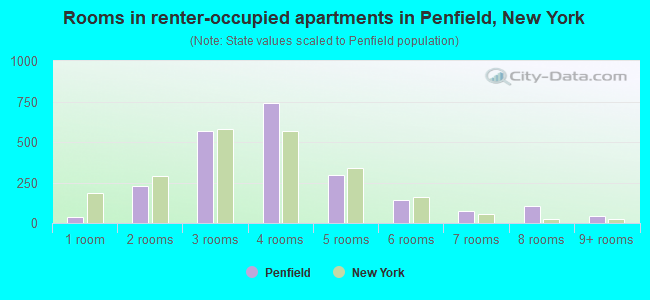
Median contract rent in 2022: $1,137 (lower quartile is $836, upper quartile is $1,401)
Median rent asked for vacant for-rent units in 2022: $986
Median gross rent in Penfield, NY in 2022: $1,237
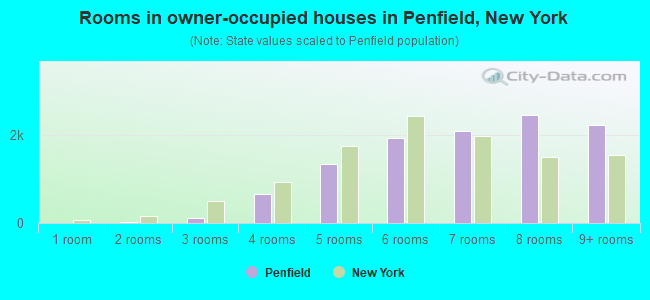
Housing units in Penfield with a mortgage: 7,396 (580 second mortgage, 1,340 home equity loan, 24 both second mortgage and home equity loan) Houses without a mortgage: 2,354
In family households: 570,195 (118,793 male householders, 65,460 female householders)
129,638 spouses, 208,825 children (196,800 natural, 4,967 adopted, 7,058 stepchildren), 12,314 grandchildren, 5,890 brothers or sisters, 5,273 parents, foster children, 6,253 other relatives, 14,824 non-relatives
In nonfamily households: 147,866 (53,529 male householders (39,699 living alone)), 62,640 female householders (51,939 living alone)), 31,697 nonrelatives
In group quarters: 26,283 (7,361 institutionalized population)
118,130 married couples with children.
54,341 single-parent households (8,323 men, 46,018 women).
89.5% of residents of Penfield speak English at home.
1.1% of residents speak Spanish at home (59% speak English very well, 26% speak English well, 15% speak English not well).
7.3% of residents speak other Indo-European language at home (63% speak English very well, 21% speak English well, 15% speak English not well, 1% don't speak English at all).
1.7% of residents speak Asian or Pacific Island language at home (69% speak English very well, 27% speak English well, 3% speak English not well, 2% don't speak English at all).
0.3% of residents speak other language at home (76% speak English very well, 24% speak English well).
Foreign born population: 3,160 (8.9%)
(63.6% of them are naturalized citizens)
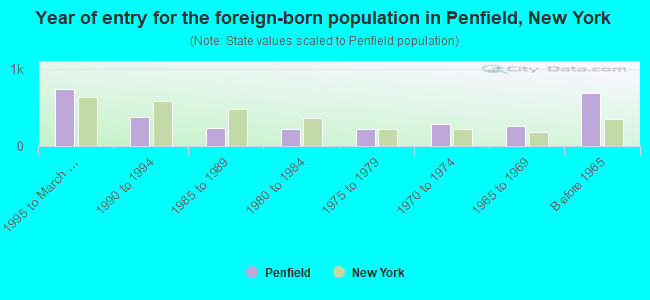
Year of entry for the foreign-born population in Penfield, New York
7401995 to March 2000
3751990 to 1994
2381985 to 1989
2201980 to 1984
2281975 to 1979
2921970 to 1974
2601965 to 1969
690Before 1965
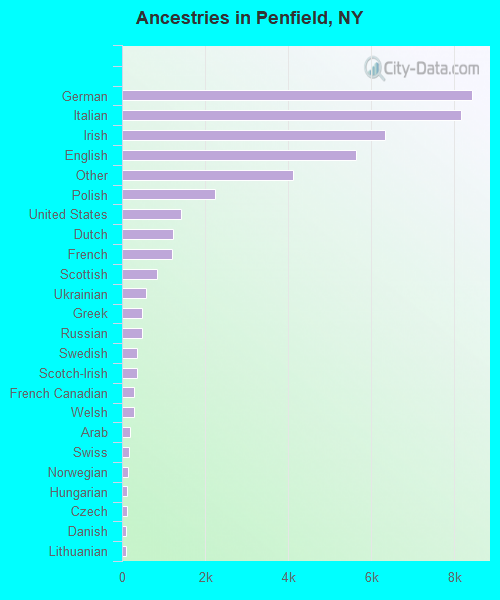
First ancestries reported:
German: 8,410 (19.3%)
Italian: 8,149 (18.7%)
Irish: 6,332 (14.5%)
English: 5,623 (12.9%)
Other: 4,106 (9.4%)
Polish: 2,249 (5.2%)
United States: 1,427 (3.3%)
Dutch: 1,235 (2.8%)
French: 1,208 (2.8%)
Scottish: 836 (1.9%)
Ukrainian: 567 (1.3%)
Greek: 492 (1.1%)
Russian: 477 (1.1%)
Swedish: 369 (0.8%)
Scotch-Irish: 350 (0.8%)
French Canadian: 299 (0.7%)
Welsh: 277 (0.6%)
Arab: 182 (0.4%)
Swiss: 180 (0.4%)
Norwegian: 155 (0.4%)
Hungarian: 130 (0.3%)
Czech: 128 (0.3%)
Danish: 101 (0.2%)
Lithuanian: 93 (0.2%)
Portuguese: 73 (0.2%)
Slovak: 73 (0.2%)
West Indian: 73 (0.2%)
Subsaharan African: 25 (0.06%)
Most common places of birth for foreign-born residents (%):
Italy
Penfield:
12.6% (382)
New York:
3.8% (147,729)
India
Penfield:
7.6% (231)
New York:
3.0% (117,238)
Ukraine
Penfield:
7.5% (229)
New York:
2.1% (82,238)
United Kingdom
Penfield:
7.2% (219)
New York:
1.6% (62,237)
Canada
Penfield:
6.6% (200)
New York:
1.4% (54,876)
Greece
Penfield:
6.3% (193)
New York:
1.1% (42,335)
China, excluding Hong Kong and Taiwan
Penfield:
5.1% (155)
New York:
6.0% (233,766)
Germany
Penfield:
4.5% (136)
New York:
1.8% (69,327)
Taiwan
Penfield:
3.9% (119)
New York:
0.8% (30,473)
Bosnia and Herzegovina
Penfield:
3.5% (106)
New York:
0.2% (7,433)
Other Eastern Europe
Penfield:
3.1% (94)
New York:
1.4% (53,825)
Russia
Penfield:
2.9% (88)
New York:
2.4% (94,595)
Korea
Penfield:
2.8% (86)
New York:
2.5% (97,933)
Mexico
Penfield:
2.8% (84)
New York:
4.2% (161,189)
Poland
Penfield:
1.8% (56)
New York:
2.4% (93,187)
Other South Central Asia
Penfield:
1.7% (52)
New York:
0.6% (23,797)
Place of birth for U.S.-born residents:
This state: 25,581
Other state: 5,813
Northeast: 2,367
Midwest: 1,801
South: 1,128
West: 517
64% of Penfield residents lived in the same house 5 years ago. Out of people who lived in different houses, 72% lived in this county. Out of people who lived in different counties, 52% lived in New York.
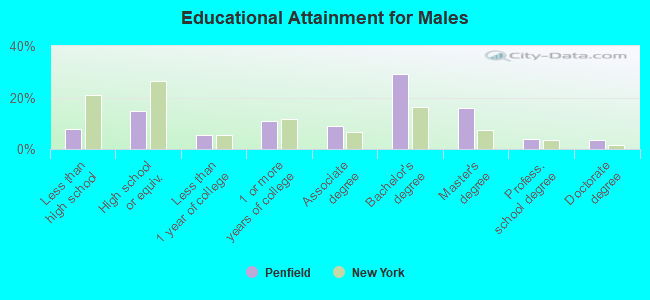
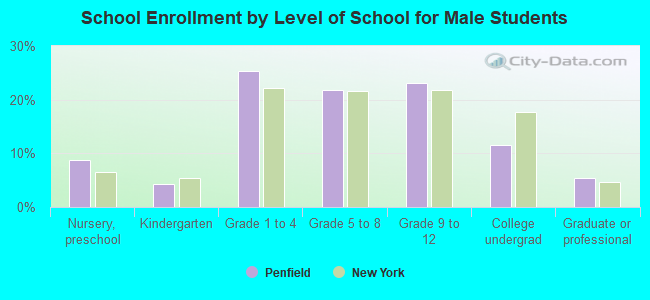
Education attainment for males 25 years and older:
No schooling: 64
Nursery to 4th grade: 6
5th and 6th grade: 13
7th and 8th grade: 165
9th grade: 106
10th grade: 137
11th grade: 128
12th grade, no diploma: 264
High school graduate (or equivalency): 1,657
Less than 1 year of college: 604
Some college more than 1 year, no degree: 1,203
Associate degree: 1,005
Bachelor's degree: 3,285
Master's degree: 1,771
Professional school degree: 414
Doctorate degree: 397
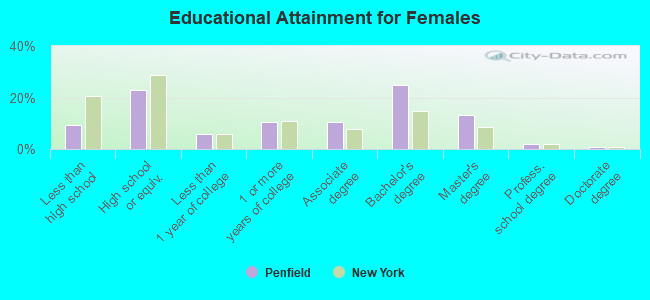
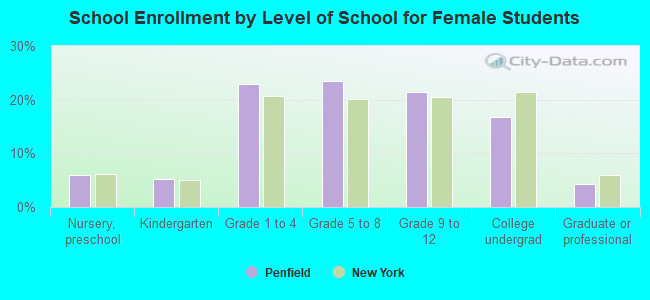
Education attainment for females 25 years and older:
No schooling: 74
Nursery to 4th grade: 28
5th and 6th grade: 50
7th and 8th grade: 349
9th grade: 98
10th grade: 250
11th grade: 95
12th grade, no diploma: 264
High school graduate (or equivalency): 2,928
Less than 1 year of college: 729
Some college more than 1 year, no degree: 1,355
Associate degree: 1,356
Bachelor's degree: 3,171
Master's degree: 1,701
Professional school degree: 247
Doctorate degree: 110
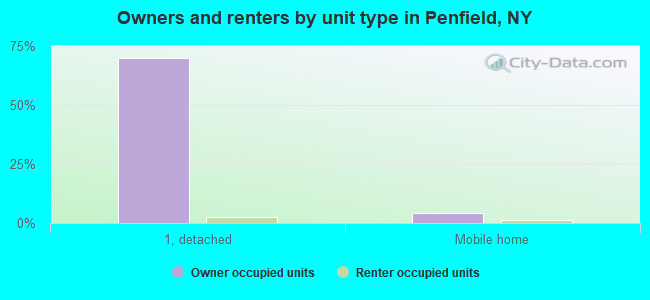
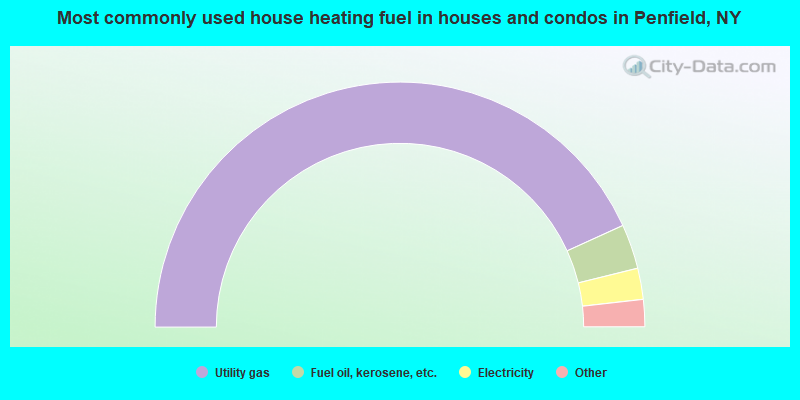
Housing units in structures:
One, detached: 9,669
One, attached: 1,079
Two: 182
3 or 4: 399
5 to 9: 978
10 to 19: 306
20 to 49: 169
50 or more: 69
Mobile homes: 822
Median worth of mobile homes: $29,089
Housing units lacking complete plumbing facilities: 0.2%
Housing units lacking complete kitchen facilities: 0.1%