Plymouth, MI (Michigan) Houses and Residents
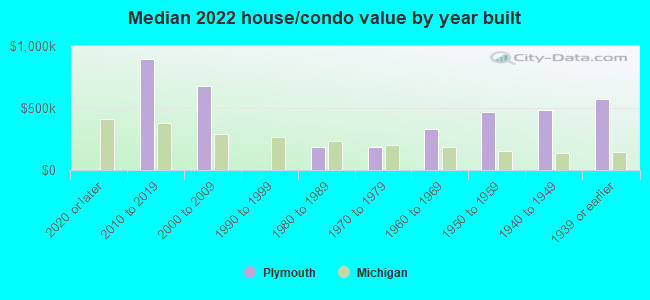
| Plymouth: | $451,910 |
| Michigan: | $224,400 |
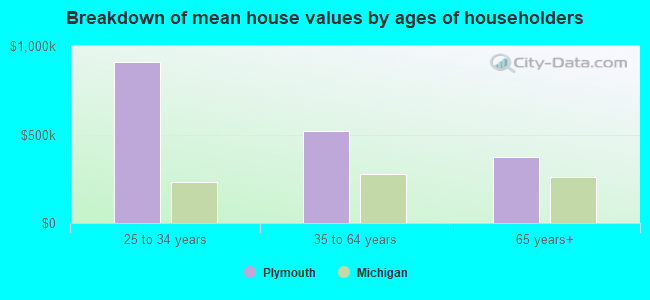
Mean price in 2022:
Detached houses: $340,568
Here: $340,568 State: $280,038 Townhouses or other attached units: $191,100
Here: $191,100 State: $239,520 In 3-to-4-unit structures: $122,735
Here: $122,735 State: $207,067 In 5-or-more-unit structures: $156,442
Here: $156,442 State: $192,733
Total population: 8,933 (All urban)
Houses: 4,386 (4,116 occupied: 2,760 owner occupied, 1,379 renter occupied)
| % of renters here: | 33% |
| State: | 27% |
Housing density: 1,968 houses/condos per square mile
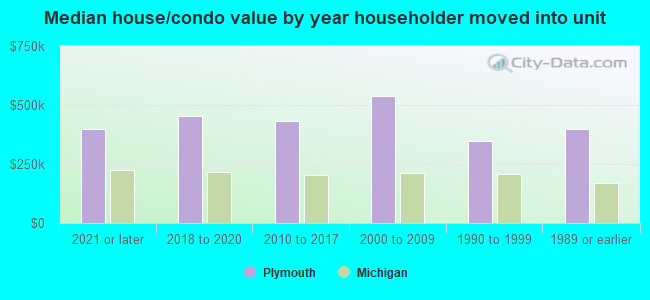
Median price asked for vacant for-sale houses and condos in 2022: $422,625.
Median contract rent in 2022: $944 (lower quartile is $810, upper quartile is $1,472)
Median rent asked for vacant for-rent units in 2022: $1,324
Median gross rent in Plymouth, MI in 2022: $1,049
Housing units in Plymouth with a mortgage: 1,919 (222 second mortgage, 0 home equity loan, 175 both second mortgage and home equity loan)
Houses without a mortgage: 80
Median household income for houses/condos with a mortgage: $144,122
Median household income for apartments without a mortgage: $121,369
Median monthly housing costs: $1,393
Compare current foreclosures near Plymouth, MI:
| Photo | Address | Area | Beds / Baths | Price | Details |
|---|---|---|---|---|---|

|
#1
Junction St
Plymouth, MI 48170
|
1,058 sq. feet
|
1 baths 2 beds |
show details | |

|
#2
Brookline Ave
Plymouth, MI 48170
|
744 sq. feet
|
1 baths - beds |
show details | |

|
#3
N Sheldon Rd
Plymouth, MI 48170
|
1,271 sq. feet
|
1 baths 3 beds |
show details | |

|
#4
N Holbrook St
Plymouth, MI 48170
|
1,596 sq. feet
|
1 baths 3 beds |
show details | |

|
#5
Warren Rd
Plymouth, MI 48170
|
2,599 sq. feet
|
2 baths 4 beds |
show details | |

|
#6
Brownell Ave
Plymouth, MI 48170
|
1,525 sq. feet
|
1 baths - beds |
show details | |

|
#7
Gregory Ln
Plymouth, MI 48170
|
1,680 sq. feet
|
2 baths - beds |
show details | |

|
#8
Barrington Rd
Plymouth, MI 48170
|
2,534 sq. feet
|
3 baths - beds |
show details | |

|
#9
Brownell Ave
Plymouth, MI 48170
|
990 sq. feet
|
1 baths - beds |
show details | |

|
#10
Amherst Ct
Plymouth, MI 48170
|
2,278 sq. feet
|
2 baths - beds |
show details |
| Photo | Address | Area | Beds / Baths | Price | Details |
|---|---|---|---|---|---|

|
#11
Marc Trl
Plymouth, MI 48170
|
1,776 sq. feet
|
3 baths - beds |
show details | |

|
#12
Northern Ave
Plymouth, MI 48170
|
1,040 sq. feet
|
1 baths - beds |
show details | |

|
#13
S Mill St Apt 2
Plymouth, MI 48170
|
- sq. feet
|
- baths - beds |
show details | |

|
#14
Sunset St
Plymouth, MI 48170
|
- sq. feet
|
- baths - beds |
show details | |

|
#15
S Union St Apt 1a
Plymouth, MI 48170
|
- sq. feet
|
- baths - beds |
show details | |

|
#16
Grant Dr
Plymouth, MI 48170
|
- sq. feet
|
- baths - beds |
show details | |

|
#17
Plymouth Rd # 370
Plymouth, MI 48170
|
- sq. feet
|
- baths - beds |
show details | |

|
#18
Princeton Dr
Plymouth, MI 48170
|
- sq. feet
|
- baths - beds |
show details | |

|
#19
N Territorial Rd
Plymouth, MI 48170
|
- sq. feet
|
- baths - beds |
show details | |

|
#20
Roe St Apt 6
Plymouth, MI 48170
|
- sq. feet
|
- baths - beds |
show details |
| Photo | Address | Area | Beds / Baths | Price | Details |
|---|---|---|---|---|---|

|
#21
F Dr
Plymouth, MI 48170
|
- sq. feet
|
- baths - beds |
show details | |

|
#22
N Territorial Rd
Plymouth, MI 48170
|
- sq. feet
|
- baths - beds |
show details | |

|
#23
Northville Forest Dr
Plymouth, MI 48170
|
- sq. feet
|
- baths - beds |
show details | |

|
#24
Edgewood Cir
Plymouth, MI 48170
|
- sq. feet
|
- baths - beds |
show details | |

|
#25
N Lilley Rd
Plymouth, MI 48170
|
- sq. feet
|
- baths - beds |
show details | |

|
#26
Greenview Pl Apt 4
Plymouth, MI 48170
|
- sq. feet
|
- baths - beds |
show details | |

|
#27
S Dearborn St
Melvindale, MI 48122
|
912 sq. feet
|
1 baths 3 beds |
$124,000
|
show details |

|
#28
Valley Dr
Ypsilanti, MI 48197
|
1,300 sq. feet
|
1 baths 3 beds |
$325,000
|
show details |

|
#29
Edington St
Livonia, MI 48150
|
1,174 sq. feet
|
1 baths 3 beds |
$317,900
|
show details |

|
#30
E Rose Ave
Garden City, MI 48135
|
981 sq. feet
|
1 baths 3 beds |
$195,001
|
show details |
| Photo | Address | Area | Beds / Baths | Price | Details |
|---|---|---|---|---|---|

|
#31
Manhattan St
Oak Park, MI 48237
|
1,336 sq. feet
|
1 baths 3 beds |
$305,000
|
show details |

|
#32
Montrose St
Detroit, MI 48227
|
1,310 sq. feet
|
1 baths 3 beds |
$95,500
|
show details |

|
#33
Kentfield St
Detroit, MI 48219
|
1,913 sq. feet
|
2 baths 5 beds |
$83,600
|
show details |

|
#34
Blackstone St
Detroit, MI 48219
|
996 sq. feet
|
1 baths 3 beds |
$111,500
|
show details |

|
#35
Helen St
Garden City, MI 48135
|
960 sq. feet
|
1 baths 3 beds |
$199,900
|
show details |

|
#36
Desoto St
Detroit, MI 48238
|
1,500 sq. feet
|
1 baths 3 beds |
$71,250
|
show details |

|
#37
Roselawn St
Detroit, MI 48204
|
1,368 sq. feet
|
2 baths 4 beds |
$54,900
|
show details |

|
#38
Hartwell St
Detroit, MI 48227
|
1,135 sq. feet
|
1 baths 3 beds |
$10,000
|
show details |

|
#39
Hartwell St
Detroit, MI 48228
|
1,482 sq. feet
|
1 baths 3 beds |
$169,500
|
show details |

|
#40
Venoy Rd
Wayne, MI 48184
|
986 sq. feet
|
1 baths 3 beds |
$120,900
|
show details |
| Photo | Address | Area | Beds / Baths | Price | Details |
|---|---|---|---|---|---|

|
#41
Littlefield St
Detroit, MI 48235
|
908 sq. feet
|
1 baths 3 beds |
$30,200
|
show details |

|
#42
Pleasure St
Milford, MI 48381
|
1,182 sq. feet
|
1 baths 2 beds |
$268,500
|
show details |

|
#43
Warwick Ave
Allen Park, MI 48101
|
1,074 sq. feet
|
1 baths 3 beds |
$212,000
|
show details |

|
#44
N Kane St
Detroit, MI 48223
|
954 sq. feet
|
1 baths 3 beds |
$125,000
|
show details |

|
#45
Pointe Xing
Plymouth, MI 48170
|
- sq. feet
|
- baths - beds |
show details | |

|
#46
Greenview Ave
Detroit, MI 48228
|
- sq. feet
|
1 baths 1 beds |
$16,600
|
show details |

|
#47
Colbert St
Romulus, MI 48174
|
960 sq. feet
|
1 baths 3 beds |
show details | |

|
#48
Brazil Ave
Southfield, MI 48033
|
2,211 sq. feet
|
2 baths 4 beds |
show details | |

|
#49
Paris St
Allen Park, MI 48101
|
1,014 sq. feet
|
1 baths 3 beds |
show details | |

|
Check over 1 million property listings on Foreclosure.com!
|
browse all offers | |||

Latest news about housing in Plymouth, MI collected exclusively by city-data.com from local newspapers, TV, and radio stations


Median year apartment built: 1966
Household type by relationship:
Households: 9,171- Male householders: 1,969 (662 living alone), Female householders: 2,096 (912 living alone)
1,744 spouses (1,692 opposite-sex spouses), 148 unmarried partners, (140 opposite-sex unmarried partners), 2,626 children (2,401 natural, 136 adopted, 88 stepchildren), 59 grandchildren, 34 brothers or sisters, 25 parents, 0 foster children, 48 other relatives, 178 non-relatives
- In group quarters: 239
Size of family households: 1,049 2-persons, 493 3-persons, 630 4-persons, 55 5-persons, 48 6-persons.
Size of nonfamily households: 1,631 1-person, 239 2-persons.
1,559 married couples with children.
415 single-parent households (195 men, 220 women).
94.3% of residents of Plymouth speak English at home.
2.6% of residents speak Spanish at home (100% speak English very well).
1.8% of residents speak other Indo-European language at home (77% speak English very well, 16% speak English well, 7% speak English not well).
1.0% of residents speak Asian or Pacific Island language at home (52% speak English very well, 48% speak English well).
0.1% of residents speak other language at home (33% speak English very well, 67% speak English not well).
Foreign born population: 419 (4.6%)
(43.7% of them are naturalized citizens)
| Here: | 6.6 |
| State: | 6.5 |
| Here: | 3.6 |
| State: | 4.3 |
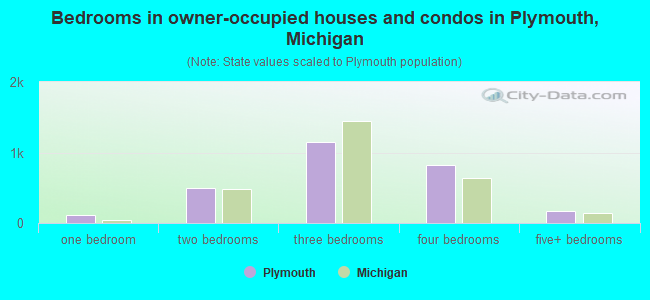
- Bedrooms in owner-occupied houses and condos in Plymouth, Michigan
- 0no bedroom
- 1111 bedroom
- 4992 bedrooms
- 1,1543 bedrooms
- 8204 bedrooms
- 1765+ bedrooms
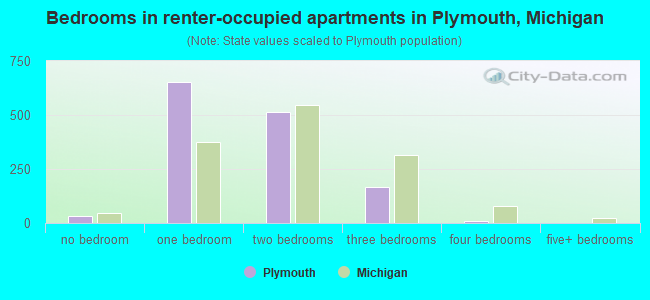
- Bedrooms in renter-occupied apartments in Plymouth, Michigan
- 32no bedroom
- 6551 bedroom
- 5162 bedrooms
- 1683 bedrooms
- 94 bedrooms
- 05+ bedrooms
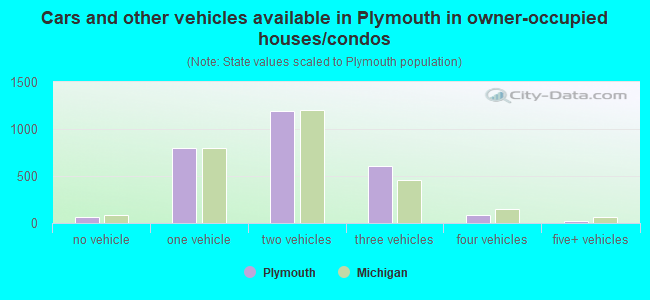
- Cars and other vehicles available in Plymouth in owner-occupied houses/condos
- 68no vehicle
- 7941 vehicle
- 1,1902 vehicles
- 6043 vehicles
- 824 vehicles
- 225+ vehicles
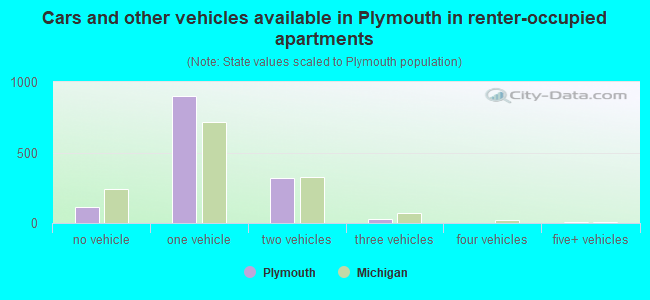
- Cars and other vehicles available in Plymouth in renter-occupied apartments
- 115no vehicle
- 9041 vehicle
- 3192 vehicles
- 313 vehicles
- 04 vehicles
- 105+ vehicles
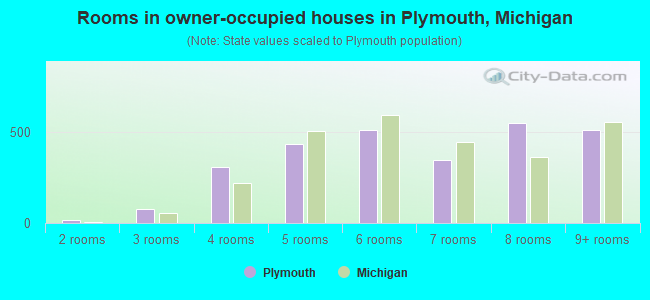
- Rooms in owner-occupied houses in Plymouth, Michigan
- 01 room
- 162 rooms
- 783 rooms
- 3074 rooms
- 4355 rooms
- 5116 rooms
- 3487 rooms
- 5518 rooms
- 5139+ rooms
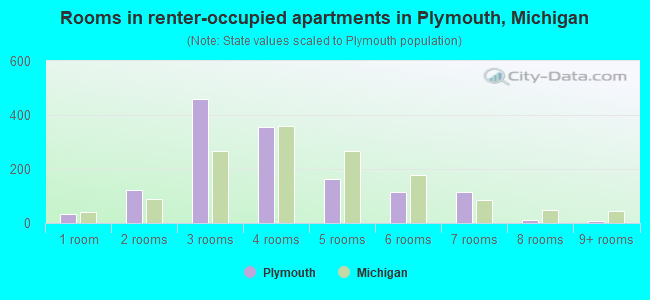
- Rooms in renter-occupied apartments in Plymouth, Michigan
- 321 room
- 1212 rooms
- 4603 rooms
- 3554 rooms
- 1645 rooms
- 1146 rooms
- 1157 rooms
- 108 rooms
- 99+ rooms
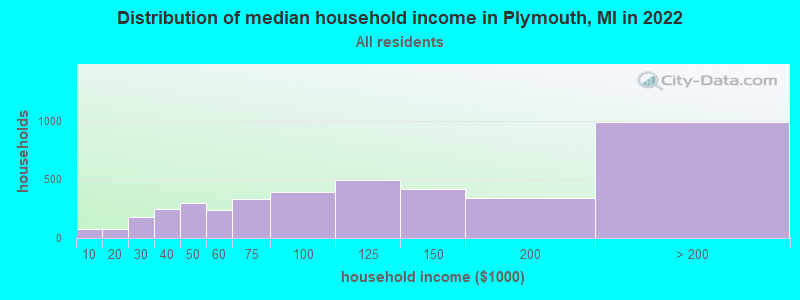
Plymouth, MI household income distribution

- 78Less than $10,000
- 75$10,000 to $19,999
- 183$20,000 to $29,999
- 248$30,000 to $39,999
- 297$40,000 to $49,999
- 242$50,000 to $59,999
- 332$60,000 to $74,999
- 389$75,000 to $99,999
- 499$100,000 to $124,999
- 418$125,000 to $149,999
- 338$150,000 to $199,999
- 990$200,000 or more
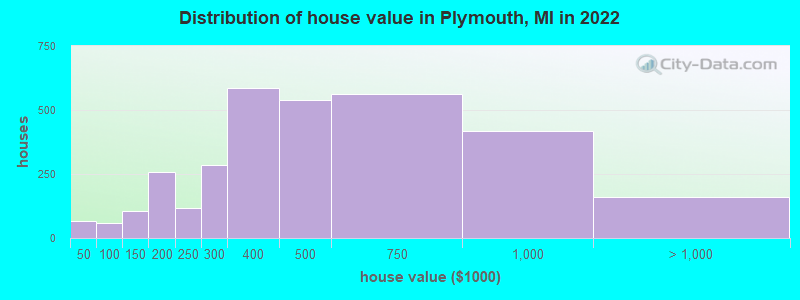
Home value of owner - occupied houses in 2022 in Plymouth, MI
-
- 5Less than $10,000
- 5$10,000 to $14,999
- 3$20,000 to $24,999
- 15$25,000 to $29,999
- 31$35,000 to $39,999
- 4$40,000 to $49,999
- 41$80,000 to $89,999
- 14$90,000 to $99,999
- 80$100,000 to $124,999
- 24$125,000 to $149,999
- 178$150,000 to $174,999
- 80$175,000 to $199,999
- 115$200,000 to $249,999
- 285$250,000 to $299,999
- 583$300,000 to $399,999
- 538$400,000 to $499,999
- 561$500,000 to $749,999
- 418$750,000 to $999,999
- 104$1,000,000 to $1,499,999
- 53$1,500,000 to $1,999,999
- 5$2,000,000 or more
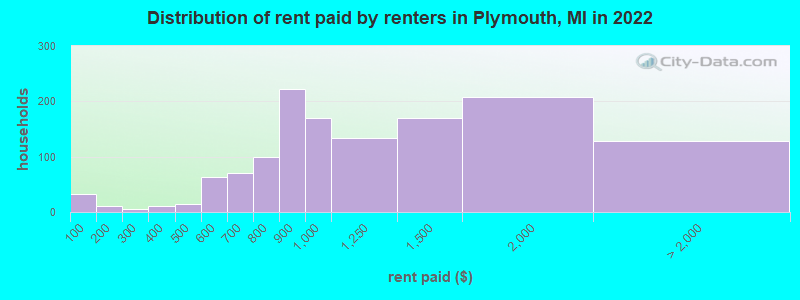
Rent paid by renters in 2022 in Plymouth, MI
-
- 33Less than $100
- 11$150 to $199
- 5$250 to $299
- 10$300 to $349
- 15$400 to $449
- 45$500 to $549
- 18$550 to $599
- 51$600 to $649
- 18$650 to $699
- 69$700 to $749
- 29$750 to $799
- 221$800 to $899
- 169$900 to $999
- 132$1,000 to $1,249
- 169$1,250 to $1,499
- 207$1,500 to $1,999
- 93$2,000 to $2,499
- 6$2,500 to $2,999
- 29No cash rent
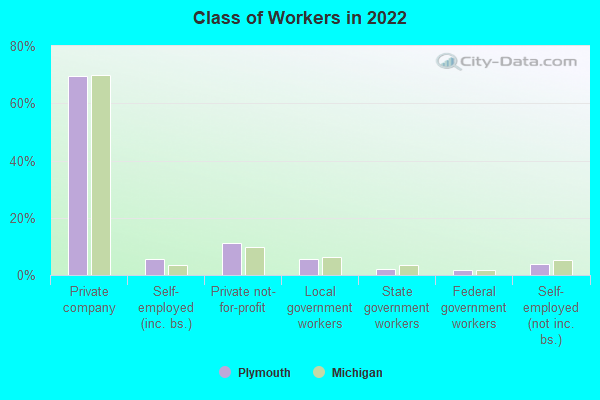
Percentage of workers working in this county: 70.9%
Number of people working at home: 1,382 (27.4% of all workers)
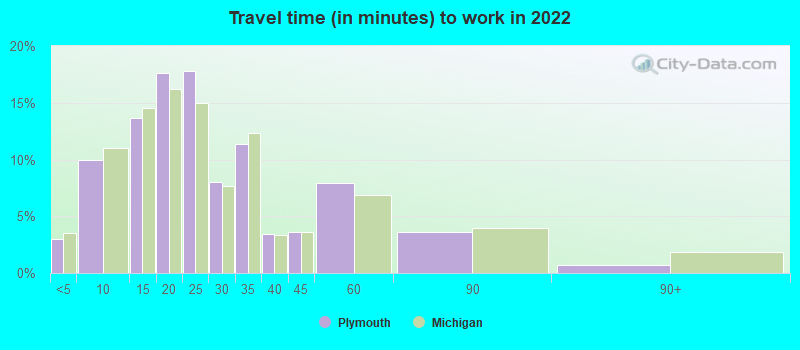
Travel time to work (commute)
- Less than 5 minutes: 211
- 5 to 9 minutes: 587
- 10 to 14 minutes: 391
- 15 to 19 minutes: 369
- 20 to 24 minutes: 537
- 25 to 29 minutes: 442
- 30 to 34 minutes: 493
- 35 to 39 minutes: 142
- 40 to 44 minutes: 224
- 45 to 59 minutes: 248
- 60 to 89 minutes: 117
- 90 or more minutes: 143
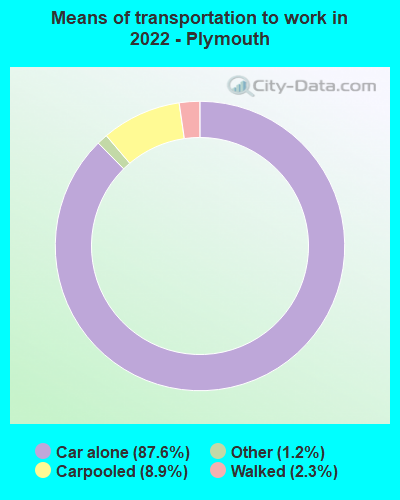
Means of transportation to work:
- Drove a car alone: 8,046 (76.1%)
- Carpooled: 803 (7.6%)
- Taxi: 120 (1.1%)
- Bicycle: 7 (0.1%)
- Walked: 221 (2.1%)
- Worked at home: 1,382 (13.1%)
- Unemployment by race in 2022
- Unemployment rate for White non-Hispanic residents
- 2.4%Males
- 1.3%Females
- Unemployment rate for Black residents
- 11.1%Males
- 32.9%Females
- Unemployment rate for two or more race residents
- 5.6%Males
- Unemployment rate for Hispanic or Latino residents
- 59.9%Females
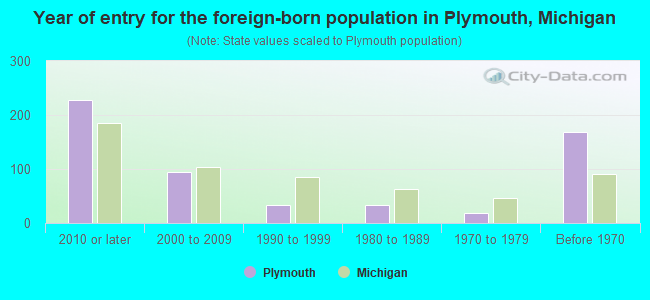
- Year of entry for the foreign-born population in Plymouth, Michigan
- 2282010 or later
- 942000 to 2009
- 341990 to 1999
- 331980 to 1989
- 181970 to 1979
- 168Before 1970
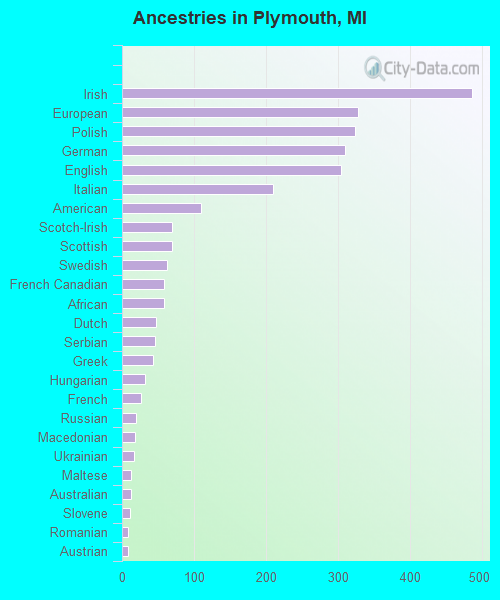
First ancestries reported:
- Irish: 485 (14.0%)
- European: 327 (9.4%)
- Polish: 323 (9.3%)
- German: 309 (8.9%)
- English: 304 (8.8%)
- Italian: 210 (6.1%)
- American: 110 (3.2%)
- Scotch-Irish: 70 (2.0%)
- Scottish: 69 (2.0%)
- Swedish: 62 (1.8%)
- French Canadian: 58 (1.7%)
- African: 58 (1.7%)
- Dutch: 47 (1.4%)
- Serbian: 46 (1.3%)
- Greek: 43 (1.2%)
- Hungarian: 32 (0.9%)
- French: 27 (0.8%)
- Russian: 19 (0.5%)
- Macedonian: 18 (0.5%)
- Ukrainian: 16 (0.5%)
- Maltese: 13 (0.4%)
- Australian: 12 (0.3%)
- Slovene: 11 (0.3%)
- Romanian: 9 (0.3%)
- Austrian: 8 (0.2%)
- British: 7 (0.2%)
- Turkish: 7 (0.2%)
- Eastern European: 6 (0.2%)
- Lithuanian: 6 (0.2%)
- Slovak: 6 (0.2%)
- Scandinavian: 4 (0.1%)
- Jordanian: 3 (0.09%)
- Arab: 3 (0.09%)
- Assyrian: 3 (0.09%)
- Croatian: 3 (0.09%)
- Belgian: 2 (0.06%)
Most common places of birth for foreign-born residents (%):
| Plymouth: | 18.8% (77) |
| Michigan: | 5.0% (35,052) |
| Plymouth: | 7.8% (32) |
| Michigan: | 11.1% (77,240) |
| Plymouth: | 7.6% (31) |
| Michigan: | 2.3% (16,126) |
| Plymouth: | 6.6% (27) |
| Michigan: | 1.1% (7,792) |
| Plymouth: | 5.9% (24) |
| Michigan: | 10.9% (75,965) |
| Plymouth: | 5.4% (22) |
| Michigan: | 2.8% (19,112) |
| Plymouth: | 4.9% (20) |
| Michigan: | 0.8% (5,492) |
| Plymouth: | 4.4% (18) |
| Michigan: | 0.2% (1,159) |
| Plymouth: | 4.2% (17) |
| Michigan: | 0.6% (3,931) |
| Plymouth: | 4.2% (17) |
| Michigan: | 0.2% (1,569) |
| Plymouth: | 3.4% (14) |
| Michigan: | 1.6% (10,857) |
| Plymouth: | 2.7% (11) |
| Michigan: | 1.0% (7,097) |
| Plymouth: | 2.7% (11) |
| Michigan: | 0.2% (1,298) |
| Plymouth: | 2.4% (10) |
| Michigan: | 0.2% (1,437) |
| Plymouth: | 2.4% (10) |
| Michigan: | 0.1% (873) |
| Plymouth: | 2.4% (10) |
| Michigan: | 1.1% (7,485) |
| Plymouth: | 2.2% (9) |
| Michigan: | 0.4% (2,721) |
| Plymouth: | 2.0% (8) |
| Michigan: | 4.9% (34,295) |
| Plymouth: | 1.7% (7) |
| Michigan: | 3.0% (20,884) |
| Plymouth: | 1.7% (7) |
| Michigan: | 1.0% (6,730) |
| Plymouth: | 1.7% (7) |
| Michigan: | 0.2% (1,144) |
Place of birth for U.S.-born residents:
- This state: 6,871
- Other state: 1,794
- Northeast: 530
- Midwest: 618
- South: 388
- West: 255
87.1% of Plymouth residents lived in the same house 1 years ago.
Out of people who lived in different houses, 30.3% lived in this county.
Out of people who lived in different counties, 78.2% lived in Michigan.
| Plymouth: | 87.1% |
| State average: | 88.4% |
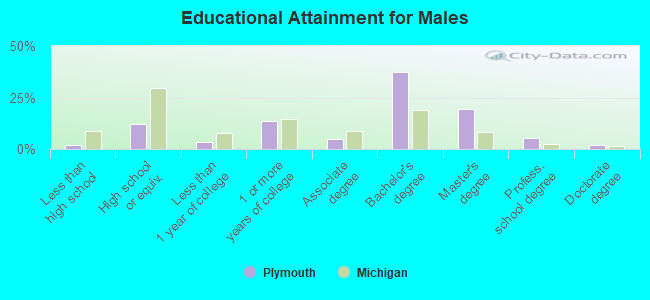
Education attainment for males 25 years and older:
- No schooling: 10
- Nursery to 4th grade: 0
- 5th and 6th grade: 0
- 7th and 8th grade: 5
- 9th grade: 0
- 10th grade: 13
- 11th grade: 15
- 12th grade, no diploma: 19
- High school graduate (or equivalency): 390
- Less than 1 year of college: 114
- Some college more than 1 year, no degree: 434
- Associate degree: 157
- Bachelor's degree: 1,208
- Master's degree: 624
- Professional school degree: 168
- Doctorate degree: 59
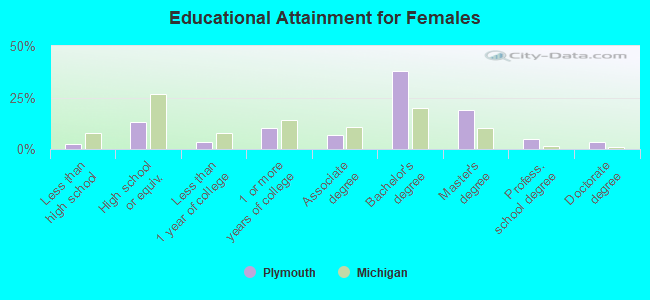
Education attainment for females 25 years and older:
- No schooling: 0
- Nursery to 4th grade: 5
- 5th and 6th grade: 0
- 7th and 8th grade: 18
- 9th grade: 0
- 10th grade: 5
- 11th grade: 16
- 12th grade, no diploma: 35
- High school graduate (or equivalency): 453
- Less than 1 year of college: 112
- Some college more than 1 year, no degree: 342
- Associate degree: 225
- Bachelor's degree: 1,296
- Master's degree: 642
- Professional school degree: 170
- Doctorate degree: 110


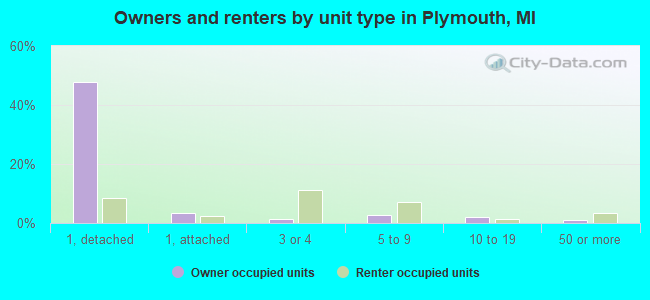
Housing units in structures:
- One, detached: 2,635
- One, attached: 178
- Two: 191
- 3 or 4: 444
- 5 to 9: 416
- 10 to 19: 230
- 20 to 49: 122
- 50 or more: 166
Housing units lacking complete kitchen facilities in 2022: 1.1%
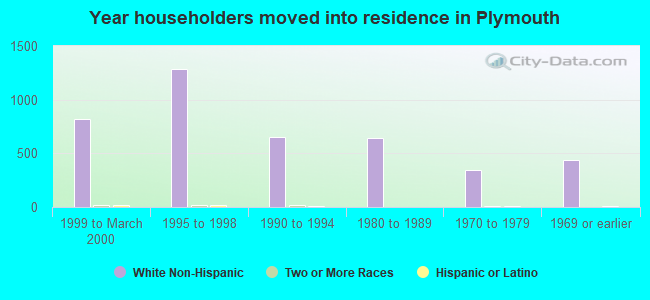
House/condo owner moved in on average 11 years ago
Renter moved in on average 2 years ago
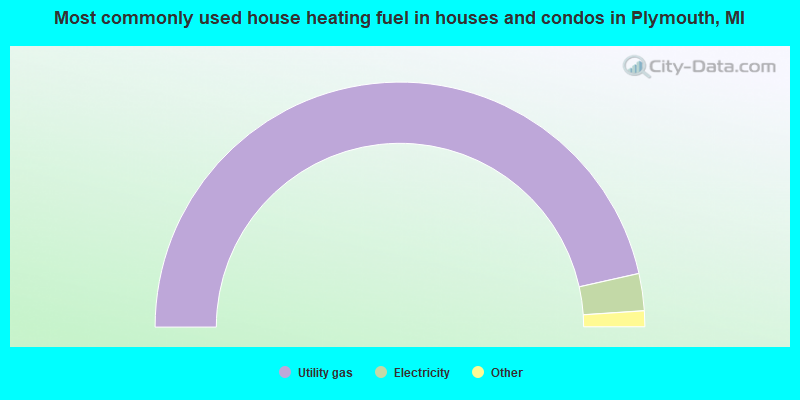
- 93.0%Utility gas
- 4.9%Electricity
- 0.8%Wood
- 0.7%Bottled, tank, or LP gas
- 0.4%No fuel used
- 0.2%Other fuel
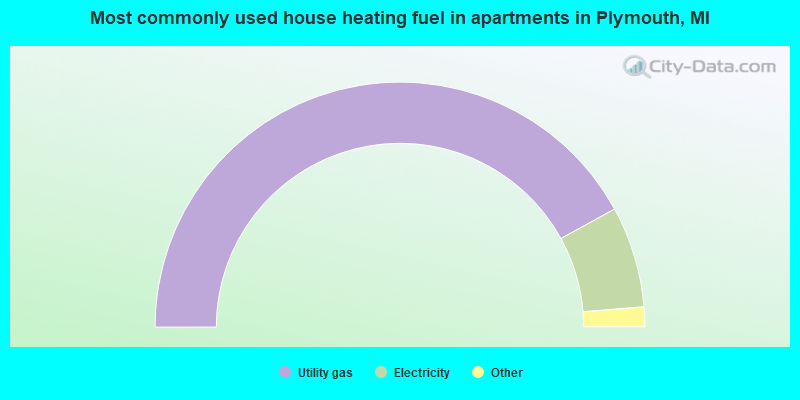
- 84.1%Utility gas
- 13.4%Electricity
- 1.9%Bottled, tank, or LP gas
- 0.6%Other fuel
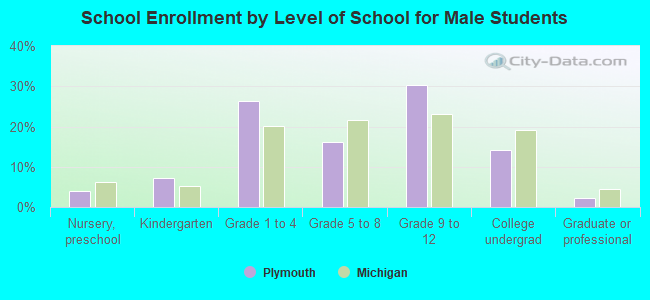
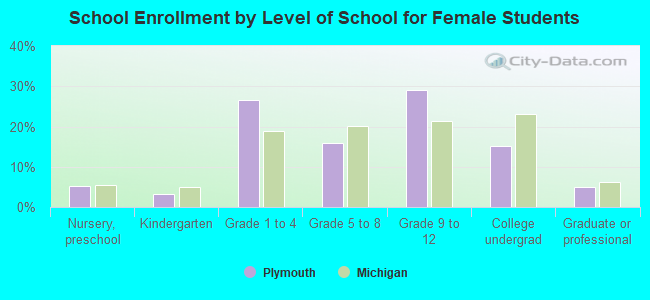
Private vs. public school enrollment:
| Here: | 26.9% |
| Michigan: | 12.4% |
| Here: | 15.7% |
| Michigan: | 9.8% |
| Here: | 0.0% |
| Michigan: | 14.9% |