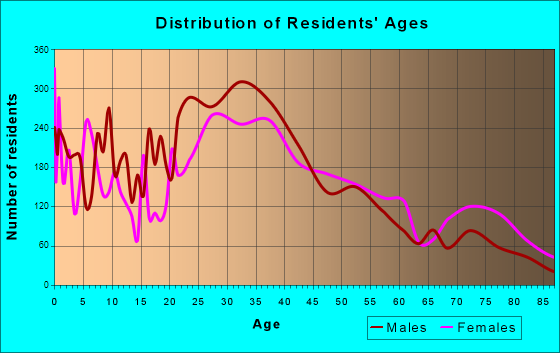
Port Chester, NY (New York) Houses and Residents
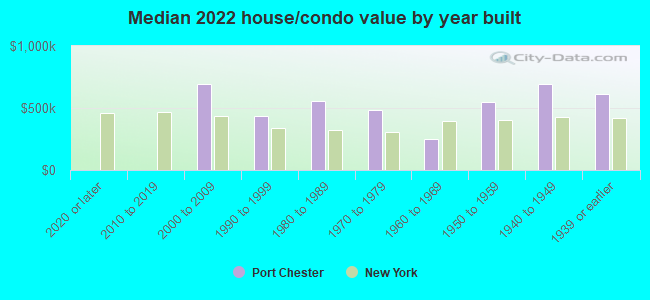
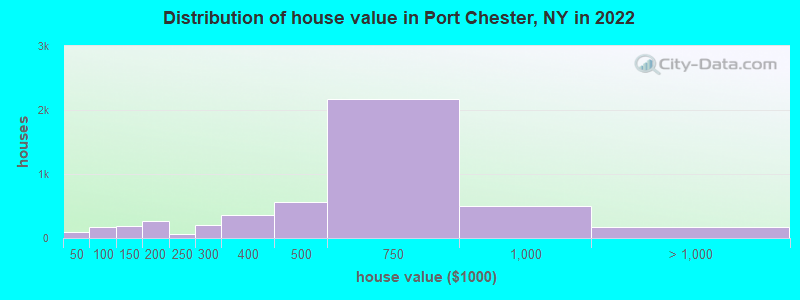
Estimated median house or condo value in 2022: $562,398 (it was $252,100 in 2000 )
Port Chester:
$562,398New York:
$400,400
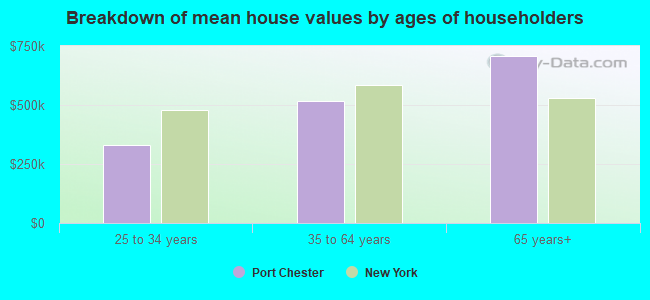
Lower value quartile - upper value quartile: $382,573 - $697,259Mean price in 2022: Detached houses: $698,287 Here:
$698,287State:
$476,719
Townhouses or other attached units: $489,421 Here:
$489,421State:
$699,270
In 2-unit structures: $522,009 Here:
$522,009State:
$713,077
In 3-to-4-unit structures: $451,567 Here:
$451,567State:
$764,568
In 5-or-more-unit structures: $252,303 Here:
$252,303State:
$912,009
Total population: 29,522 (Urban population: 27,867, Rural population: 0)
Houses: 10,832 (10,345 occupied: 4,672 owner occupied, 5,698 renter occupied )
% of renters here:
55%State:
46%
Housing density: 4,596 houses/condos per square mile
Median price asked for vacant for-sale houses and condos in 2022: $195,479.
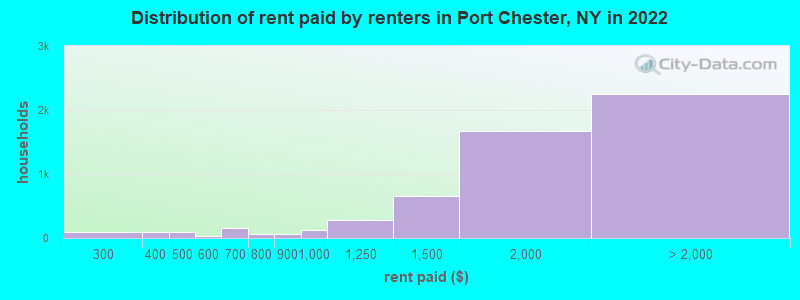
Median contract rent in 2022: $1,778 (lower quartile is $1,314, upper quartile is over $2,000)
Median rent asked for vacant for-rent units in 2022: $3,757
Median gross rent in Port Chester, NY in 2022: $1,928
Housing units in Port Chester with a mortgage: 3,285 (285 second mortgage, 0 home equity loan, 216 both second mortgage and home equity loan )Houses without a mortgage: 23
Median household income for houses/condos with a mortgage: $141,691
Median household income for apartments without a mortgage: $88,520
Median monthly housing costs: $2,118
Data:
Median house or condo value ($)
Median house or condo value ($ change since 2000)
Median house or condo value ($) - White
Median house or condo value ($) - Black or African American
Median house or condo value ($) - Asian
Median house or condo value ($) - Hispanic or Latino
Median house or condo value ($) - American Indian and Alaska Native
Median house or condo value ($) - Multirace
Median house or condo value ($) - Other Race
Median price asked for mobile homes ($)
Household density (households per square mile)
Mean house or condo value by units in structure - 1, detached ($)
Mean house or condo value by units in structure - 1, attached ($)
Mean house or condo value by units in structure - 2 ($)
Mean house or condo value by units in structure by units in structure - 3 or 4 ($)
Mean house or condo value by units in structure - 5 or more ($)
Mean house or condo value by units in structure - Boat, RV, van, etc. ($)
Mean house or condo value by units in structure - Mobile home ($)
Median contract rent ($)
Median contract rent - Lower quartile ($)
Median contract rent - Upper quartile ($)
Median gross rent ($)
Urban houses (%)
Rural houses (%)
Houses occupied (%)
Houses occupied (% change since 2000)
Houses owner occupied (%)
Houses owner occupied (% change since 2000)
Houses renter occupied (%)
Houses renter occupied (% change since 2000)
Vacant housing units - For rent (%)
Vacant housing units - For rent (% change since 2000)
Vacant housing units - For sale only (%)
Vacant housing units - For sale only (% change since 2000)
Vacant housing units - Rented or sold, not occupied (%)
Vacant housing units - Rented or sold, not occupied (% change since 2000)
Vacant housing units - For seasonal, recreational, or occasional use (%)
Vacant housing units - For seasonal, recreational, or occasional use (% change since 2000)
Vacant housing units - For migrant workers (%)
Vacant housing units - For migrant workers (% change since 2000)
Vacant housing units - Other vacant (%)
Vacant housing units - Other vacant (% change since 2000)
Median monthly housing costs ($)
Median household income for houses/condos with a mortgage ($)
Median household income for houses/condos without a mortgage ($)
Median household income ($)
Median household income ($) - White
Median household income ($) - Black or African American
Median household income ($) - Asian
Median household income ($) - Hispanic or Latino
Median household income ($) - American Indian and Alaska Native
Median household income ($) - Multirace
Median household income ($) - Other Race
Mortgage status - with mortgage (%)
Mortgage status - with second mortgage (%)
Mortgage status - with home equity loan (%)
Mortgage status - with both second mortgage and home equity loan (%)
Mortgage status - without a mortgage (%)
Median year house/condo built
Median year apartment built
Household type by relationship - Male householder living alone (%)
Household type by relationship - Male householder not living alone (%)
Household type by relationship - Female householder living alone (%)
Household type by relationship - Female householder not living alone (%)
Household type by relationship - Opposite-Sex spouse (%)
Household type by relationship - Same-Sex spouse (%)
Household type by relationship - Opposite-Sex unmarried partner (%)
Household type by relationship - Same-Sex unmarried partner (%)
Household type by relationship - In group quarters (%)
Size of family households - 2-person household (%)
Size of family households - 3-person household (%)
Size of family households - 4-person household (%)
Size of family households - 5-person household (%)
Size of family households - 6-person household (%)
Size of family households - 7-or-more-person household (%)
Size of nonfamily households - 1-person household (%)
Size of nonfamily households - 2-person household (%)
Size of nonfamily households - 3-person household (%)
Size of nonfamily households - 4-person household (%)
Size of nonfamily households - 5-person household (%)
Size of nonfamily households - 6-person household (%)
Size of nonfamily households - 7-or-moreperson household (%)
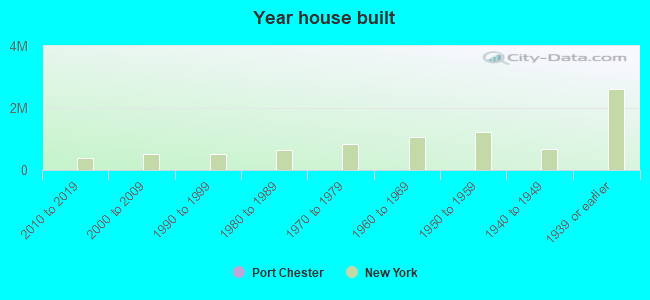
Year house built - Built 2010 or later (%)
Year house built - Built 2000 to 2009 (%)
Year house built - Built 1990 to 1999 (%)
Year house built - Built 1980 to 1989 (%)
Year house built - Built 1970 to 1979 (%)
Year house built - Built 1960 to 1969 (%)
Year house built - Built 1950 to 1959 (%)
Year house built - Built 1940 to 1949 (%)
Year house built - Built 1939 or earlier (%)
Median number of rooms in houses and condos
Median number of rooms in apartments
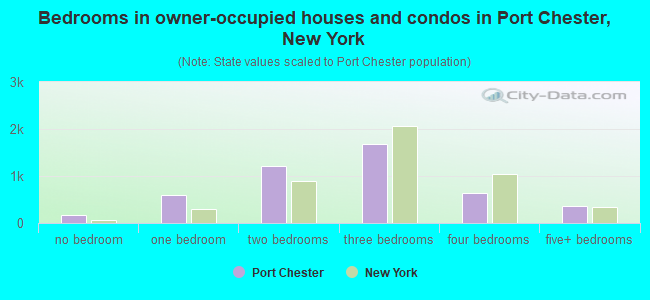
Median number of bedrooms in owner occupied houses
Mean number of bedrooms in owner occupied houses
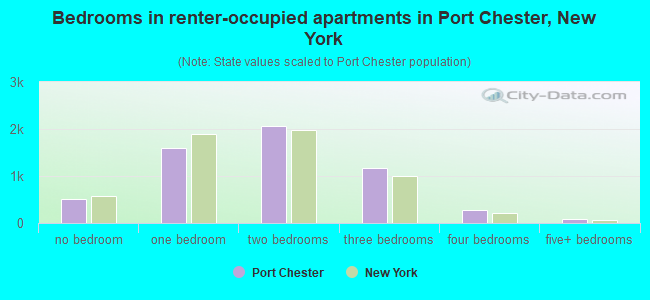
Median number of bedrooms in renter occupied houses
Mean number of bedrooms in renter occupied houses
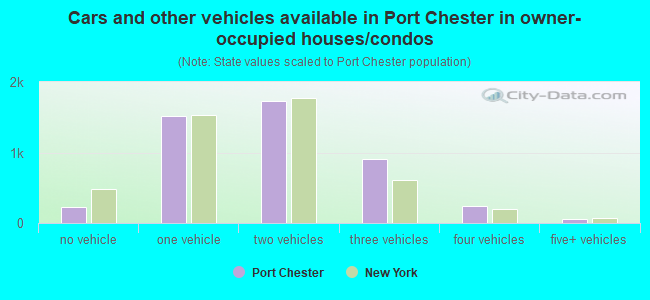
Median number of vehichles in owner occupied houses
Mean number of vehichles in owner occupied houses
Median number of vehichles in renter occupied houses
Mean number of vehichles in renter occupied houses
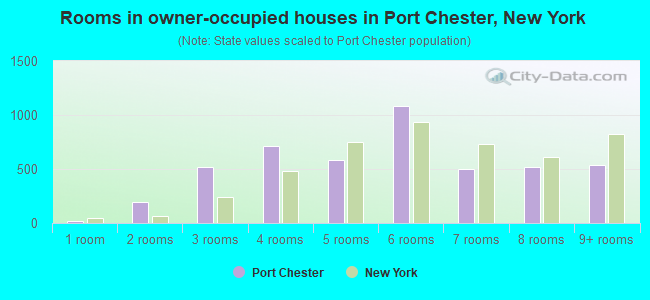
Rooms in owner-occupied houses - 1 room (%)
Rooms in owner-occupied houses - 2 rooms (%)
Rooms in owner-occupied houses - 3 rooms (%)
Rooms in owner-occupied houses - 4 rooms (%)
Rooms in owner-occupied houses - 5 rooms (%)
Rooms in owner-occupied houses - 6 rooms (%)
Rooms in owner-occupied houses - 7 rooms (%)
Rooms in owner-occupied houses - 8 rooms (%)
Rooms in owner-occupied houses - 9+ rooms (%)
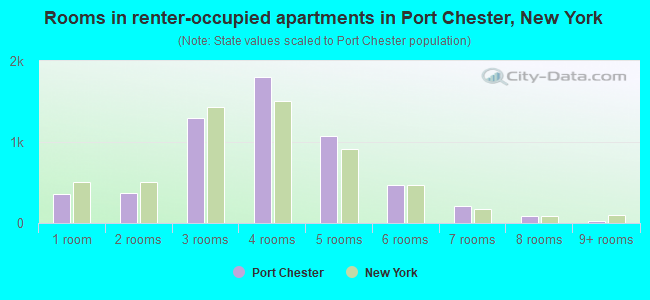
Rooms in renter-occupied houses - 1 room (%)
Rooms in renter-occupied houses - 2 rooms (%)
Rooms in renter-occupied houses - 3 rooms (%)
Rooms in renter-occupied houses - 4 rooms (%)
Rooms in renter-occupied houses - 5 rooms (%)
Rooms in renter-occupied houses - 6 rooms (%)
Rooms in renter-occupied houses - 7 rooms (%)
Rooms in renter-occupied houses - 8 rooms (%)
Rooms in renter-occupied houses - 9+ rooms (%)
Bedrooms in owner-occupied houses - no bedrooms (%)
Bedrooms in owner-occupied houses - 1 bedroom (%)
Bedrooms in owner-occupied houses - 2 bedrooms (%)
Bedrooms in owner-occupied houses - 3 bedrooms (%)
Bedrooms in owner-occupied houses - 4 bedrooms (%)
Bedrooms in owner-occupied houses - 5+ bedrooms (%)
Bedrooms in renter-occupied houses - no bedrooms (%)
Bedrooms in renter-occupied houses - 1 bedroom (%)
Bedrooms in renter-occupied houses - 2 bedrooms (%)
Bedrooms in renter-occupied houses - 3 bedrooms (%)
Bedrooms in renter-occupied houses - 4 bedrooms (%)
Bedrooms in renter-occupied houses - 5+ bedrooms (%)
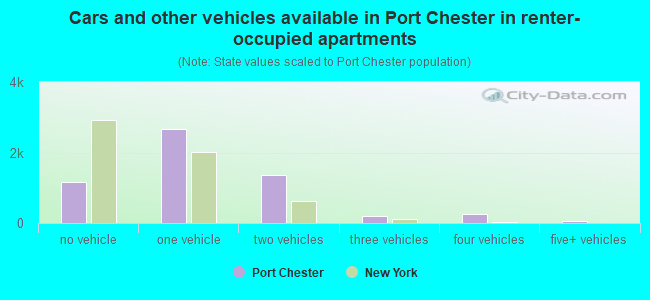
Vehicles available in owner-occupied houses - no vehicle available (%)
Vehicles available in owner-occupied houses - 1 vehicle available(%)
Vehicles available in owner-occupied houses - 2 Vehicles available (%)
Vehicles available in owner-occupied houses - 3 Vehicles available (%)
Vehicles available in owner-occupied houses - 4 Vehicles available (%)
Vehicles available in owner-occupied houses - 5+ Vehicles available (%)
Vehicles available in renter-occupied houses - no vehicle available (%)
Vehicles available in renter-occupied houses - 1 vehicle available (%)
Vehicles available in renter-occupied houses - 2 Vehicles available (%)
Vehicles available in renter-occupied houses - 3 Vehicles available (%)
Vehicles available in renter-occupied houses - 4 Vehicles available (%)
Vehicles available in renter-occupied houses - 5+ Vehicles available (%)
Housing units in structures - 1, detached (%)
Housing units in structures - 1, attached (%)
Housing units in structures - 2 (%)
Housing units in structures - 3 or 4 (%)
Housing units in structures - 5 to 9 (%)
Housing units in structures - 10 to 19 (%)
Housing units in structures - 20 to 49 (%)
Housing units in structures - 50 or more (%)
Housing units in structures - Mobile home (%)
Housing units in structures - Boat, RV, van, etc. (%)
Housing units in structures - Owners - 1, detached (%)
Housing units in structures - Owners - 1, attached (%)
Housing units in structures - Owners - 2 (%)
Housing units in structures - Owners - 3 or 4 (%)
Housing units in structures - Owners - 5 to 9 (%)
Housing units in structures - Owners - 10 to 19 (%)
Housing units in structures - Owners - 20 to 49 (%)
Housing units in structures - Owners - 50 or more (%)
Housing units in structures - Owners - Mobile home (%)
Housing units in structures - Owners - Boat, RV, van, etc. (%)
Housing units in structures - Renters - 1, detached (%)
Housing units in structures - Renters - 1, attached (%)
Housing units in structures - Renters - 2 (%)
Housing units in structures - Renters - 3 or 4 (%)
Housing units in structures - Renters - 5 to 9 (%)
Housing units in structures - Renters - 10 to 19 (%)
Housing units in structures - Renters - 20 to 49 (%)
Housing units in structures - Renters - 50 or more (%)
Housing units in structures - Renters - Mobile home (%)
Housing units in structures - Renters - Boat, RV, van, etc. (%)
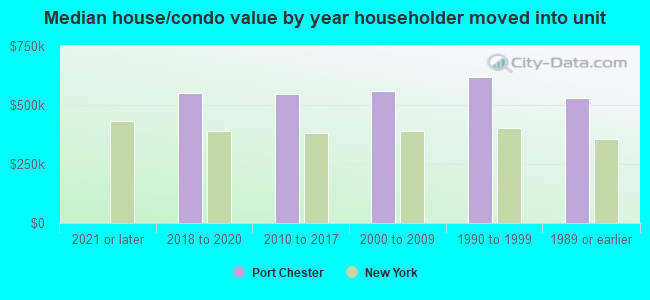
House/condo owner moved in on average (years ago)
Renter moved in on average (years ago)
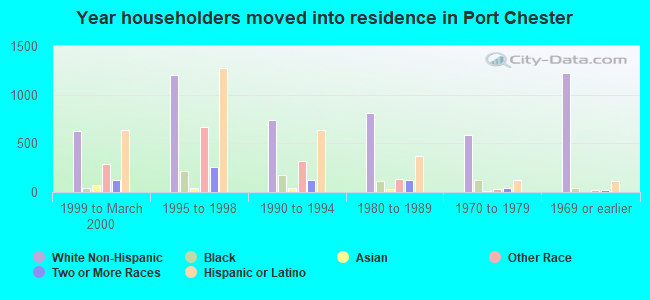
Year householder moved into unit - Moved in 1999 to March 2000 (%)
Year householder moved into unit - Moved in 1999 to March 2000 (%) - White
Year householder moved into unit - Moved in 1999 to March 2000 (%) - Black or African American
Year householder moved into unit - Moved in 1999 to March 2000 (%) - Asian
Year householder moved into unit - Moved in 1999 to March 2000 (%) - Hispanic or Latino
Year householder moved into unit - Moved in 1999 to March 2000 (%) - American Indian and Alaska Native
Year householder moved into unit - Moved in 1999 to March 2000 (%) - Multirace
Year householder moved into unit - Moved in 1999 to March 2000 (%) - Other Race
Year householder moved into unit - Moved in 1995 to 1998 (%)
Year householder moved into unit - Moved in 1995 to 1998 (%) - White
Year householder moved into unit - Moved in 1995 to 1998 (%) - Black or African American
Year householder moved into unit - Moved in 1995 to 1998 (%) - Asian
Year householder moved into unit - Moved in 1995 to 1998 (%) - Hispanic or Latino
Year householder moved into unit - Moved in 1995 to 1998 (%) - American Indian and Alaska Native
Year householder moved into unit - Moved in 1995 to 1998 (%) - Multirace
Year householder moved into unit - Moved in 1995 to 1998 (%) - Other Race
Year householder moved into unit - Moved in 1990 to 1994 (%)
Year householder moved into unit - Moved in 1990 to 1994 (%) - White
Year householder moved into unit - Moved in 1990 to 1994 (%) - Black or African American
Year householder moved into unit - Moved in 1990 to 1994 (%) - Asian
Year householder moved into unit - Moved in 1990 to 1994 (%) - Hispanic or Latino
Year householder moved into unit - Moved in 1990 to 1994 (%) - American Indian and Alaska Native
Year householder moved into unit - Moved in 1990 to 1994 (%) - Multirace
Year householder moved into unit - Moved in 1990 to 1994 (%) - Other Race
Year householder moved into unit - Moved in 1980 to 1989 (%)
Year householder moved into unit - Moved in 1980 to 1989 (%) - White
Year householder moved into unit - Moved in 1980 to 1989 (%) - Black or African American
Year householder moved into unit - Moved in 1980 to 1989 (%) - Asian
Year householder moved into unit - Moved in 1980 to 1989 (%) - Hispanic or Latino
Year householder moved into unit - Moved in 1980 to 1989 (%) - American Indian and Alaska Native
Year householder moved into unit - Moved in 1980 to 1989 (%) - Multirace
Year householder moved into unit - Moved in 1980 to 1989 (%) - Other Race
Year householder moved into unit - Moved in 1970 to 1979 (%)
Year householder moved into unit - Moved in 1970 to 1979 (%) - White
Year householder moved into unit - Moved in 1970 to 1979 (%) - Black or African American
Year householder moved into unit - Moved in 1970 to 1979 (%) - Asian
Year householder moved into unit - Moved in 1970 to 1979 (%) - Hispanic or Latino
Year householder moved into unit - Moved in 1970 to 1979 (%) - American Indian and Alaska Native
Year householder moved into unit - Moved in 1970 to 1979 (%) - Multirace
Year householder moved into unit - Moved in 1970 to 1979 (%) - Other Race
Year householder moved into unit - Moved in 1969 or earlier (%)
Year householder moved into unit - Moved in 1969 or earlier (%) - White
Year householder moved into unit - Moved in 1969 or earlier (%) - Black or African American
Year householder moved into unit - Moved in 1969 or earlier (%) - Asian
Year householder moved into unit - Moved in 1969 or earlier (%) - Hispanic or Latino
Year householder moved into unit - Moved in 1969 or earlier (%) - American Indian and Alaska Native
Year householder moved into unit - Moved in 1969 or earlier (%) - Multirace
Year householder moved into unit - Moved in 1969 or earlier (%) - Other Race
Housing units lacking complete plumbing facilities (%)
Housing units lacking complete kitchen facilities (%)
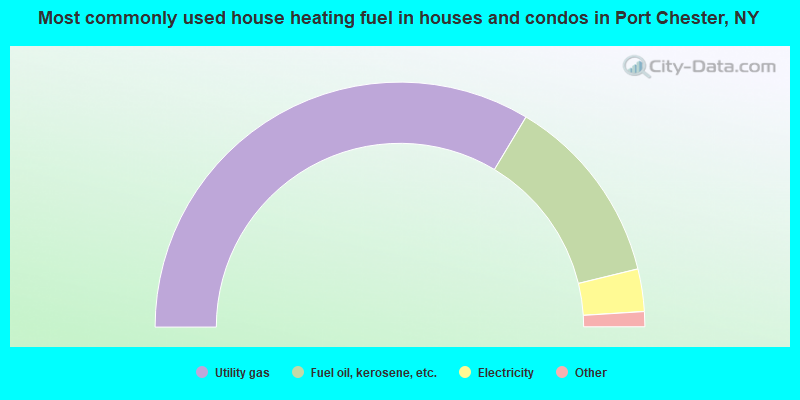
House heating fuel used in houses and condos - Utility gas (%)
House heating fuel used in houses and condos - Bottled, tank, or LP gas (%)
House heating fuel used in houses and condos - Electricity (%)
House heating fuel used in houses and condos - Fuel oil, kerosene, etc. (%)
House heating fuel used in houses and condos - Coal or coke (%)
House heating fuel used in houses and condos - Wood (%)
House heating fuel used in houses and condos - Solar energy (%)
House heating fuel used in houses and condos - Other fuel (%)
House heating fuel used in houses and condos - No fuel used (%)
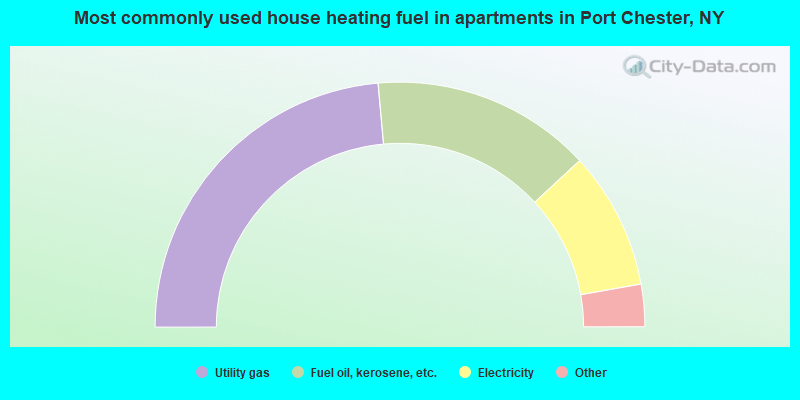
House heating fuel used in apartments - Utility gas (%)
House heating fuel used in apartments - Bottled, tank, or LP gas (%)
House heating fuel used in apartments - Electricity (%)
House heating fuel used in apartments - Fuel oil, kerosene, etc. (%)
House heating fuel used in apartments - Coal or coke (%)
House heating fuel used in apartments - Wood (%)
House heating fuel used in apartments - Solar energy (%)
House heating fuel used in apartments - Other fuel (%)
House heating fuel used in apartments - No fuel used (%)
Median year house/condo built: 1951Median year apartment built: 1959Household type by relationship:
Households: 31,053
Male householders: 5,185 (929 living alone ), Female householders: 4,948 (1,396 living alone )5,256 spouses (5,228 opposite-sex spouses ), 524 unmarried partners , (521 opposite-sex unmarried partners ), 9,481 children (9,069 natural , 69 adopted , 342 stepchildren ), 1,162 grandchildren , 783 brothers or sisters , 493 parents , 0 foster children , 1,056 other relatives , 1,902 non-relatives In group quarters: 260
Size of family households: 2,337 2-persons , 1,530 3-persons , 1,971 4-persons , 561 5-persons , 643 6-persons , 239 7-or-more-persons .
Size of nonfamily households: 2,528 1-person , 290 2-persons , 79 3-persons , 15 6-persons , 49 7-or-more-persons .
3,497 married couples with children. single-parent households (555 men , 1,121 women ).
37.3% of residents of Port Chester speak English at home. of residents speak Spanish at home (50% speak English very well , 23% speak English well , 22% speak English not well , 5% don't speak English at all ).of residents speak other Indo-European language at home (69% speak English very well , 18% speak English well , 13% speak English not well ).of residents speak Asian or Pacific Island language at home (48% speak English very well , 38% speak English well , 14% speak English not well ).of residents speak other language at home (54% speak English very well , 46% speak English not well ).
Foreign born population: 13,474 (43.4%)of them are naturalized citizens )
Median number of rooms in houses and condos:
Median number of rooms in apartments
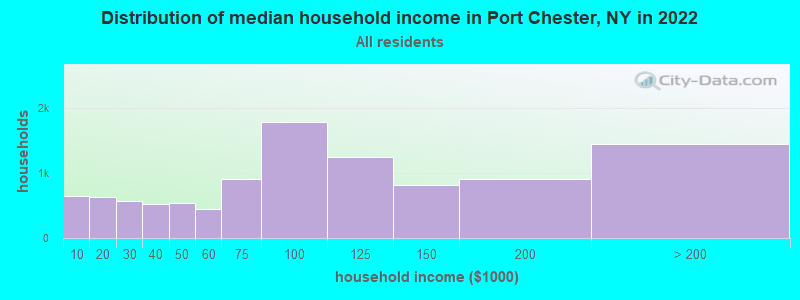
Port Chester, NY household income distribution 643 Less than $10,000633 $10,000 to $19,999560 $20,000 to $29,999520 $30,000 to $39,999536 $40,000 to $49,999449 $50,000 to $59,999904 $60,000 to $74,9991,778 $75,000 to $99,9991,243 $100,000 to $124,999806 $125,000 to $149,999904 $150,000 to $199,9991,445 $200,000 or more
Home value of owner - occupied houses in 2022 in Port Chester, NY 22 $20,000 to $24,99964 $40,000 to $49,99941 $50,000 to $59,99914 $60,000 to $69,99947 $80,000 to $89,99977 $100,000 to $124,999117 $125,000 to $149,99978 $150,000 to $174,999181 $175,000 to $199,99969 $200,000 to $249,999198 $250,000 to $299,999361 $300,000 to $399,999568 $400,000 to $499,9992,172 $500,000 to $749,999498 $750,000 to $999,99949 $1,000,000 to $1,499,99958 $1,500,000 to $1,999,99966 $2,000,000 or moreRent paid by renters in 2022 in Port Chester, NY 10 $100 to $14986 $200 to $2499 $250 to $29997 $300 to $34982 $400 to $4498 $450 to $4997 $500 to $54930 $550 to $59913 $600 to $649143 $650 to $69964 $750 to $79957 $800 to $899131 $900 to $999275 $1,000 to $1,249654 $1,250 to $1,4991,674 $1,500 to $1,9991,148 $2,000 to $2,499701 $2,500 to $2,99972 $3,000 to $3,499134 $3,500 or more189 No cash rent
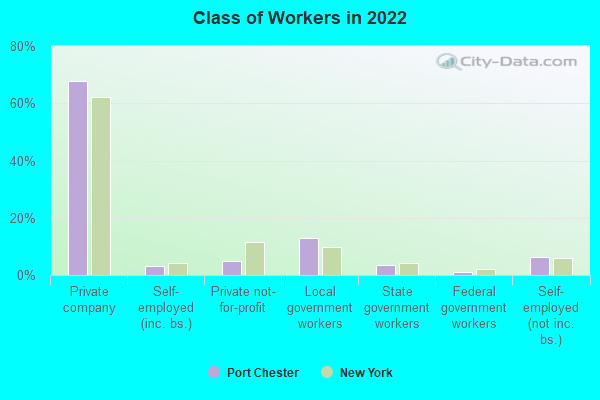
Percentage of workers working in this county: 68.6%Number of people working at home: 1,725 (10.8% of all workers )
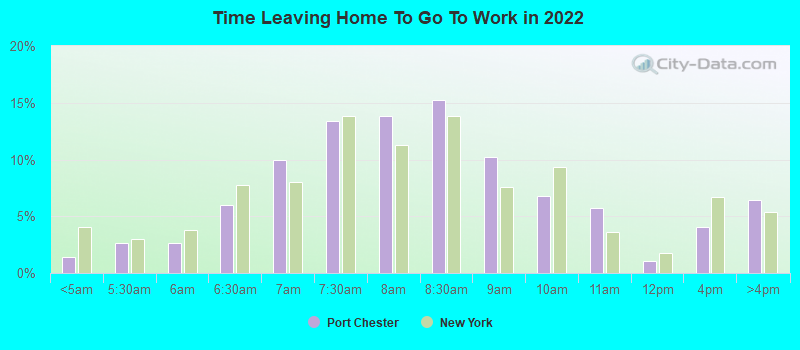
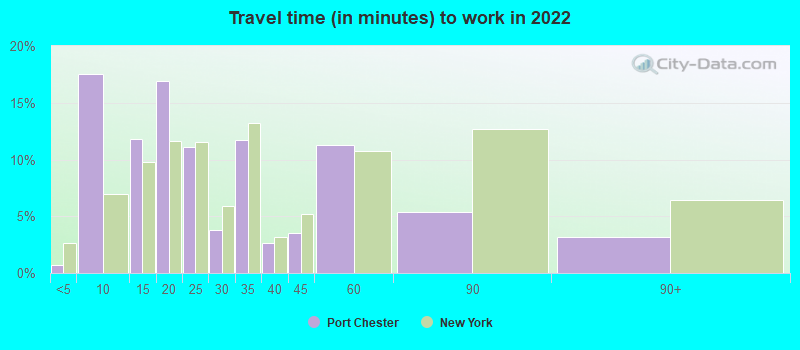
Travel time to work (commute)
Less than 5 minutes: 3305 to 9 minutes: 1,98010 to 14 minutes: 1,95615 to 19 minutes: 3,05320 to 24 minutes: 1,62325 to 29 minutes: 70330 to 34 minutes: 1,25035 to 39 minutes: 29040 to 44 minutes: 30545 to 59 minutes: 1,13960 to 89 minutes: 1,19090 or more minutes: 245
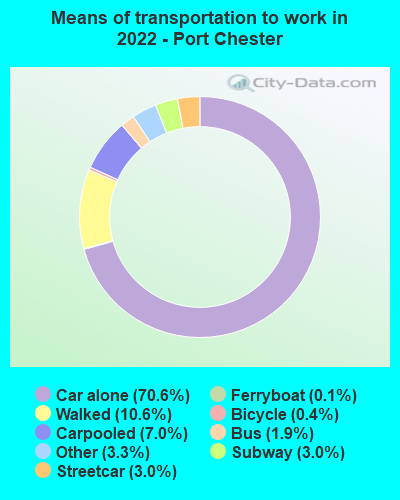
Means of transportation to work:
Drove a car alone: 6,108 (58.0%)Carpooled: 616 (5.8%)Bus : 139 (1.3%)Subway or elevated rail : 350 (3.3%)Long-distance train or commuter rail : 195 (1.9%)Ferryboat: 12 (0.1%)Taxi: 501 (4.8%)Bicycle: 41 (0.4%)Walked: 909 (8.6%)Worked at home: 1,725 (16.4%)
Unemployment by race in 2022
Unemployment rate for White non-Hispanic residents 2.1% Males2.0% FemalesUnemployment rate for Black residents 3.9% Males3.6% FemalesUnemployment rate for American Indian and Alaska Native residents 51.5% Males43.7% FemalesUnemployment rate for Asian residents 12.7% MalesUnemployment rate for other race residents 5.6% Males4.6% FemalesUnemployment rate for two or more race residents 8.1% MalesUnemployment rate for Hispanic or Latino residents 8.6% Males6.6% Females
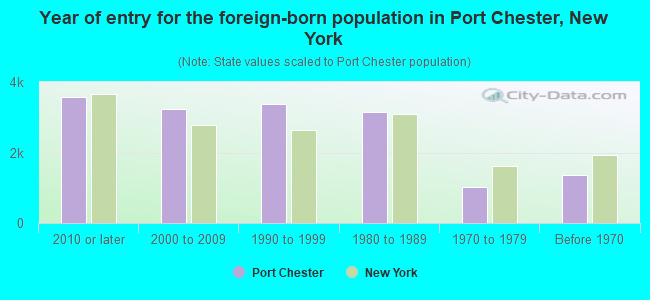
Year of entry for the foreign-born population in Port Chester, New York
3,562 2010 or later 3,230 2000 to 2009 3,368 1990 to 1999 3,140 1980 to 1989 1,027 1970 to 1979 1,365 Before 1970
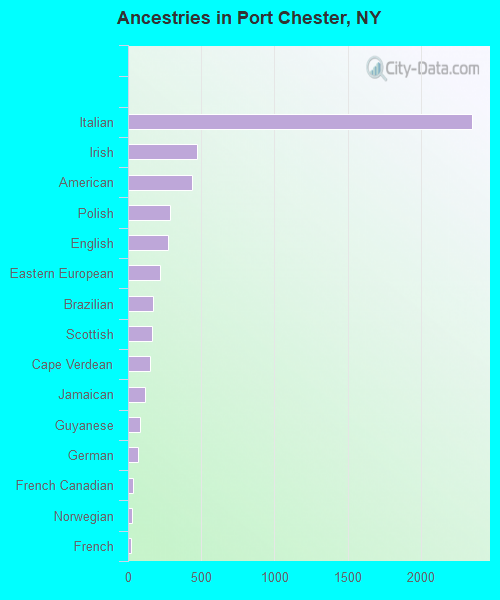
First ancestries reported:
Italian: 2,348 (12.6%)
Irish: 472 (2.5%)
American: 437 (2.4%)
Polish: 285 (1.5%)
English: 270 (1.5%)
Eastern European: 216 (1.2%)
Brazilian: 169 (0.9%)
Scottish: 167 (0.9%)
Cape Verdean: 148 (0.8%)
Jamaican: 119 (0.6%)
Guyanese: 81 (0.4%)
German: 68 (0.4%)
French Canadian: 31 (0.2%)
Norwegian: 29 (0.2%)
French: 23 (0.1%)
African: 21 (0.1%)
Basque: 17 (0.09%)
European: 17 (0.09%)
Iranian: 17 (0.09%)
Ukrainian: 15 (0.08%)
Lebanese: 13 (0.07%)
Greek: 11 (0.06%)
Egyptian: 9 (0.05%)
Danish: 9 (0.05%)
British West Indian: 9 (0.05%)
Czechoslovakian: 8 (0.04%)
Czech: 5 (0.03%)
Maltese: 4 (0.02%)
British: 3 (0.02%)
Barbadian: 2 (0.01%)
Ghanaian: 1 (0.01%) Most common places of birth for foreign-born residents (%): Guatemala Port Chester:
20.4% (2,716)New York:
1.4% (61,245)
Ecuador Port Chester:
17.3% (2,313)New York:
3.9% (177,448)
Mexico Port Chester:
14.8% (1,980)New York:
4.8% (214,559)
Peru Port Chester:
11.9% (1,586)New York:
1.2% (54,759)
Dominican Republic Port Chester:
7.9% (1,060)New York:
11.1% (501,040)
Colombia Port Chester:
7.8% (1,045)New York:
2.5% (111,920)
El Salvador Port Chester:
2.5% (330)New York:
2.4% (108,067)
Brazil Port Chester:
1.9% (254)New York:
0.7% (30,658)
Italy Port Chester:
1.9% (253)New York:
1.8% (81,374)
Place of birth for U.S.-born residents:
This state: 13,182Other state: 3,890Northeast: 2,507Midwest: 428South: 675West: 193 93.2% of Port Chester residents lived in the same house 1 years ago.
Out of people who lived in different houses, 39.4% lived in this county.
Out of people who lived in different counties, 40.5% lived in New York.
Port Chester:
93.2%State average:
89.6%
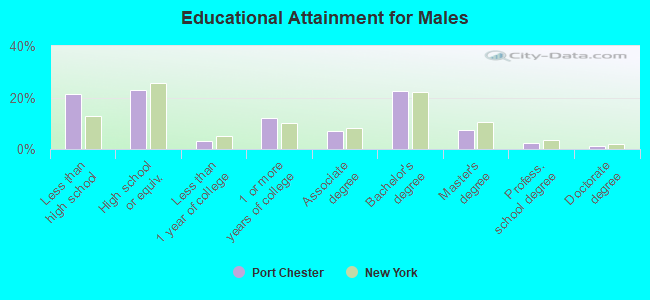
Education attainment for males 25 years and older:
No schooling: 767Nursery to 4th grade: 375th and 6th grade: 4747th and 8th grade: 2029th grade: 5510th grade: 13211th grade: 28712th grade, no diploma: 455High school graduate (or equivalency): 2,622Less than 1 year of college: 374Some college more than 1 year, no degree: 1,349Associate degree: 806Bachelor's degree: 2,576Master's degree: 834Professional school degree: 273Doctorate degree: 138
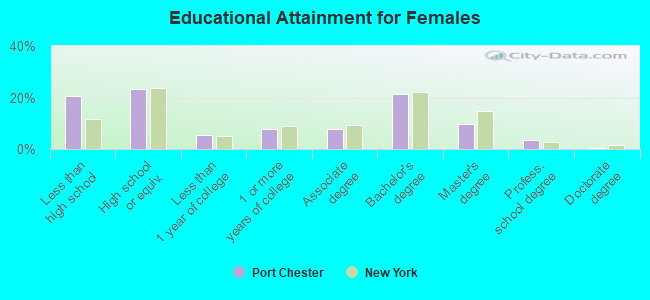
Education attainment for females 25 years and older:
No schooling: 676Nursery to 4th grade: 735th and 6th grade: 4957th and 8th grade: 1119th grade: 9810th grade: 12511th grade: 21812th grade, no diploma: 268High school graduate (or equivalency): 2,355Less than 1 year of college: 542Some college more than 1 year, no degree: 803Associate degree: 794Bachelor's degree: 2,166Master's degree: 974Professional school degree: 350Doctorate degree: 43
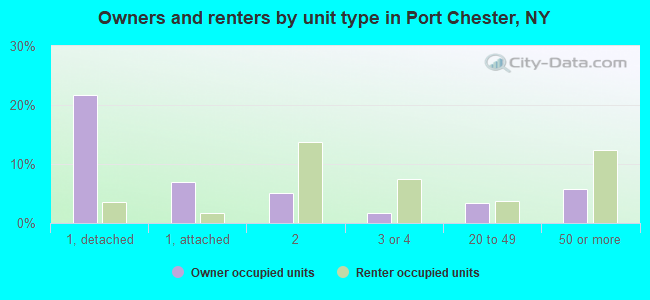
Housing units in structures:
One, detached: 2,659One, attached: 897Two: 2,0063 or 4: 1,1675 to 9: 87210 to 19: 50220 to 49: 65050 or more: 2,077Housing units lacking complete plumbing facilities in 2022: 1.7%Housing units lacking complete kitchen facilities in 2022: 2.3%House/condo owner moved in on average 12 years ago
Renter moved in on average 7 years ago
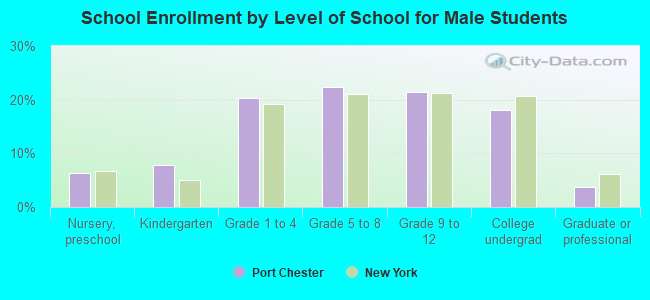
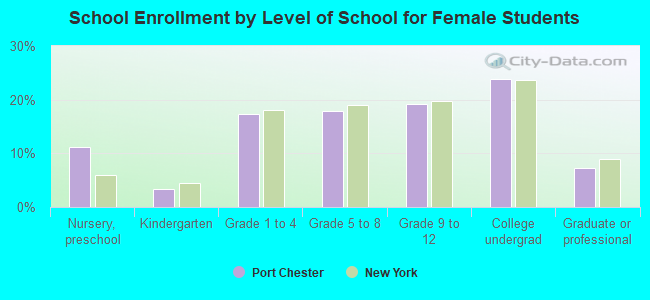
Private vs. public school enrollment:
Students in private schools in grades 1 to 8 (elementary and middle school): 112 Students in private schools in grades 9 to 12 (high school): 91 Students in private undergraduate colleges: 335