Port Huron, MI (Michigan) Houses and Residents
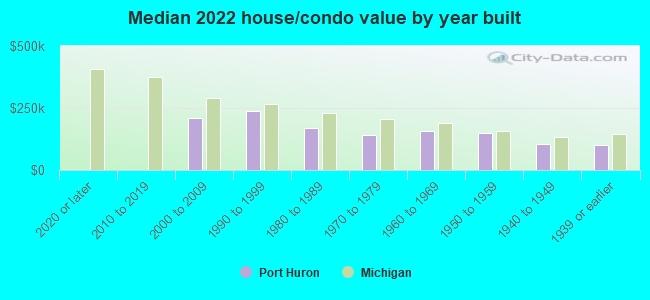
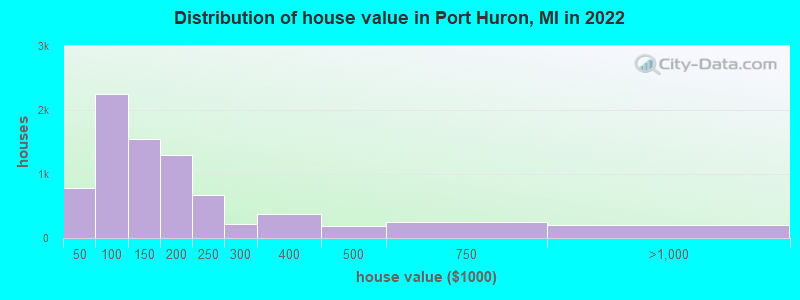
Estimated median house or condo value in 2022: $135,109 (it was $84,800 in 2000 )
Port Huron:
$135,109Michigan:
$224,400
Lower value quartile - upper value quartile: $94,713 - $207,175Mean price in 2022: Detached houses: $165,598 Here:
$165,598State:
$280,038
Townhouses or other attached units: $365,657 Here:
$365,657State:
$239,520
In 2-unit structures: $318,591 Here:
$318,591State:
$219,481
In 3-to-4-unit structures: $117,399 Here:
$117,399State:
$207,067
In 5-or-more-unit structures: $38,324 Here:
$38,324State:
$192,733
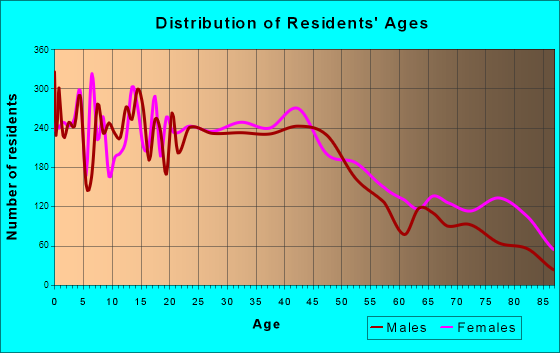
Total population: 29,168 (All urban)
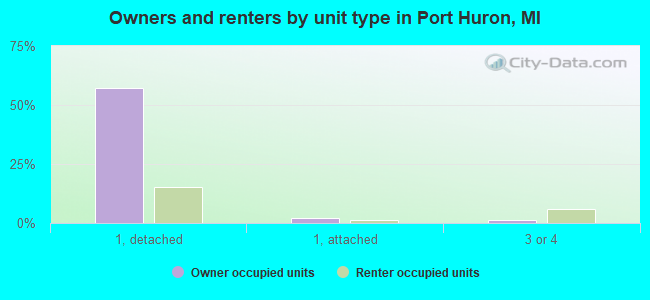
Houses: 13,678 (12,428 occupied: 7,889 owner occupied, 5,018 renter occupied )
% of renters here:
39%State:
27%
Housing density: 1,693 houses/condos per square mile
Median price asked for vacant for-sale houses and condos in 2022: $74,522.
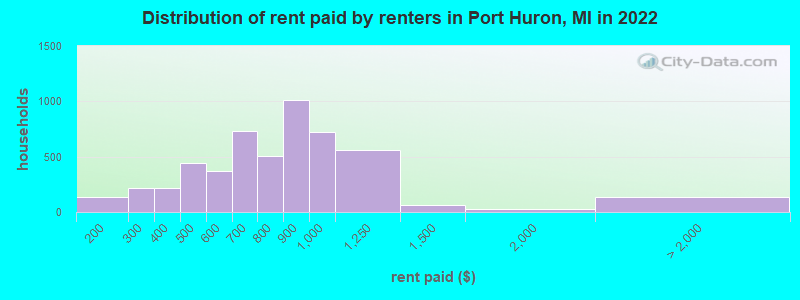
Median contract rent in 2022: $774 (lower quartile is $559, upper quartile is $922)
Median rent asked for vacant for-rent units in 2022: $1,144
Median gross rent in Port Huron, MI in 2022: $999
Housing units in Port Huron with a mortgage: 4,499 (191 second mortgage, 13 home equity loan, 140 both second mortgage and home equity loan )Houses without a mortgage: 50
Median household income for houses/condos with a mortgage: $64,348
Median household income for apartments without a mortgage: $51,982
Median monthly housing costs: $892
Data:
Median house or condo value ($)
Median house or condo value ($ change since 2000)
Median house or condo value ($) - White
Median house or condo value ($) - Black or African American
Median house or condo value ($) - Asian
Median house or condo value ($) - Hispanic or Latino
Median house or condo value ($) - American Indian and Alaska Native
Median house or condo value ($) - Multirace
Median house or condo value ($) - Other Race
Median price asked for mobile homes ($)
Household density (households per square mile)
Mean house or condo value by units in structure - 1, detached ($)
Mean house or condo value by units in structure - 1, attached ($)
Mean house or condo value by units in structure - 2 ($)
Mean house or condo value by units in structure by units in structure - 3 or 4 ($)
Mean house or condo value by units in structure - 5 or more ($)
Mean house or condo value by units in structure - Boat, RV, van, etc. ($)
Mean house or condo value by units in structure - Mobile home ($)
Median contract rent ($)
Median contract rent - Lower quartile ($)
Median contract rent - Upper quartile ($)
Median gross rent ($)
Urban houses (%)
Rural houses (%)
Houses occupied (%)
Houses occupied (% change since 2000)
Houses owner occupied (%)
Houses owner occupied (% change since 2000)
Houses renter occupied (%)
Houses renter occupied (% change since 2000)
Vacant housing units - For rent (%)
Vacant housing units - For rent (% change since 2000)
Vacant housing units - For sale only (%)
Vacant housing units - For sale only (% change since 2000)
Vacant housing units - Rented or sold, not occupied (%)
Vacant housing units - Rented or sold, not occupied (% change since 2000)
Vacant housing units - For seasonal, recreational, or occasional use (%)
Vacant housing units - For seasonal, recreational, or occasional use (% change since 2000)
Vacant housing units - For migrant workers (%)
Vacant housing units - For migrant workers (% change since 2000)
Vacant housing units - Other vacant (%)
Vacant housing units - Other vacant (% change since 2000)
Median monthly housing costs ($)
Median household income for houses/condos with a mortgage ($)
Median household income for houses/condos without a mortgage ($)
Median household income ($)
Median household income ($) - White
Median household income ($) - Black or African American
Median household income ($) - Asian
Median household income ($) - Hispanic or Latino
Median household income ($) - American Indian and Alaska Native
Median household income ($) - Multirace
Median household income ($) - Other Race
Mortgage status - with mortgage (%)
Mortgage status - with second mortgage (%)
Mortgage status - with home equity loan (%)
Mortgage status - with both second mortgage and home equity loan (%)
Mortgage status - without a mortgage (%)
Median year house/condo built
Median year apartment built
Household type by relationship - Male householder living alone (%)
Household type by relationship - Male householder not living alone (%)
Household type by relationship - Female householder living alone (%)
Household type by relationship - Female householder not living alone (%)
Household type by relationship - Opposite-Sex spouse (%)
Household type by relationship - Same-Sex spouse (%)
Household type by relationship - Opposite-Sex unmarried partner (%)
Household type by relationship - Same-Sex unmarried partner (%)
Household type by relationship - In group quarters (%)
Size of family households - 2-person household (%)
Size of family households - 3-person household (%)
Size of family households - 4-person household (%)
Size of family households - 5-person household (%)
Size of family households - 6-person household (%)
Size of family households - 7-or-more-person household (%)
Size of nonfamily households - 1-person household (%)
Size of nonfamily households - 2-person household (%)
Size of nonfamily households - 3-person household (%)
Size of nonfamily households - 4-person household (%)
Size of nonfamily households - 5-person household (%)
Size of nonfamily households - 6-person household (%)
Size of nonfamily households - 7-or-moreperson household (%)
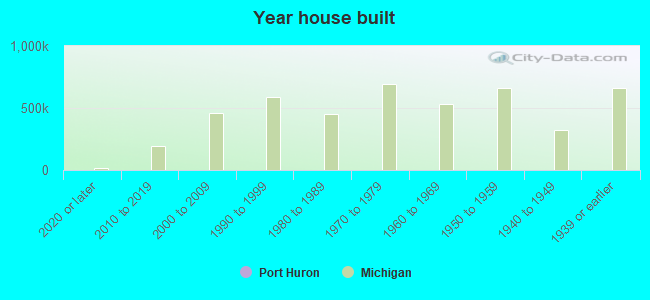
Year house built - Built 2010 or later (%)
Year house built - Built 2000 to 2009 (%)
Year house built - Built 1990 to 1999 (%)
Year house built - Built 1980 to 1989 (%)
Year house built - Built 1970 to 1979 (%)
Year house built - Built 1960 to 1969 (%)
Year house built - Built 1950 to 1959 (%)
Year house built - Built 1940 to 1949 (%)
Year house built - Built 1939 or earlier (%)
Median number of rooms in houses and condos
Median number of rooms in apartments
Median number of bedrooms in owner occupied houses
Mean number of bedrooms in owner occupied houses
Median number of bedrooms in renter occupied houses
Mean number of bedrooms in renter occupied houses
Median number of vehichles in owner occupied houses
Mean number of vehichles in owner occupied houses
Median number of vehichles in renter occupied houses
Mean number of vehichles in renter occupied houses
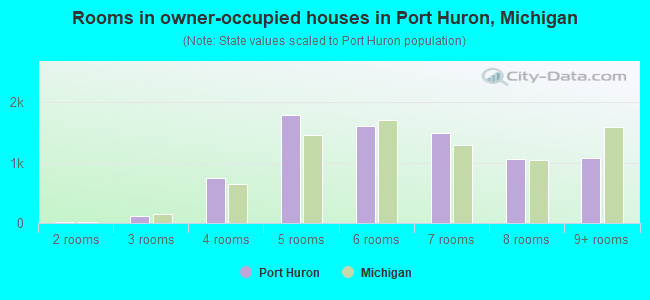
Rooms in owner-occupied houses - 1 room (%)
Rooms in owner-occupied houses - 2 rooms (%)
Rooms in owner-occupied houses - 3 rooms (%)
Rooms in owner-occupied houses - 4 rooms (%)
Rooms in owner-occupied houses - 5 rooms (%)
Rooms in owner-occupied houses - 6 rooms (%)
Rooms in owner-occupied houses - 7 rooms (%)
Rooms in owner-occupied houses - 8 rooms (%)
Rooms in owner-occupied houses - 9+ rooms (%)
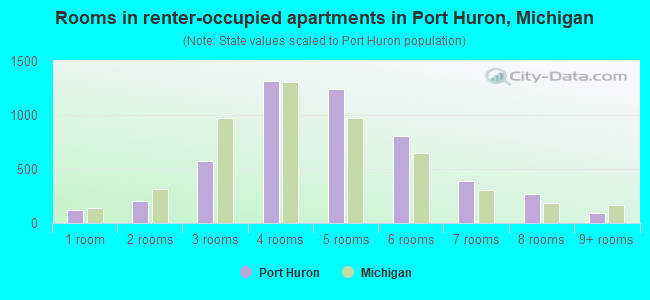
Rooms in renter-occupied houses - 1 room (%)
Rooms in renter-occupied houses - 2 rooms (%)
Rooms in renter-occupied houses - 3 rooms (%)
Rooms in renter-occupied houses - 4 rooms (%)
Rooms in renter-occupied houses - 5 rooms (%)
Rooms in renter-occupied houses - 6 rooms (%)
Rooms in renter-occupied houses - 7 rooms (%)
Rooms in renter-occupied houses - 8 rooms (%)
Rooms in renter-occupied houses - 9+ rooms (%)
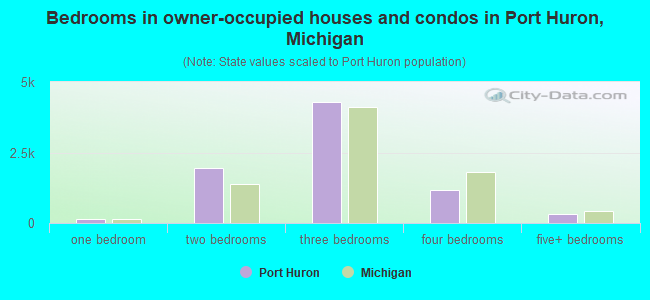
Bedrooms in owner-occupied houses - no bedrooms (%)
Bedrooms in owner-occupied houses - 1 bedroom (%)
Bedrooms in owner-occupied houses - 2 bedrooms (%)
Bedrooms in owner-occupied houses - 3 bedrooms (%)
Bedrooms in owner-occupied houses - 4 bedrooms (%)
Bedrooms in owner-occupied houses - 5+ bedrooms (%)
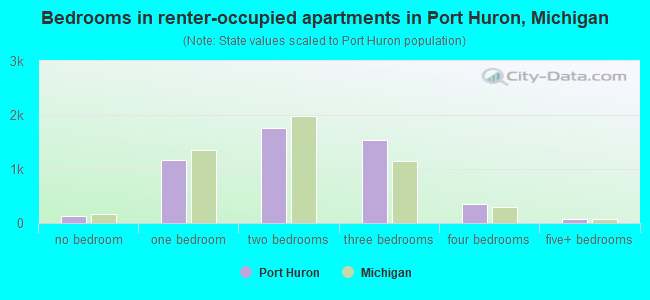
Bedrooms in renter-occupied houses - no bedrooms (%)
Bedrooms in renter-occupied houses - 1 bedroom (%)
Bedrooms in renter-occupied houses - 2 bedrooms (%)
Bedrooms in renter-occupied houses - 3 bedrooms (%)
Bedrooms in renter-occupied houses - 4 bedrooms (%)
Bedrooms in renter-occupied houses - 5+ bedrooms (%)
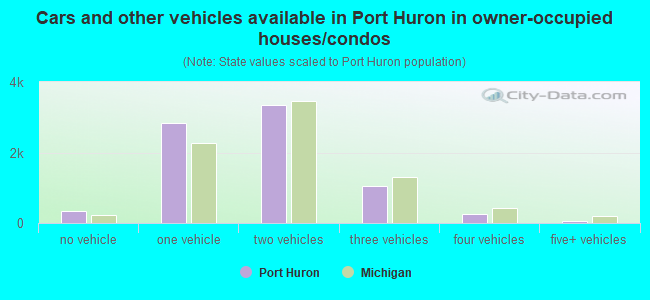
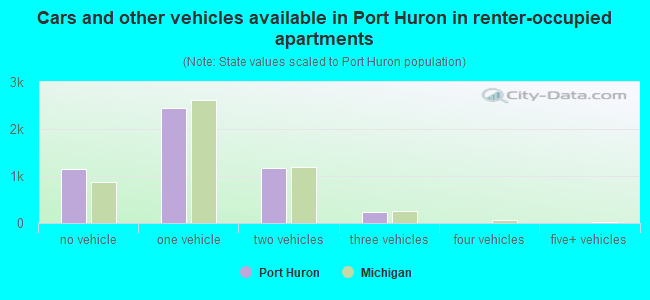
Vehicles available in owner-occupied houses - no vehicle available (%)
Vehicles available in owner-occupied houses - 1 vehicle available(%)
Vehicles available in owner-occupied houses - 2 Vehicles available (%)
Vehicles available in owner-occupied houses - 3 Vehicles available (%)
Vehicles available in owner-occupied houses - 4 Vehicles available (%)
Vehicles available in owner-occupied houses - 5+ Vehicles available (%)
Vehicles available in renter-occupied houses - no vehicle available (%)
Vehicles available in renter-occupied houses - 1 vehicle available (%)
Vehicles available in renter-occupied houses - 2 Vehicles available (%)
Vehicles available in renter-occupied houses - 3 Vehicles available (%)
Vehicles available in renter-occupied houses - 4 Vehicles available (%)
Vehicles available in renter-occupied houses - 5+ Vehicles available (%)
Housing units in structures - 1, detached (%)
Housing units in structures - 1, attached (%)
Housing units in structures - 2 (%)
Housing units in structures - 3 or 4 (%)
Housing units in structures - 5 to 9 (%)
Housing units in structures - 10 to 19 (%)
Housing units in structures - 20 to 49 (%)
Housing units in structures - 50 or more (%)
Housing units in structures - Mobile home (%)
Housing units in structures - Boat, RV, van, etc. (%)
Housing units in structures - Owners - 1, detached (%)
Housing units in structures - Owners - 1, attached (%)
Housing units in structures - Owners - 2 (%)
Housing units in structures - Owners - 3 or 4 (%)
Housing units in structures - Owners - 5 to 9 (%)
Housing units in structures - Owners - 10 to 19 (%)
Housing units in structures - Owners - 20 to 49 (%)
Housing units in structures - Owners - 50 or more (%)
Housing units in structures - Owners - Mobile home (%)
Housing units in structures - Owners - Boat, RV, van, etc. (%)
Housing units in structures - Renters - 1, detached (%)
Housing units in structures - Renters - 1, attached (%)
Housing units in structures - Renters - 2 (%)
Housing units in structures - Renters - 3 or 4 (%)
Housing units in structures - Renters - 5 to 9 (%)
Housing units in structures - Renters - 10 to 19 (%)
Housing units in structures - Renters - 20 to 49 (%)
Housing units in structures - Renters - 50 or more (%)
Housing units in structures - Renters - Mobile home (%)
Housing units in structures - Renters - Boat, RV, van, etc. (%)
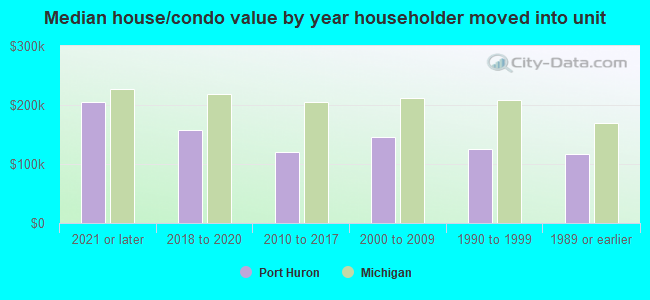
House/condo owner moved in on average (years ago)
Renter moved in on average (years ago)
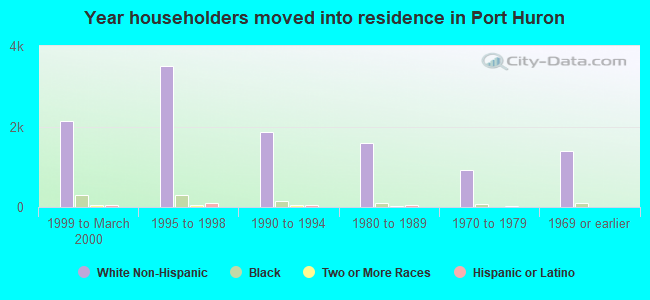
Year householder moved into unit - Moved in 1999 to March 2000 (%)
Year householder moved into unit - Moved in 1999 to March 2000 (%) - White
Year householder moved into unit - Moved in 1999 to March 2000 (%) - Black or African American
Year householder moved into unit - Moved in 1999 to March 2000 (%) - Asian
Year householder moved into unit - Moved in 1999 to March 2000 (%) - Hispanic or Latino
Year householder moved into unit - Moved in 1999 to March 2000 (%) - American Indian and Alaska Native
Year householder moved into unit - Moved in 1999 to March 2000 (%) - Multirace
Year householder moved into unit - Moved in 1999 to March 2000 (%) - Other Race
Year householder moved into unit - Moved in 1995 to 1998 (%)
Year householder moved into unit - Moved in 1995 to 1998 (%) - White
Year householder moved into unit - Moved in 1995 to 1998 (%) - Black or African American
Year householder moved into unit - Moved in 1995 to 1998 (%) - Asian
Year householder moved into unit - Moved in 1995 to 1998 (%) - Hispanic or Latino
Year householder moved into unit - Moved in 1995 to 1998 (%) - American Indian and Alaska Native
Year householder moved into unit - Moved in 1995 to 1998 (%) - Multirace
Year householder moved into unit - Moved in 1995 to 1998 (%) - Other Race
Year householder moved into unit - Moved in 1990 to 1994 (%)
Year householder moved into unit - Moved in 1990 to 1994 (%) - White
Year householder moved into unit - Moved in 1990 to 1994 (%) - Black or African American
Year householder moved into unit - Moved in 1990 to 1994 (%) - Asian
Year householder moved into unit - Moved in 1990 to 1994 (%) - Hispanic or Latino
Year householder moved into unit - Moved in 1990 to 1994 (%) - American Indian and Alaska Native
Year householder moved into unit - Moved in 1990 to 1994 (%) - Multirace
Year householder moved into unit - Moved in 1990 to 1994 (%) - Other Race
Year householder moved into unit - Moved in 1980 to 1989 (%)
Year householder moved into unit - Moved in 1980 to 1989 (%) - White
Year householder moved into unit - Moved in 1980 to 1989 (%) - Black or African American
Year householder moved into unit - Moved in 1980 to 1989 (%) - Asian
Year householder moved into unit - Moved in 1980 to 1989 (%) - Hispanic or Latino
Year householder moved into unit - Moved in 1980 to 1989 (%) - American Indian and Alaska Native
Year householder moved into unit - Moved in 1980 to 1989 (%) - Multirace
Year householder moved into unit - Moved in 1980 to 1989 (%) - Other Race
Year householder moved into unit - Moved in 1970 to 1979 (%)
Year householder moved into unit - Moved in 1970 to 1979 (%) - White
Year householder moved into unit - Moved in 1970 to 1979 (%) - Black or African American
Year householder moved into unit - Moved in 1970 to 1979 (%) - Asian
Year householder moved into unit - Moved in 1970 to 1979 (%) - Hispanic or Latino
Year householder moved into unit - Moved in 1970 to 1979 (%) - American Indian and Alaska Native
Year householder moved into unit - Moved in 1970 to 1979 (%) - Multirace
Year householder moved into unit - Moved in 1970 to 1979 (%) - Other Race
Year householder moved into unit - Moved in 1969 or earlier (%)
Year householder moved into unit - Moved in 1969 or earlier (%) - White
Year householder moved into unit - Moved in 1969 or earlier (%) - Black or African American
Year householder moved into unit - Moved in 1969 or earlier (%) - Asian
Year householder moved into unit - Moved in 1969 or earlier (%) - Hispanic or Latino
Year householder moved into unit - Moved in 1969 or earlier (%) - American Indian and Alaska Native
Year householder moved into unit - Moved in 1969 or earlier (%) - Multirace
Year householder moved into unit - Moved in 1969 or earlier (%) - Other Race
Housing units lacking complete plumbing facilities (%)
Housing units lacking complete kitchen facilities (%)
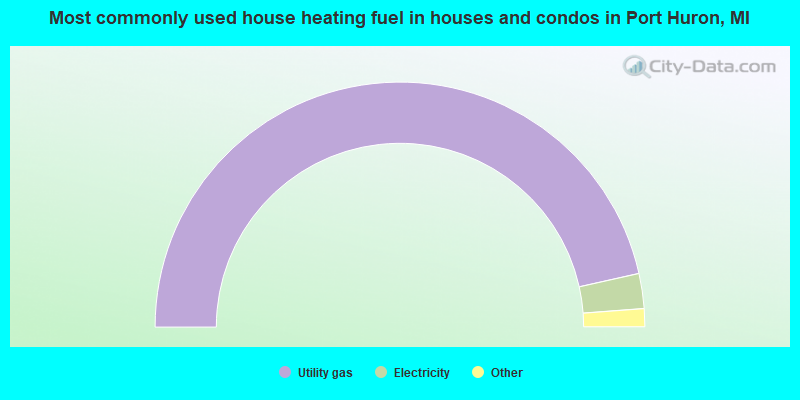
House heating fuel used in houses and condos - Utility gas (%)
House heating fuel used in houses and condos - Bottled, tank, or LP gas (%)
House heating fuel used in houses and condos - Electricity (%)
House heating fuel used in houses and condos - Fuel oil, kerosene, etc. (%)
House heating fuel used in houses and condos - Coal or coke (%)
House heating fuel used in houses and condos - Wood (%)
House heating fuel used in houses and condos - Solar energy (%)
House heating fuel used in houses and condos - Other fuel (%)
House heating fuel used in houses and condos - No fuel used (%)
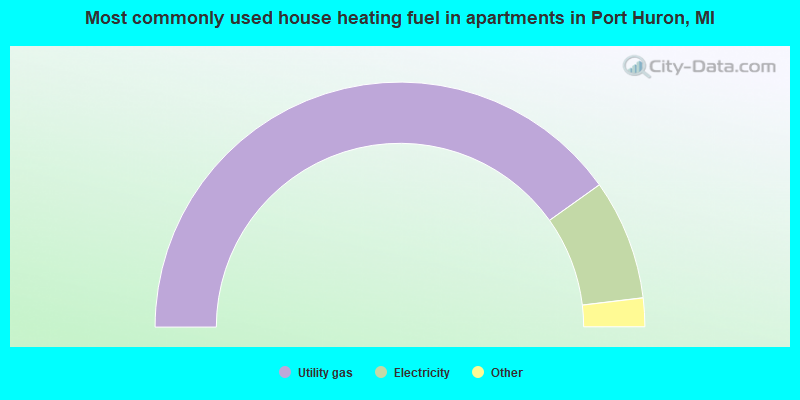
House heating fuel used in apartments - Utility gas (%)
House heating fuel used in apartments - Bottled, tank, or LP gas (%)
House heating fuel used in apartments - Electricity (%)
House heating fuel used in apartments - Fuel oil, kerosene, etc. (%)
House heating fuel used in apartments - Coal or coke (%)
House heating fuel used in apartments - Wood (%)
House heating fuel used in apartments - Solar energy (%)
House heating fuel used in apartments - Other fuel (%)
House heating fuel used in apartments - No fuel used (%)
Median year house/condo built: 1954Median year apartment built: 1954Household type by relationship:
Households: 28,861
Male householders: 5,059 (1,668 living alone ), Female householders: 7,257 (2,273 living alone )4,110 spouses (4,050 opposite-sex spouses ), 1,437 unmarried partners , (1,369 opposite-sex unmarried partners ), 8,252 children (7,678 natural , 145 adopted , 427 stepchildren ), 591 grandchildren , 328 brothers or sisters , 143 parents , 90 foster children , 253 other relatives , 892 non-relatives In group quarters: 443
Size of family households: 3,647 2-persons , 1,582 3-persons , 1,268 4-persons , 688 5-persons , 179 6-persons , 265 7-or-more-persons .
Size of nonfamily households: 4,262 1-person , 891 2-persons , 97 3-persons , 46 4-persons , 5 5-persons , 5 6-persons .
2,494 married couples with children. single-parent households (647 men , 2,137 women ).
96.7% of residents of Port Huron speak English at home. of residents speak Spanish at home (76% speak English very well , 17% speak English well , 4% speak English not well , 3% don't speak English at all ).of residents speak other Indo-European language at home (87% speak English very well , 13% speak English well ).of residents speak Asian or Pacific Island language at home (72% speak English very well , 11% speak English well , 13% speak English not well , 4% don't speak English at all ).of residents speak other language at home (40% speak English very well , 24% speak English not well , 36% don't speak English at all ).
Foreign born population: 626 (2.2%)of them are naturalized citizens )
Median number of rooms in houses and condos:
Median number of rooms in apartments
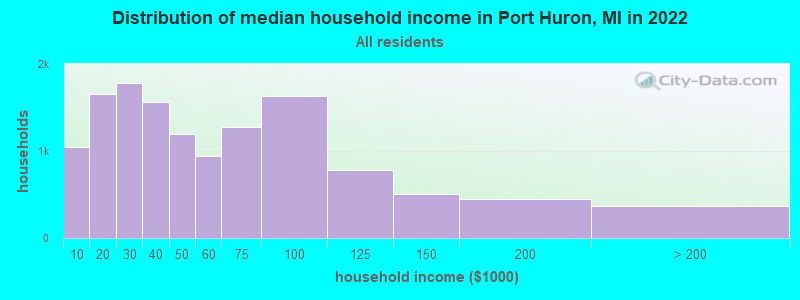
Port Huron, MI household income distribution 1,051 Less than $10,0001,651 $10,000 to $19,9991,779 $20,000 to $29,9991,568 $30,000 to $39,9991,195 $40,000 to $49,999941 $50,000 to $59,9991,275 $60,000 to $74,9991,637 $75,000 to $99,999781 $100,000 to $124,999503 $125,000 to $149,999445 $150,000 to $199,999367 $200,000 or more
Home value of owner - occupied houses in 2022 in Port Huron, MI 56 Less than $10,00013 $10,000 to $14,99914 $15,000 to $19,9998 $20,000 to $24,99931 $25,000 to $29,99985 $30,000 to $34,99957 $35,000 to $39,999519 $40,000 to $49,999161 $50,000 to $59,999268 $60,000 to $69,999318 $70,000 to $79,999585 $80,000 to $89,999394 $90,000 to $99,9991,042 $100,000 to $124,999504 $125,000 to $149,999782 $150,000 to $174,999518 $175,000 to $199,999669 $200,000 to $249,999222 $250,000 to $299,999374 $300,000 to $399,999181 $400,000 to $499,999256 $500,000 to $749,999192 $750,000 to $999,99911 $2,000,000 or moreRent paid by renters in 2022 in Port Huron, MI 47 $100 to $14984 $150 to $199142 $200 to $24977 $250 to $299109 $300 to $349110 $350 to $399124 $400 to $449318 $450 to $499212 $500 to $549155 $550 to $599369 $600 to $649363 $650 to $699315 $700 to $749191 $750 to $7991,014 $800 to $899721 $900 to $999561 $1,000 to $1,24964 $1,250 to $1,49927 $1,500 to $1,999137 No cash rent
Percentage of workers working in this county: 83.9%Number of people working at home: 747 (6.0% of all workers )
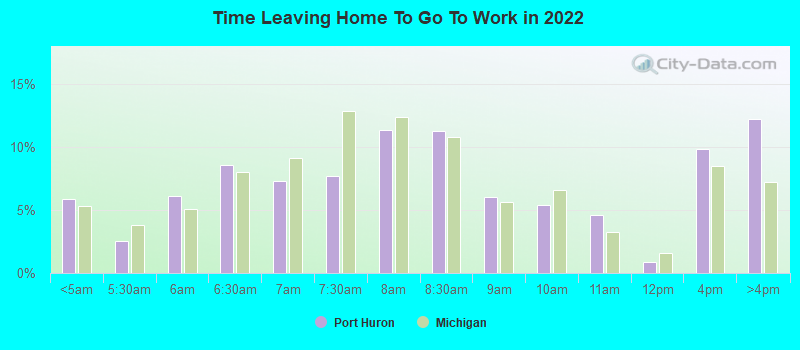
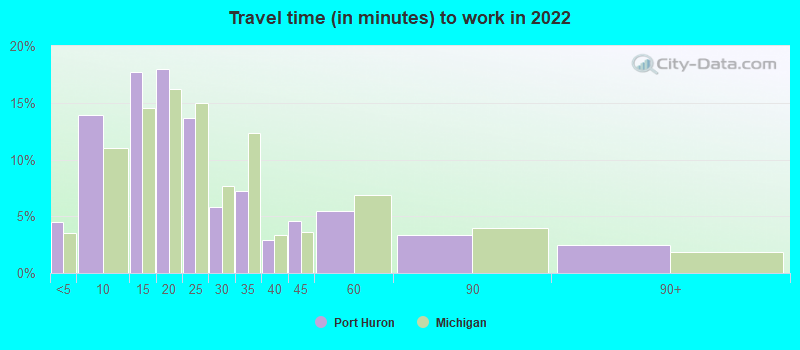
Travel time to work (commute)
Less than 5 minutes: 6725 to 9 minutes: 2,12710 to 14 minutes: 2,38015 to 19 minutes: 1,91820 to 24 minutes: 1,38025 to 29 minutes: 43030 to 34 minutes: 77535 to 39 minutes: 6540 to 44 minutes: 28945 to 59 minutes: 55260 to 89 minutes: 96690 or more minutes: 259
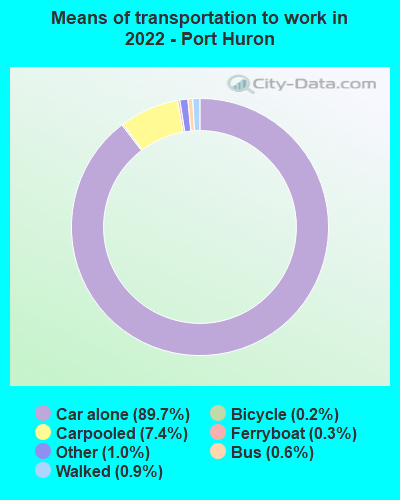
Means of transportation to work:
Drove a car alone: 13,408 (83.1%)Carpooled: 1,112 (6.9%)Bus : 71 (0.4%)Ferryboat: 47 (0.3%)Taxi: 180 (1.1%)Bicycle: 31 (0.2%)Walked: 137 (0.8%)Worked at home: 747 (4.6%)
Unemployment by race in 2022
Unemployment rate for White non-Hispanic residents 9.3% Males5.1% FemalesUnemployment rate for Black residents 15.7% Males2.6% FemalesUnemployment rate for American Indian and Alaska Native residents 10.1% MalesUnemployment rate for two or more race residents 4.2% Males5.1% FemalesUnemployment rate for Hispanic or Latino residents 11.3% Males5.4% Females
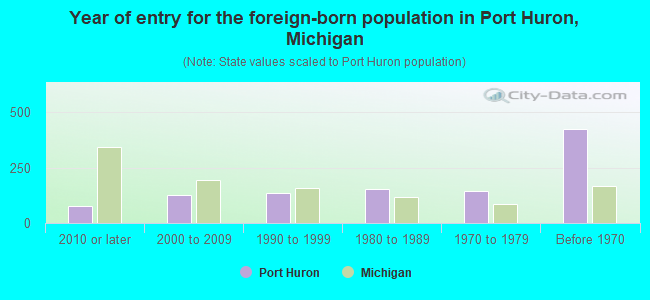
Year of entry for the foreign-born population in Port Huron, Michigan
79 2010 or later 125 2000 to 2009 135 1990 to 1999 153 1980 to 1989 146 1970 to 1979 425 Before 1970
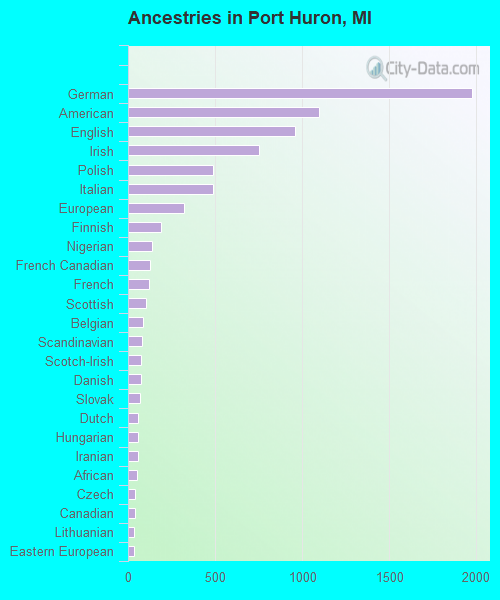
First ancestries reported:
German: 1,974 (18.5%)
American: 1,094 (10.2%)
English: 961 (9.0%)
Irish: 754 (7.1%)
Polish: 487 (4.6%)
Italian: 487 (4.6%)
European: 319 (3.0%)
Finnish: 190 (1.8%)
Nigerian: 135 (1.3%)
French Canadian: 129 (1.2%)
French: 123 (1.2%)
Scottish: 105 (1.0%)
Belgian: 88 (0.8%)
Scandinavian: 79 (0.7%)
Scotch-Irish: 77 (0.7%)
Danish: 75 (0.7%)
Slovak: 69 (0.6%)
Dutch: 59 (0.6%)
Hungarian: 58 (0.5%)
Iranian: 58 (0.5%)
African: 53 (0.5%)
Czech: 38 (0.4%)
Canadian: 38 (0.4%)
Lithuanian: 36 (0.3%)
Eastern European: 32 (0.3%)
British: 25 (0.2%)
Swedish: 23 (0.2%)
Russian: 22 (0.2%)
Norwegian: 16 (0.1%)
Swiss: 16 (0.1%)
Yugoslavian: 14 (0.1%)
Greek: 10 (0.09%)
Northern European: 9 (0.08%)
Lebanese: 9 (0.08%)
Jamaican: 8 (0.07%)
Austrian: 5 (0.05%)
Iraqi: 5 (0.05%) Most common places of birth for foreign-born residents (%): Canada Port Huron:
32.2% (220)Michigan:
5.0% (35,052)
Philippines Port Huron:
14.3% (98)Michigan:
2.8% (19,112)
Indonesia Port Huron:
6.3% (43)Michigan:
0.2% (1,184)
Honduras Port Huron:
5.9% (40)Michigan:
0.5% (3,798)
Cuba Port Huron:
5.6% (38)Michigan:
0.9% (6,481)
Mexico Port Huron:
5.0% (34)Michigan:
10.9% (75,965)
Iran Port Huron:
4.8% (33)Michigan:
0.6% (4,245)
Russia Port Huron:
3.7% (25)Michigan:
0.9% (6,326)
Pakistan Port Huron:
3.1% (21)Michigan:
1.5% (10,596)
Iraq Port Huron:
2.6% (18)Michigan:
8.1% (55,954)
Netherlands Port Huron:
2.3% (16)Michigan:
0.5% (3,681)
Brazil Port Huron:
1.9% (13)Michigan:
1.1% (7,485)
Colombia Port Huron:
1.9% (13)Michigan:
0.6% (3,969)
India Port Huron:
1.8% (12)Michigan:
11.1% (77,240)
China, excluding Hong Kong and Taiwan Port Huron:
1.6% (11)Michigan:
4.9% (34,295)
Place of birth for U.S.-born residents:
This state: 25,220Other state: 2,771Northeast: 306Midwest: 977South: 807West: 661 81.9% of Port Huron residents lived in the same house 1 years ago.
Out of people who lived in different houses, 39.7% lived in this county.
Out of people who lived in different counties, 80.5% lived in Michigan.
Port Huron:
81.9%State average:
88.4%
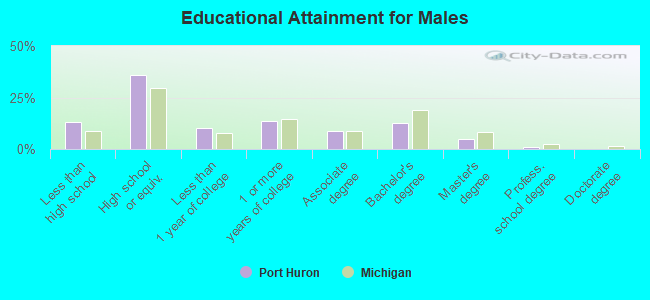
Education attainment for males 25 years and older:
No schooling: 183Nursery to 4th grade: 155th and 6th grade: 307th and 8th grade: 1799th grade: 8110th grade: 23511th grade: 29112th grade, no diploma: 201High school graduate (or equivalency): 3,373Less than 1 year of college: 952Some college more than 1 year, no degree: 1,274Associate degree: 824Bachelor's degree: 1,164Master's degree: 434Professional school degree: 82Doctorate degree: 20
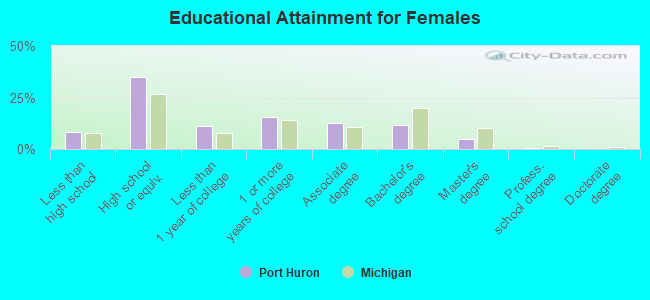
Education attainment for females 25 years and older:
No schooling: 36Nursery to 4th grade: 05th and 6th grade: 27th and 8th grade: 959th grade: 5310th grade: 21111th grade: 33612th grade, no diploma: 160High school graduate (or equivalency): 3,753Less than 1 year of college: 1,196Some college more than 1 year, no degree: 1,686Associate degree: 1,340Bachelor's degree: 1,276Master's degree: 537Professional school degree: 76Doctorate degree: 16
Housing units in structures:
One, detached: 9,759One, attached: 509Two: 9203 or 4: 7425 to 9: 59210 to 19: 28320 to 49: 22550 or more: 568Mobile homes: 71Boats, RVs, vans, etc.: 5Housing units lacking complete plumbing facilities in 2022: 1.4%Housing units lacking complete kitchen facilities in 2022: 4.2%House/condo owner moved in on average 11 years ago
Renter moved in on average 3 years ago
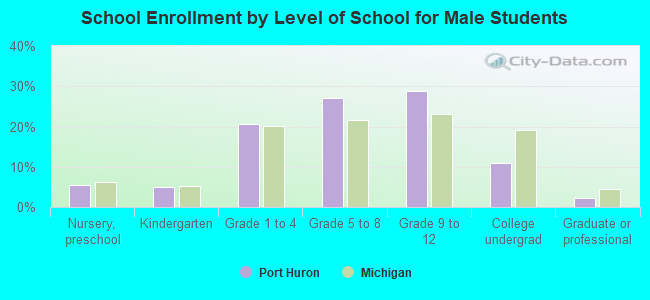
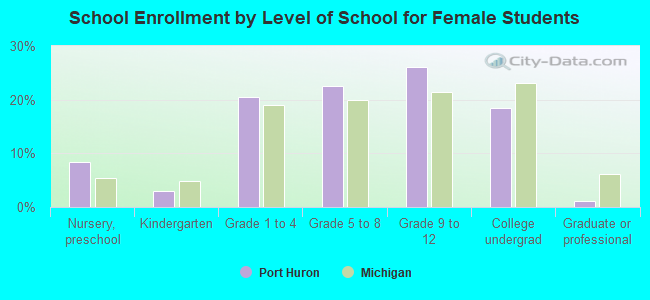
Private vs. public school enrollment:
Students in private schools in grades 1 to 8 (elementary and middle school): 177 Students in private schools in grades 9 to 12 (high school): 99 Students in private undergraduate colleges: 136