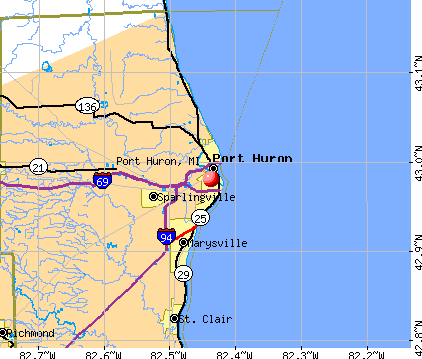
Port Huron, Michigan
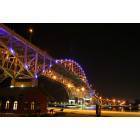
Port Huron: Blue Water Bridge at night
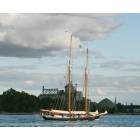
Port Huron: Highlander Sea on St. Clair River, Port Huron, MI
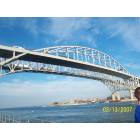
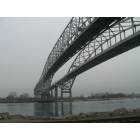
Port Huron: The Blue Water Bridges in early March 07
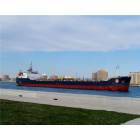
Port Huron: Freighter passing through on the Black River
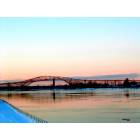
Port Huron: Blue Water Bridge
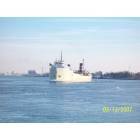
Port Huron: Early March, first nice day, picture of a ship near Blue Water Bridges
Port Huron: Black River as it runs through Port Huron
Port Huron: Under the Blue Water Bridges
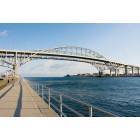
Port Huron: Blue Water Bridge
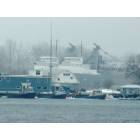
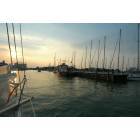
Port Huron: freighters docked for the Winter
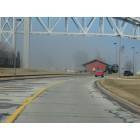
Port Huron: Fog rolling in by the Blue Water Bridges and the Edison Depot
- see
26
more - add
your
Submit your own pictures of this city and show them to the world
- OSM Map
- General Map
- Google Map
- MSN Map
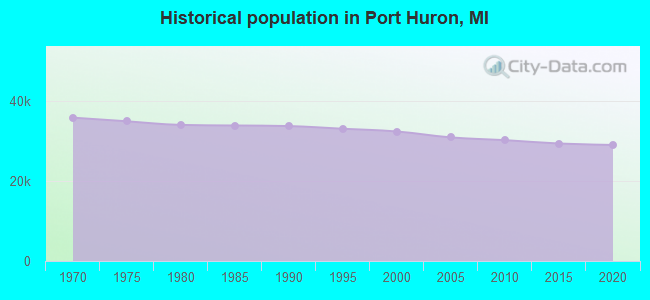
Population change since 2000: -11.5%
 |
| Males: 13,992 | |
| Females: 14,634 |
| Median resident age: | 38.5 years |
| Michigan median age: | 40.3 years |
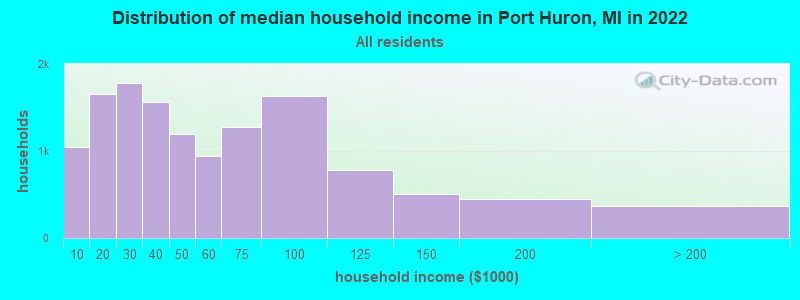
| Port Huron: | $45,487 |
| MI: | $66,986 |
Estimated per capita income in 2022: $26,111 (it was $17,100 in 2000)
Port Huron city income, earnings, and wages data
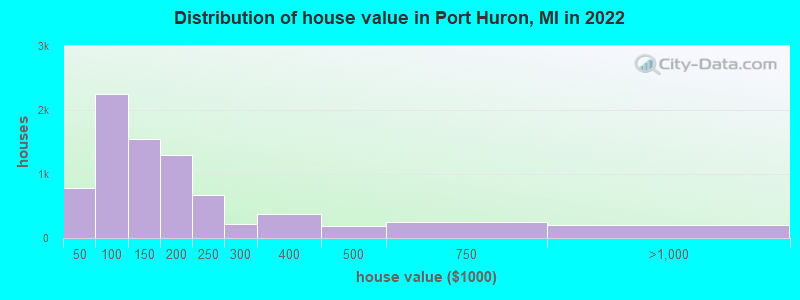
Estimated median house or condo value in 2022: $135,109 (it was $84,800 in 2000)
| Port Huron: | $135,109 |
| MI: | $224,400 |
Mean prices in 2022: all housing units: $170,731; detached houses: $165,598; townhouses or other attached units: $365,657; in 2-unit structures: $318,591; in 3-to-4-unit structures: $117,399; in 5-or-more-unit structures: $38,324
Median gross rent in 2022: $999.
(21.1% for White Non-Hispanic residents, 28.2% for Black residents, 22.7% for Hispanic or Latino residents, 22.1% for American Indian residents, 14.0% for other race residents, 26.2% for two or more races residents)
Detailed information about poverty and poor residents in Port Huron, MI


Compare current foreclosures in Port Huron, MI:
| Photo | Address | Area | Beds / Baths | Price | Details |
|---|---|---|---|---|---|

|
#1
Woodland Ct
Port Huron, MI 48060
|
1,500 sq. feet
|
1 baths 2 beds |
show details | |

|
#2
Lewis Dr
Port Huron, MI 48060
|
1,196 sq. feet
|
1 baths 3 beds |
show details | |

|
#3
Sanborn St
Port Huron, MI 48060
|
1,241 sq. feet
|
2 baths 5 beds |
show details | |

|
#4
North Blvd
Port Huron, MI 48060
|
1,148 sq. feet
|
1 baths 3 beds |
show details | |

|
#5
Botsford St
Port Huron, MI 48060
|
1,326 sq. feet
|
1 baths 3 beds |
show details | |

|
#6
Maes Dr
Port Huron, MI 48060
|
1,340 sq. feet
|
1 baths 3 beds |
show details | |

|
#7
Gratiot Ave
Port Huron, MI 48060
|
1,260 sq. feet
|
1 baths 3 beds |
show details | |

|
#8
17th St
Port Huron, MI 48060
|
- sq. feet
|
1 baths 2 beds |
show details | |

|
#9
Gillett St
Port Huron, MI 48060
|
- sq. feet
|
1 baths 3 beds |
show details | |

|
#10
Jenkinson St
Port Huron, MI 48060
|
- sq. feet
|
1 baths 3 beds |
show details |
| Photo | Address | Area | Beds / Baths | Price | Details |
|---|---|---|---|---|---|

|
#11
W Water St Apt B
Port Huron, MI 48060
|
- sq. feet
|
- baths - beds |
show details | |

|
#12
14th St
Port Huron, MI 48060
|
- sq. feet
|
- baths - beds |
show details | |

|
#13
Dove Rd Lot 55
Port Huron, MI 48060
|
- sq. feet
|
- baths - beds |
show details | |

|
#14
W Water St
Port Huron, MI 48060
|
- sq. feet
|
- baths - beds |
show details | |

|
#15
22nd St Apt 34
Port Huron, MI 48060
|
- sq. feet
|
- baths - beds |
show details | |

|
#16
Highland Ct
Port Huron, MI 48060
|
- sq. feet
|
- baths - beds |
show details | |

|
#17
Larchwood Dr
Port Huron, MI 48060
|
- sq. feet
|
- baths - beds |
show details | |

|
#18
Hopps Rd
Port Huron, MI 48060
|
- sq. feet
|
- baths - beds |
show details | |

|
#19
Lyon St # A
Port Huron, MI 48060
|
- sq. feet
|
- baths - beds |
show details | |

|
#20
Forest St
Port Huron, MI 48060
|
- sq. feet
|
- baths - beds |
show details |
| Photo | Address | Area | Beds / Baths | Price | Details |
|---|---|---|---|---|---|

|
#21
13th St
Port Huron, MI 48060
|
- sq. feet
|
- baths - beds |
show details | |

|
#22
8th St
Port Huron, MI 48060
|
- sq. feet
|
- baths - beds |
show details | |

|
#23
Wells St
Port Huron, MI 48060
|
- sq. feet
|
- baths - beds |
show details | |

|
#24
Campau Ave
Port Huron, MI 48060
|
- sq. feet
|
- baths - beds |
show details | |

|
#25
Krafft Rd Apt 605
Port Huron, MI 48060
|
- sq. feet
|
- baths - beds |
show details | |

|
#26
Nelson St
Port Huron, MI 48060
|
- sq. feet
|
- baths - beds |
show details | |

|
#27
E Village Ln
Port Huron, MI 48060
|
- sq. feet
|
- baths - beds |
show details | |

|
#28
W Water St Apt A
Port Huron, MI 48060
|
- sq. feet
|
- baths - beds |
show details | |

|
#29
Dorchester Apt 251
Port Huron, MI 48060
|
- sq. feet
|
- baths - beds |
show details | |

|
#30
Court St
Port Huron, MI 48060
|
- sq. feet
|
- baths - beds |
show details |
| Photo | Address | Area | Beds / Baths | Price | Details |
|---|---|---|---|---|---|

|
#31
Huron Ave # 314a
Port Huron, MI 48060
|
- sq. feet
|
- baths - beds |
show details | |

|
#32
10th St
Port Huron, MI 48060
|
- sq. feet
|
- baths - beds |
show details | |

|
#33
6th St Apt 5
Port Huron, MI 48060
|
- sq. feet
|
- baths - beds |
show details | |

|
#34
Riverview St
Port Huron, MI 48060
|
- sq. feet
|
- baths - beds |
show details | |

|
#35
Parkdale Dr
Port Huron, MI 48060
|
- sq. feet
|
- baths - beds |
show details | |

|
#36
Beach Rd Apt 7
Port Huron, MI 48060
|
- sq. feet
|
- baths - beds |
show details | |

|
#37
Rural St
Port Huron, MI 48060
|
- sq. feet
|
- baths - beds |
show details | |

|
#38
Electric Ave Apt 2
Port Huron, MI 48060
|
- sq. feet
|
- baths - beds |
show details | |

|
#39
Rural St
Port Huron, MI 48060
|
- sq. feet
|
- baths - beds |
show details | |

|
#40
Dorchester Apt 233
Port Huron, MI 48060
|
- sq. feet
|
- baths - beds |
show details |
| Photo | Address | Area | Beds / Baths | Price | Details |
|---|---|---|---|---|---|

|
#41
Dove Rd Lot 76
Port Huron, MI 48060
|
- sq. feet
|
- baths - beds |
show details | |

|
#42
Court St
Port Huron, MI 48060
|
- sq. feet
|
- baths - beds |
show details | |

|
#43
16th St
Port Huron, MI 48060
|
- sq. feet
|
- baths - beds |
show details | |

|
#44
Minnie St
Port Huron, MI 48060
|
- sq. feet
|
- baths - beds |
show details | |

|
#45
Sharon Ln
Port Huron, MI 48060
|
- sq. feet
|
- baths - beds |
show details | |

|
#46
North Blvd
Port Huron, MI 48060
|
- sq. feet
|
- baths - beds |
show details | |

|
#47
Military St
Port Huron, MI 48060
|
- sq. feet
|
- baths - beds |
show details | |

|
#48
Wright St
Port Huron, MI 48060
|
- sq. feet
|
- baths - beds |
show details | |

|
#49
Bancroft St
Port Huron, MI 48060
|
- sq. feet
|
- baths - beds |
show details | |

|
Check over 1 million property listings on Foreclosure.com!
|
browse all offers | |||


- 22,22977.0%White alone
- 2,3648.2%Black alone
- 2,1907.6%Hispanic
- 2,0647.2%Two or more races
- 1980.7%Asian alone
- 1100.4%American Indian alone
- 820.3%Other race alone
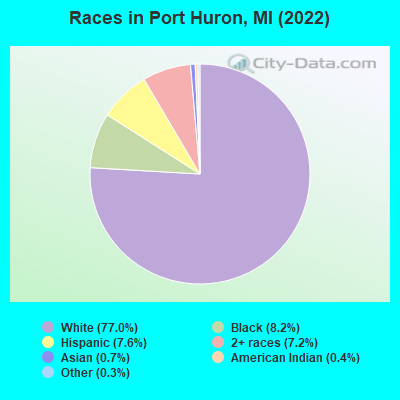
Races in Port Huron detailed stats: ancestries, foreign born residents, place of birth
According to our research of Michigan and other state lists, there were 312 registered sex offenders living in Port Huron, Michigan as of April 29, 2024.
The ratio of all residents to sex offenders in Port Huron is 94 to 1.
Type |
2009 |
2010 |
2011 |
2012 |
2013 |
2014 |
2015 |
2016 |
2017 |
2018 |
2019 |
2020 |
2021 |
2022 |
|---|---|---|---|---|---|---|---|---|---|---|---|---|---|---|
| Murders (per 100,000) | 2 (6.5) | 3 (9.9) | 0 (0.0) | 1 (3.3) | 3 (10.2) | 1 (3.4) | 2 (6.9) | 1 (3.4) | 0 (0.0) | 1 (3.5) | 2 (6.9) | 1 (3.5) | 1 (3.5) | 1 (3.5) |
| Rapes (per 100,000) | 16 (52.1) | 9 (29.8) | 13 (43.1) | 13 (43.4) | 25 (84.6) | 18 (61.8) | 33 (114.0) | 49 (167.9) | 38 (130.6) | 37 (128.0) | 29 (100.8) | 34 (118.9) | 34 (119.4) | 42 (146.5) |
| Robberies (per 100,000) | 55 (179.0) | 54 (178.9) | 32 (106.1) | 47 (156.9) | 31 (104.9) | 40 (137.2) | 30 (103.6) | 24 (82.2) | 20 (68.7) | 18 (62.3) | 26 (90.3) | 18 (62.9) | 13 (45.6) | 8 (27.9) |
| Assaults (per 100,000) | 135 (439.5) | 132 (437.3) | 147 (487.4) | 145 (484.1) | 120 (406.2) | 163 (559.3) | 213 (735.9) | 207 (709.3) | 209 (718.4) | 174 (601.9) | 165 (573.3) | 176 (615.3) | 178 (624.8) | 156 (544.0) |
| Burglaries (per 100,000) | 313 (1,019) | 336 (1,113) | 295 (978.1) | 307 (1,025) | 226 (765.0) | 209 (717.1) | 201 (694.4) | 201 (688.8) | 145 (498.4) | 158 (546.6) | 124 (430.8) | 124 (433.5) | 104 (365.1) | 118 (411.5) |
| Thefts (per 100,000) | 973 (3,168) | 786 (2,604) | 746 (2,473) | 856 (2,858) | 633 (2,143) | 596 (2,045) | 508 (1,755) | 510 (1,748) | 493 (1,695) | 543 (1,878) | 493 (1,713) | 473 (1,654) | 407 (1,429) | 418 (1,458) |
| Auto thefts (per 100,000) | 67 (218.1) | 66 (218.7) | 48 (159.1) | 40 (133.6) | 53 (179.4) | 39 (133.8) | 27 (93.3) | 38 (130.2) | 37 (127.2) | 50 (173.0) | 47 (163.3) | 41 (143.3) | 31 (108.8) | 36 (125.5) |
| Arson (per 100,000) | 11 (35.8) | 13 (43.1) | 14 (46.4) | 4 (13.4) | 4 (13.5) | 10 (34.3) | 15 (51.8) | 14 (48.0) | 5 (17.2) | 12 (41.5) | 9 (31.3) | 12 (42.0) | 9 (31.6) | 6 (20.9) |
| City-Data.com crime index | 411.8 | 384.4 | 343.9 | 382.1 | 354.3 | 352.0 | 409.6 | 436.3 | 381.7 | 375.6 | 348.0 | 352.0 | 332.6 | 338.5 |
The City-Data.com crime index weighs serious crimes and violent crimes more heavily. Higher means more crime, U.S. average is 246.1. It adjusts for the number of visitors and daily workers commuting into cities.
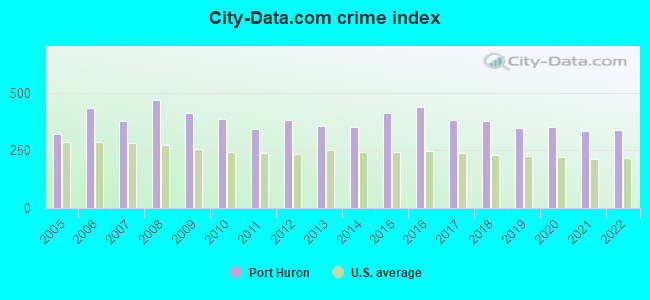
Crime rate in Port Huron detailed stats: murders, rapes, robberies, assaults, burglaries, thefts, arson
Full-time law enforcement employees in 2021, including police officers: 62 (54 officers - 46 male; 8 female).
| Officers per 1,000 residents here: | 1.90 |
| Michigan average: | 1.86 |
 Recent articles from our blog. Our writers, many of them Ph.D. graduates or candidates, create easy-to-read articles on a wide variety of topics.

 | Ranking small, stand-alone cities (20-50k) (11 replies) |
| Port Huron State of Mind (11 replies) |
| First time in Michigan recommendations (19 replies) |
| Orlando, Florida to Port Huron, Michigan (0 replies) |
| Bay City info? (17 replies) |
| Why do people bash Port Huron? (24 replies) |
Latest news from Port Huron, MI collected exclusively by city-data.com from local newspapers, TV, and radio stations
Ancestries: German (17.6%), American (10.1%), English (7.5%), Irish (6.5%), Polish (4.7%), Italian (4.5%).
Current Local Time: EST time zone
Elevation: 610 feet
Land area: 8.08 square miles.
Population density: 3,543 people per square mile (average).
683 residents are foreign born (0.8% North America, 0.8% Asia, 0.5% Latin America, 0.2% Europe).
| This city: | 2.4% |
| Michigan: | 6.9% |
Median real estate property taxes paid for housing units with mortgages in 2022: $1,985 (1.5%)
Median real estate property taxes paid for housing units with no mortgage in 2022: $1,788 (1.3%)
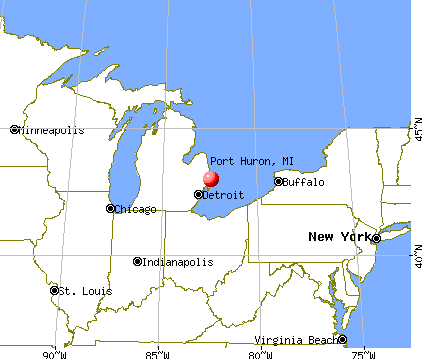
Nearest city with pop. 50,000+: Shelby, MI  (37.0 miles , pop. 65,159).
Nearest city with pop. 200,000+: Detroit, MI (53.2 miles , pop. 951,270).
Nearest city with pop. 1,000,000+: Chicago, IL (279.0 miles , pop. 2,896,016).
Nearest cities:
), )Latitude: 42.98 N, Longitude: 82.44 W
Daytime population change due to commuting: +3,401 (+11.8%)
Workers who live and work in this city: 5,880 (46.2%)
Area code: 810
Port Huron tourist attractions:
Port Huron, Michigan accommodation & food services, waste management - Economy and Business Data
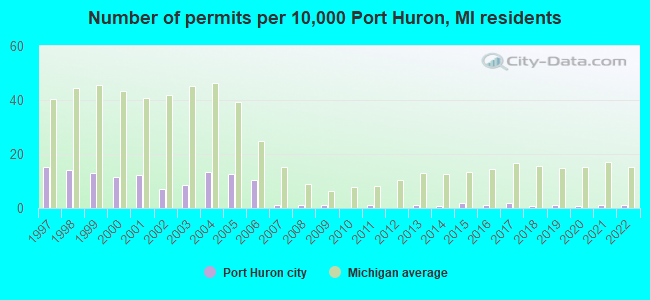
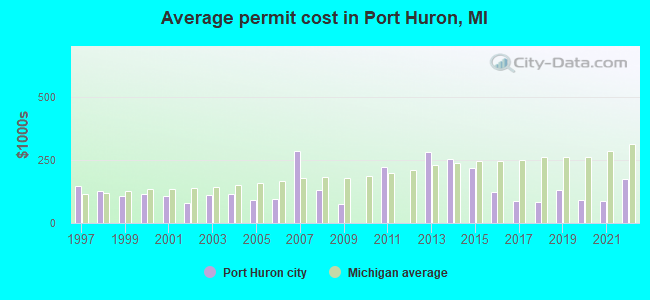
Single-family new house construction building permits:
- 2022: 3 buildings, average cost: $174,600
- 2021: 4 buildings, average cost: $86,300
- 2020: 2 buildings, average cost: $88,500
- 2019: 4 buildings, average cost: $131,800
- 2018: 2 buildings, average cost: $83,000
- 2017: 6 buildings, average cost: $86,700
- 2016: 3 buildings, average cost: $123,300
- 2015: 6 buildings, average cost: $219,300
- 2014: 2 buildings, average cost: $252,500
- 2013: 4 buildings, average cost: $281,000
- 2011: 3 buildings, average cost: $222,500
- 2009: 3 buildings, average cost: $75,000
- 2008: 4 buildings, average cost: $128,800
- 2007: 4 buildings, average cost: $286,200
- 2006: 34 buildings, average cost: $92,900
- 2005: 41 buildings, average cost: $91,200
- 2004: 43 buildings, average cost: $113,400
- 2003: 27 buildings, average cost: $109,900
- 2002: 23 buildings, average cost: $80,900
- 2001: 40 buildings, average cost: $105,500
- 2000: 37 buildings, average cost: $116,000
- 1999: 42 buildings, average cost: $107,500
- 1998: 46 buildings, average cost: $127,000
- 1997: 49 buildings, average cost: $146,000
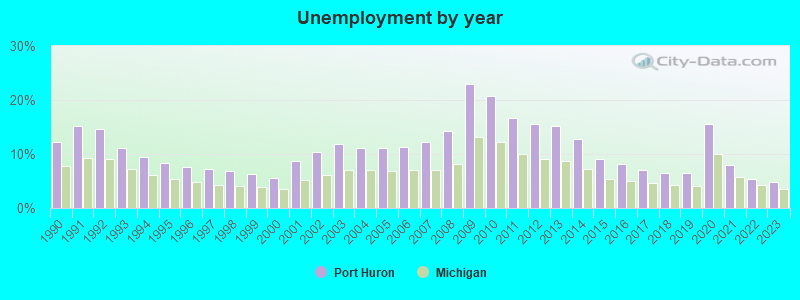
| Here: | 4.9% |
| Michigan: | 3.5% |
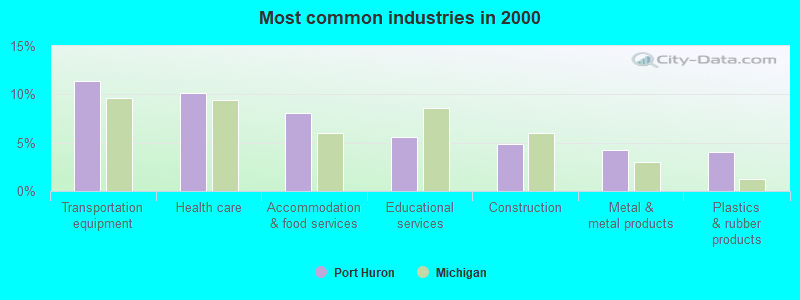
- Transportation equipment (11.4%)
- Health care (10.2%)
- Accommodation & food services (8.1%)
- Educational services (5.6%)
- Construction (4.9%)
- Metal & metal products (4.2%)
- Plastics & rubber products (4.1%)
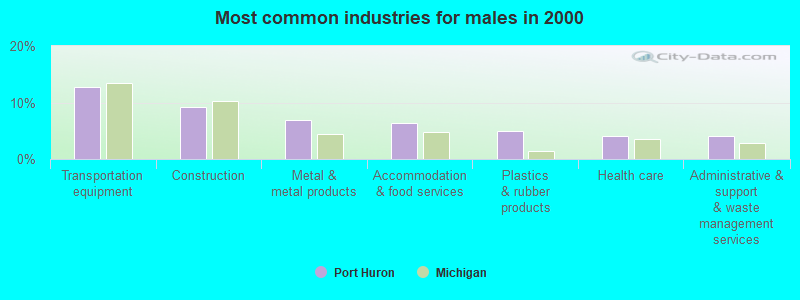
- Transportation equipment (12.8%)
- Construction (9.3%)
- Metal & metal products (7.0%)
- Accommodation & food services (6.3%)
- Plastics & rubber products (4.9%)
- Health care (4.0%)
- Administrative & support & waste management services (4.0%)
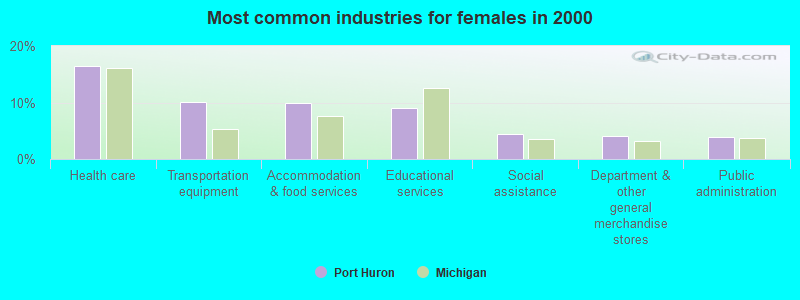
- Health care (16.4%)
- Transportation equipment (10.0%)
- Accommodation & food services (9.8%)
- Educational services (9.1%)
- Social assistance (4.5%)
- Department & other general merchandise stores (4.0%)
- Public administration (3.9%)
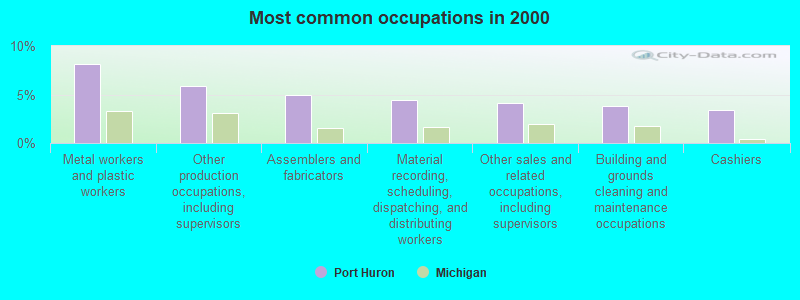
- Metal workers and plastic workers (8.1%)
- Other production occupations, including supervisors (5.9%)
- Assemblers and fabricators (4.9%)
- Material recording, scheduling, dispatching, and distributing workers (4.4%)
- Other sales and related occupations, including supervisors (4.1%)
- Building and grounds cleaning and maintenance occupations (3.9%)
- Cashiers (3.4%)
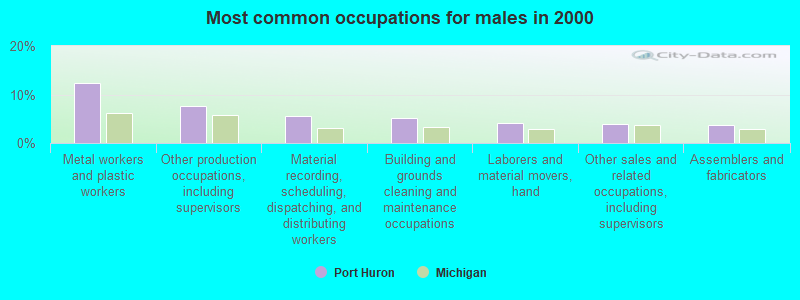
- Metal workers and plastic workers (12.5%)
- Other production occupations, including supervisors (7.7%)
- Material recording, scheduling, dispatching, and distributing workers (5.6%)
- Building and grounds cleaning and maintenance occupations (5.1%)
- Laborers and material movers, hand (4.2%)
- Other sales and related occupations, including supervisors (3.8%)
- Assemblers and fabricators (3.8%)
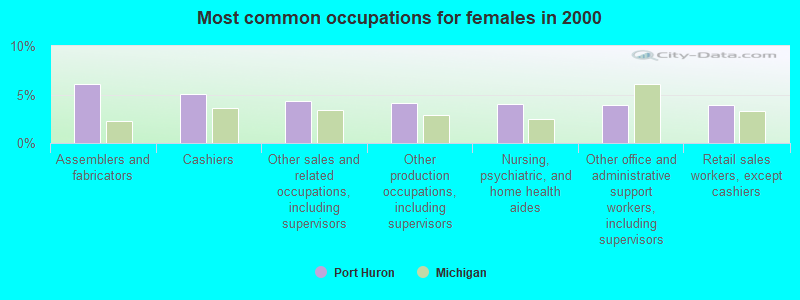
- Assemblers and fabricators (6.1%)
- Cashiers (5.0%)
- Other sales and related occupations, including supervisors (4.3%)
- Other production occupations, including supervisors (4.1%)
- Nursing, psychiatric, and home health aides (4.0%)
- Other office and administrative support workers, including supervisors (3.9%)
- Retail sales workers, except cashiers (3.9%)
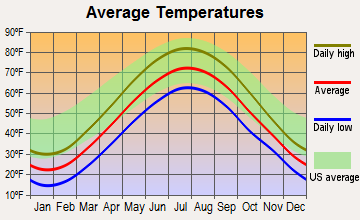
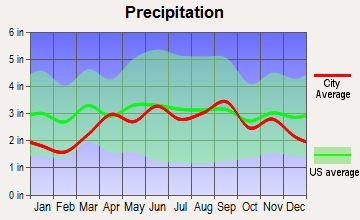
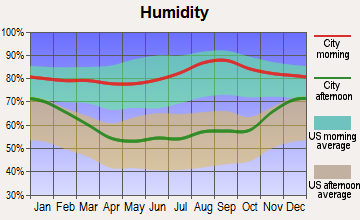
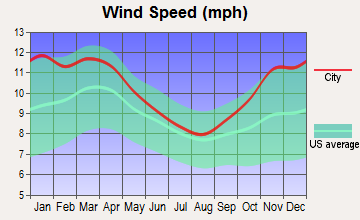
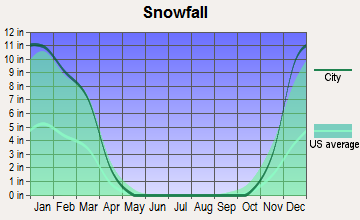
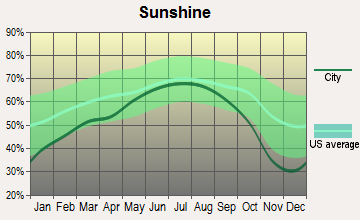
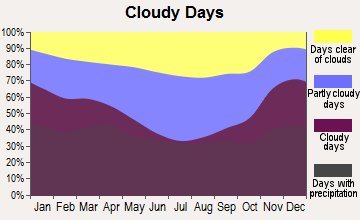
Average climate in Port Huron, Michigan
Based on data reported by over 4,000 weather stations
|
|


(lower is better)
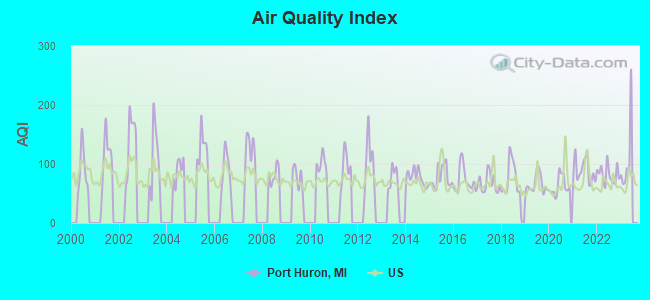
Air Quality Index (AQI) level in 2022 was 82.3. This is about average.
| City: | 82.3 |
| U.S.: | 72.6 |
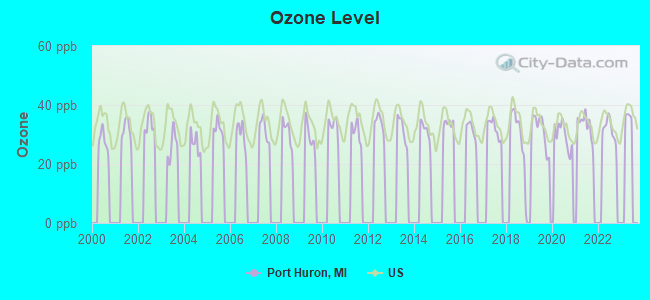
Ozone [ppb] level in 2022 was 31.8. This is about average. Closest monitor was 2.1 miles away from the city center.
| City: | 31.8 |
| U.S.: | 33.3 |
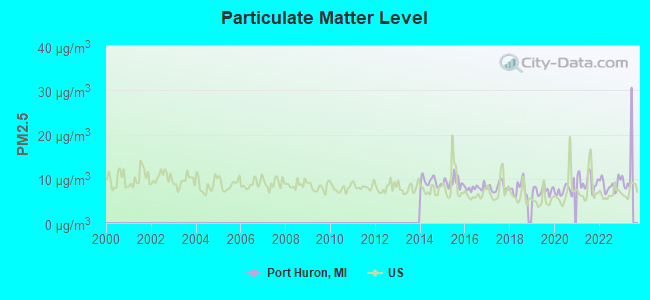
Particulate Matter (PM2.5) [µg/m3] level in 2022 was 8.61. This is about average. Closest monitor was 2.1 miles away from the city center.
| City: | 8.61 |
| U.S.: | 8.11 |
Tornado activity:
Port Huron-area historical tornado activity is below Michigan state average. It is 34% smaller than the overall U.S. average.
On 5/21/1953, a category F4 (max. wind speeds 207-260 mph) tornado 0.9 miles away from the Port Huron city center killed 2 people and injured 68 people and caused between $500,000 and $5,000,000 in damages.
On 6/8/1953, a category F4 tornado 10.8 miles away from the city center injured 23 people and caused between $50,000 and $500,000 in damages.
Earthquake activity:
Port Huron-area historical earthquake activity is significantly above Michigan state average. It is 59% smaller than the overall U.S. average.On 9/25/1998 at 19:52:52, a magnitude 5.2 (4.8 MB, 4.3 MS, 5.2 LG, 4.5 MW, Depth: 3.1 mi, Class: Moderate, Intensity: VI - VII) earthquake occurred 146.8 miles away from the city center
On 1/31/1986 at 16:46:43, a magnitude 5.0 (5.0 MB) earthquake occurred 115.6 miles away from Port Huron center
On 8/23/2011 at 17:51:04, a magnitude 5.8 (5.8 MW, Depth: 3.7 mi) earthquake occurred 423.1 miles away from Port Huron center
On 7/12/1986 at 08:19:37, a magnitude 4.5 (4.5 MB, Class: Light, Intensity: IV - V) earthquake occurred 196.2 miles away from Port Huron center
On 6/10/2019 at 14:50:45, a magnitude 4.0 (4.0 MB, Depth: 1.2 mi) earthquake occurred 103.0 miles away from Port Huron center
On 7/27/1980 at 18:52:21, a magnitude 5.2 (5.1 MB, 4.7 MS, 5.0 UK, 5.2 UK) earthquake occurred 339.6 miles away from the city center
Magnitude types: regional Lg-wave magnitude (LG), body-wave magnitude (MB), surface-wave magnitude (MS), moment magnitude (MW)
Natural disasters:
The number of natural disasters in St. Clair County (1) is a lot smaller than the US average (15).Causes of natural disasters: Other: 1 (Note: some incidents may be assigned to more than one category).
Main business address for: CITIZENS FIRST BANCORP INC (SAVINGS INSTITUTIONS, NOT FEDERALLY CHARTERED), SEMCO ENERGY INC (NATURAL GAS DISTRIBUTION).
Hospitals and medical centers in Port Huron:
- BLUE WATER HOSPICE INC (1430 MILITARY, SUITE A)
- PORT HURON HOSPITAL (Voluntary non-profit - Other, 1221 PINE GROVE AVE)
- ST JOSEPH MERCY PORT HURON (Voluntary non-profit - Church, 2601 ELECTRIC AVENUE)
- MARWOOD MANOR NURSING HOME (1300 BEARD ST)
- FMC DIALYSIS - PORT HURON (2607 ELECTRIC AVE)
- ACCELERATED HOMECARE SERVICES, INC (2321 WATER STREET SUITE E)
- BEACON HOME CARE (415 QUAY ST)
- MERCY AMICARE HOME HEALTHCARE (2540 16TH STREET)
- VISITING NURSE ASSOCIATION HEALTH SERVICES (1430 MILITARY, SUITE A)
Airports and heliports located in Port Huron:
- St Clair County International Airport (PHN) (Runways: 2, Itinerant Ops: 20,000, Local Ops: 7,000)
- Mclaren Port Huron Heliport (73MI)
Colleges/Universities in Port Huron:
- St Clair County Community College (Full-time enrollment: 3,057; Location: 323 Erie Street; Public; Website: www.sc4.edu)
- Baker College of Port Huron (Full-time enrollment: 873; Location: 3403 Lapeer Road; Private, not-for-profit; Website: www.baker.edu/)
- Ross Medical Education Center-Port Huron (Full-time enrollment: 188; Location: 2887 Krafft Road, Suite 700; Private, for-profit; Website: www.rosseducation.edu)
- Paul Mitchell the School-Great Lakes (Full-time enrollment: 117; Location: 2950 Lapeer Road; Private, for-profit; Website: porthuron.paulmitchell.edu)
- Lakewood School of Therapeutic Massage (Full-time enrollment: 31; Location: 1102 6th St; Private, for-profit; Website: lakewoodschool.com)
Other colleges/universities with over 2000 students near Port Huron:
- Baker College of Clinton Township (about 39 miles; Clinton Township, MI; Full-time enrollment: 3,413)
- Macomb Community College (about 43 miles; Warren, MI; FT enrollment: 15,669)
- Oakland University (about 45 miles; Rochester Hills, MI; FT enrollment: 16,449)
- Baker College of Auburn Hills (about 47 miles; Auburn Hills, MI; FT enrollment: 2,284)
- University of Detroit Mercy (about 53 miles; Detroit, MI; FT enrollment: 3,406)
- Wayne State University (about 54 miles; Detroit, MI; FT enrollment: 20,204)
- Lawrence Technological University (about 55 miles; Southfield, MI; FT enrollment: 2,430)
Public high schools in Port Huron:
- PORT HURON HIGH SCHOOL (Students: 1,714, Location: 2215 COURT ST, Grades: 9-12)
- PORT HURON NORTHERN HIGH SCHOOL (Students: 1,587, Location: 1799 KRAFFT RD, Grades: 9-12)
- ST. CLAIR COUNTY INTERVENTION ACADEMY (Students: 104, Location: 1170 MICHIGAN RD, Grades: 6-12, Charter school)
- ST. CLAIR COUNTY LEARNING ACADEMY (Students: 30, Location: 1520 MICHIGAN RD, Grades: 6-12, Charter school)
- BLUE WATER MIDDLE COLLEGE ACADEMY (Location: 323 ERIE STREET, Grades: 9-12, Charter school)
- HARRISON CENTER (Location: 55 - 15TH STREET, Grades: 6-12)
Public elementary/middle schools in Port Huron:
- H D CRULL ELEMENTARY SCHOOL (Students: 617, Location: 2615 HANCOCK ST, Grades: PK-5)
- MICHIGAMME ELEMENTARY SCHOOL (Students: 481, Location: 2855 MICHIGAN RD, Grades: PK-5)
- HOLLAND WOODS MIDDLE SCHOOL (Students: 440, Location: 1617 HOLLAND AVE, Grades: 6-8)
- ROOSEVELT ELEMENTARY SCHOOL (Students: 396, Location: 1112 20TH ST, Grades: PK-5)
- WOODROW WILSON ELEMENTARY SCHOOL (Students: 389, Location: 834 CHESTNUT ST, Grades: PK-5)
- CLEVELAND ELEMENTARY SCHOOL (Students: 222, Location: 2801 VANNESS ST, Grades: KG-5)
- EAST SHORE LEADERSHIP ACADEMY (Location: 1403 7TH ST, Grades: KG-8, Charter school)
- GARFIELD ELEMENTARY SCHOOL (Location: 1221 GARFIELD ST, Grades: PK-5)
- CENTRAL MIDDLE SCHOOL (Location: 200 32ND ST, Grades: 6-8)
Private elementary/middle schools in Port Huron:
Points of interest:
Notable locations in Port Huron: Bluewater Bridge Marina (A), Eds Shell Dock (B), Fort Street Dock (C), Port Huron Station (D), Port Huron Yacht Club (E), Riverside Marina (F), Fort Gratiot Range Lights (G), Maxi Marine Service (H), Fuller Boat and Motors (I), Buck River Marina (J), Municipal Marina (K), Henry McMorran Memorial Auditorium (L), Port Huron Marina (M), Port Huron Municipal Dock (N), Saint Clair County Jail (O), Black River Boat Club (P), Fort Gratiot Light (Q), Tri - Hospital Emergency Medical Services Central Station (R), Tri - Hospital Emergency Medical Services Station 2 (S), People's Clinic for Better Health (T). Display/hide their locations on the map
Shopping Centers: Pine Grove Plaza Shopping Center (1), Pine Grove Plaza Shopping Center (2), Court of Flags Mall Shopping Center (3), Court of Flags Mall Shopping Center (4). Display/hide their locations on the map
Main business address in Port Huron include: CITIZENS FIRST BANCORP INC (A), SEMCO ENERGY INC (B). Display/hide their locations on the map
Churches in Port Huron include: Shiloh Church (A), First United Methodist Church (B), Our Saviour's Lutheran Church (C), Saint John's United Church of Christ (D), First Congregational Church (E), Grace Episcopal Church (F), First Presbyterian Church (G), Colonial Woods Missionary Church (H), Saint Martin Lutheran Church (I). Display/hide their locations on the map
Cemeteries: Mount Sinai Cemetery (1), Mount Hope Cemetery (2), Lakeside Cemetery (3), Veterans Cemetery (4), Pinewood Cemetery (5). Display/hide their locations on the map
River: Black River (A). Display/hide its location on the map
Parks in Port Huron include: Sixteenth Street Park (1), Kiefer Park (2), White Park (3), Lincoln Park (4), Knox Field (5), Gratiot Park (6), Haynes Park (7), Mansfield Park (8), Palmer Park (9). Display/hide their locations on the map
Tourist attractions: B & W Billiards & Spas (Amusement & Theme Parks; 1639 Garfield Street) (1), Blue Water Area Convention & Visitors Bureau (520 Thomas Edison Parkway) (2). Display/hide their approximate locations on the map
Hotels: Fairfield Inn Port Huron (1635 Yeager Street) (1), Best Western Hospitality Inn (2282 Water Street) (2), Comfort Inn Port Huron (1700 Yeager Street) (3), Days Inn (2908 Pine Grove Avenue) (4), Flamingo Motel (3845 Lapeer Road) (5), Elmcourt Motel (3600 Lapeer Road) (6), Fairfield Inn by Marriott (1635 Yeager Street) (7), Hampton Inn Port Huron (1655 Yeager Street) (8), El Rancho Motel (3756 Lapeer Road) (9). Display/hide their approximate locations on the map
Courts: Port Huron City - Recreation Main Office- Court Street- (2025 Court Street) (1), United States Government - Court Us- Harvey James (216 Federal Building) (2), St Clair County - Courts- Circuit Court 31st Circuit- Probate Court-A (201 McMorran Boulevard) (3), St Clair County - Courts- Circuit Court 31st Circuit- Probate Court-Juve (201 McMorran Boulevard) (4), St. Clair County Government - Friend Of The Court (201 McMorran Boulevard) (5), St. Clair County Government - Courts- Circuit Court 31st- (201 McMorran Boulevard) (6), St Clair County - Courts- Circuit Court 31st Circuit- District Court N (201 McMorran Boulevard) (7), Social Security Administration - Port Huron Office (526 Water Street) (8). Display/hide their approximate locations on the map
Birthplace of: Colleen Moore - Actor, Harry Wismer - Sports boradcaster and charter owner of the New York Jets, Dennis Sullivan - Mathematician, Harold Sines Vance - Businessman, Herbert W. Kalmbach - Criminal, Jack Campbell (ice hockey) - Ice hockey goaltender, Jason Motte - Baseball player, Frederick C. Sherman - Navy admiral, Henry McMorran - Politician, Kevin Rivers (songwriter) - Songwriter.
Drinking water stations with addresses in Port Huron and their reported violations in the past:
SPEEDY Q-BAD AXE (Population served: 100, Groundwater):Past monitoring violations:
- One routine major monitoring violation
Drinking water stations with addresses in Port Huron that have no violations reported:
- ST CLAIR COUNTY SERVICE & MEDA (Population served: 100, Primary Water Source Type: Groundwater)
- ST CLAIR COUNTY ARTESIAN WELL (Population served: 100, Primary Water Source Type: Groundwater)
| This city: | 2.4 people |
| Michigan: | 2.5 people |
| This city: | 60.0% |
| Whole state: | 66.0% |
| This city: | 9.6% |
| Whole state: | 6.4% |
Likely homosexual households (counted as self-reported same-sex unmarried-partner households)
- Lesbian couples: 0.4% of all households
- Gay men: 0.2% of all households
People in group quarters in Port Huron in 2010:
- 374 people in other noninstitutional facilities
- 228 people in nursing facilities/skilled-nursing facilities
- 71 people in group homes intended for adults
- 31 people in workers' group living quarters and job corps centers
- 28 people in emergency and transitional shelters (with sleeping facilities) for people experiencing homelessness
- 22 people in residential treatment centers for adults
- 7 people in group homes for juveniles (non-correctional)
People in group quarters in Port Huron in 2000:
- 211 people in local jails and other confinement facilities (including police lockups)
- 195 people in nursing homes
- 161 people in other group homes
- 140 people in other noninstitutional group quarters
- 35 people in other types of correctional institutions
- 28 people in homes or halfway houses for drug/alcohol abuse
- 25 people in homes for the mentally retarded
- 18 people in military ships
- 15 people in other nonhousehold living situations
- 9 people in homes for the mentally ill
Banks with branches in Port Huron (2011 data):
- JPMorgan Chase Bank, National Association: 24th Street Branch, Fort Street Branch, Pine Grove Garfield Branch, Pine Grove Drive-Up Branch. Info updated 2011/11/10: Bank assets: $1,811,678.0 mil, Deposits: $1,190,738.0 mil, headquarters in Columbus, OH, positive income, International Specialization, 5577 total offices, Holding Company: Jpmorgan Chase & Co.
- Talmer Bank and Trust: Port Huron Loan Production Branch, Westside, Port Huron, Hancock. Info updated 2011/05/03: Bank assets: $2,126.7 mil, Deposits: $1,722.6 mil, headquarters in Troy, MI, positive income, Commercial Lending Specialization, 56 total offices, Holding Company: Talmer Bancorp Inc.
- Eastern Michigan Bank: Port Huron Branch at 600 Water Street, branch established on 1990/12/17; Lakeport Branch at 7090 Lakeshore Road, branch established on 1971/09/13. Info updated 2006/11/03: Bank assets: $259.8 mil, Deposits: $233.8 mil, headquarters in Croswell, MI, positive income, Agricultural Specialization, 11 total offices, Holding Company: Eastern Michigan Financial Corporation
- Bank of America, National Association: Griswold Street Branch at 2300 Griswold Street, branch established on 1934/01/01; North End Branch at 1825 Pine Grove Avenue, branch established on 1934/01/01. Info updated 2009/11/18: Bank assets: $1,451,969.3 mil, Deposits: $1,077,176.8 mil, headquarters in Charlotte, NC, positive income, 5782 total offices, Holding Company: Bank Of America Corporation
- TCF National Bank: Port Huron Kmart Branch at 1179 32nd Street, branch established on 1997/01/10. Info updated 2009/11/23: Bank assets: $19,007.0 mil, Deposits: $12,377.0 mil, headquarters in Sioux Falls, SD, positive income, Commercial Lending Specialization, 441 total offices, Holding Company: Tcf Financial Corporation
- Seaway Community Bank: Port Huron Branch at 511 Fort Street, Ste. 100, branch established on 2003/09/08. Info updated 2006/11/03: Bank assets: $171.8 mil, Deposits: $140.5 mil, headquarters in Saint Clair, MI, negative income in the last year, Commercial Lending Specialization, 4 total offices, Holding Company: Northstar Financial Group, Inc.
For population 15 years and over in Port Huron:
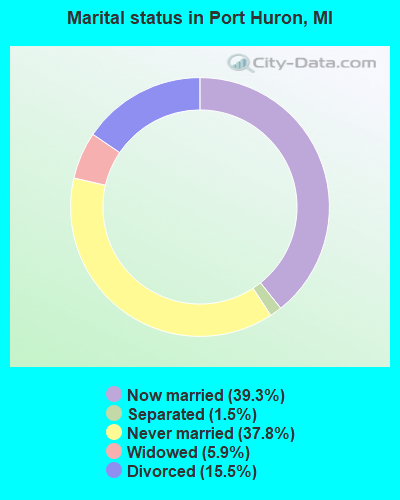
- Never married: 37.8%
- Now married: 39.3%
- Separated: 1.5%
- Widowed: 5.9%
- Divorced: 15.5%
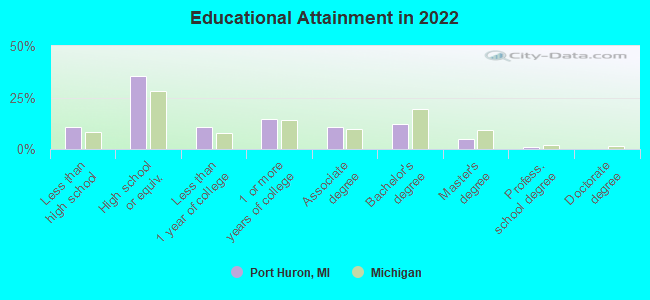
For population 25 years and over in Port Huron:
- High school or higher: 89.7%
- Bachelor's degree or higher: 18.5%
- Graduate or professional degree: 5.9%
- Unemployed: 7.7%
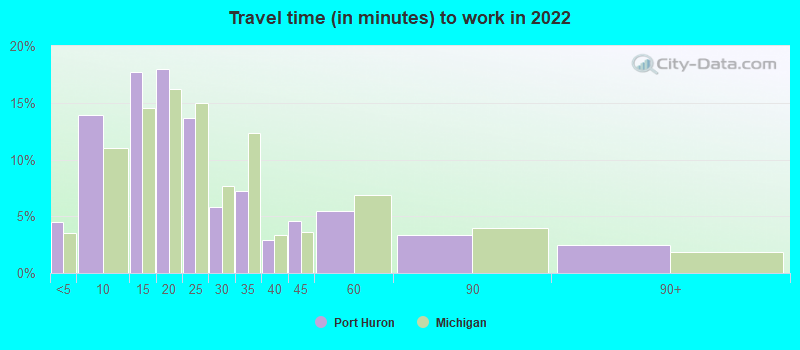
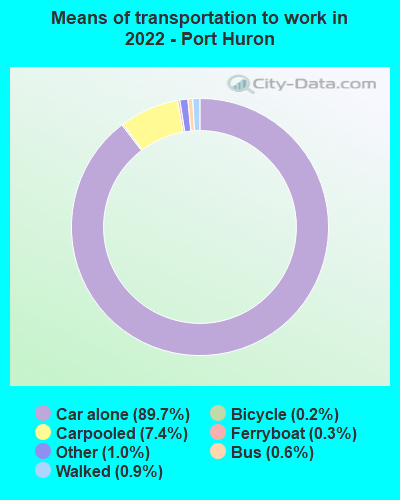
- Mean travel time to work (commute): 21.7 minutes
| Here: | 9.4 |
| Michigan average: | 11.0 |
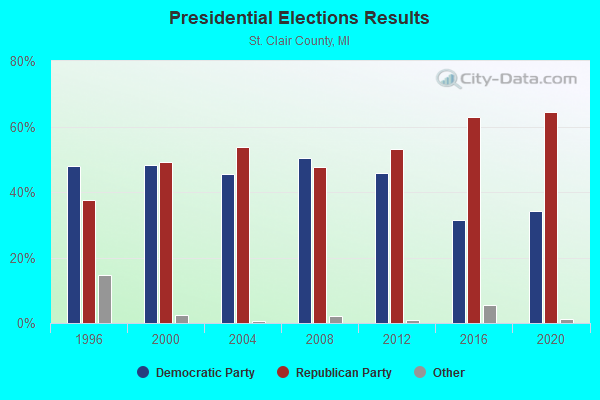
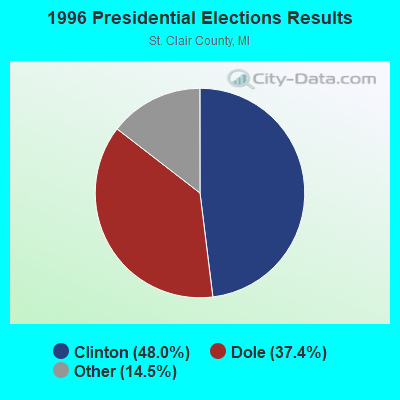
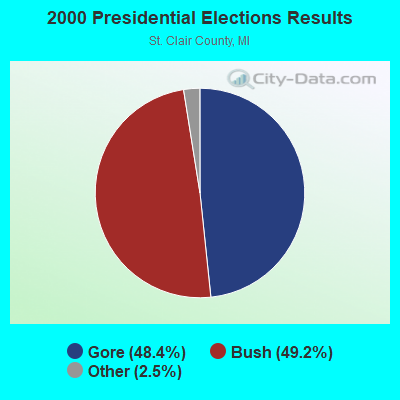
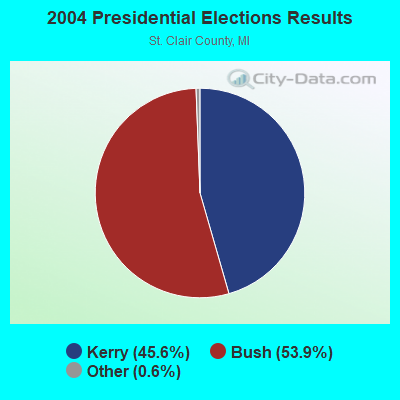
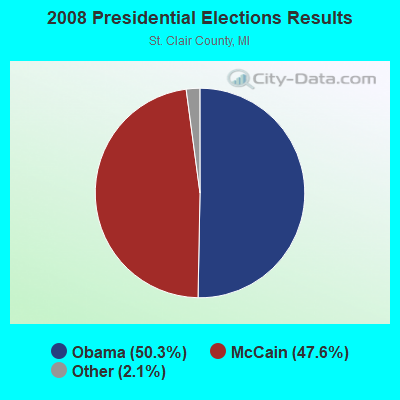
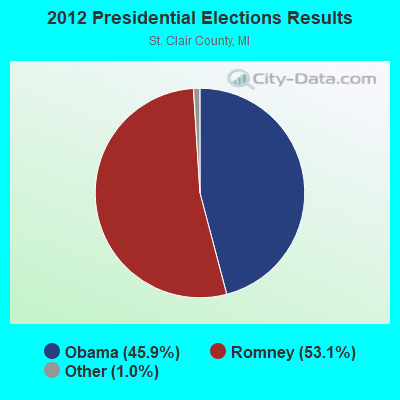
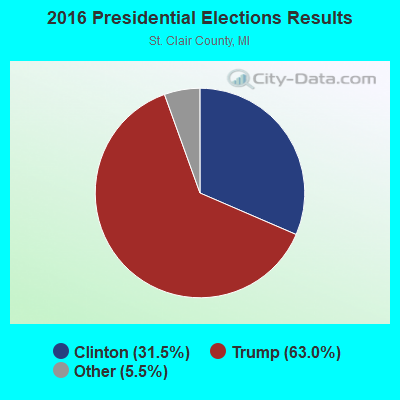
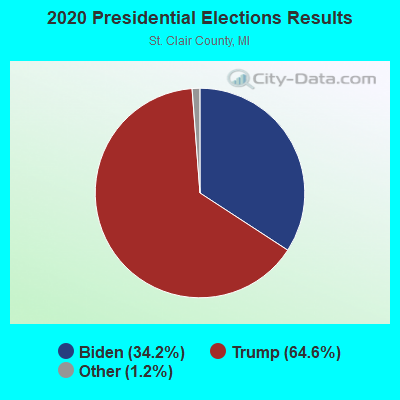
Graphs represent county-level data. Detailed 2008 Election Results
Neighborhoods in Port Huron:
(Port Huron, Michigan Neighborhood Map)Religion statistics for Port Huron, MI (based on St. Clair County data)
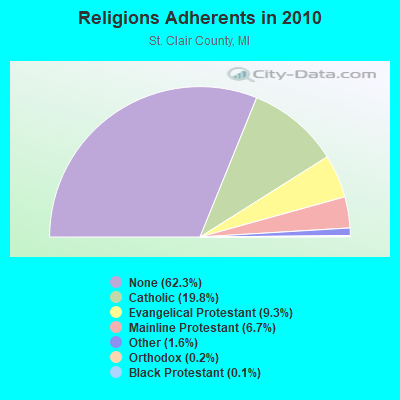
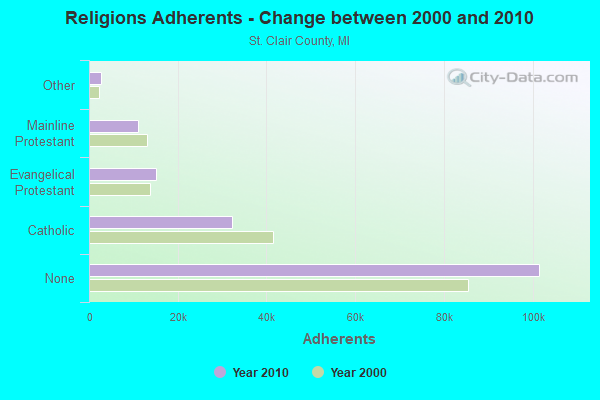
| Religion | Adherents | Congregations |
|---|---|---|
| Catholic | 32,248 | 11 |
| Evangelical Protestant | 15,146 | 56 |
| Mainline Protestant | 10,997 | 49 |
| Other | 2,660 | 11 |
| Orthodox | 274 | 2 |
| Black Protestant | 200 | 2 |
| None | 101,515 | - |
Food Environment Statistics:
| St. Clair County: | 2.00 / 10,000 pop. |
| State: | 2.34 / 10,000 pop. |
| This county: | 0.24 / 10,000 pop. |
| Michigan: | 0.18 / 10,000 pop. |
| St. Clair County: | 2.18 / 10,000 pop. |
| Michigan: | 1.52 / 10,000 pop. |
| This county: | 2.36 / 10,000 pop. |
| Michigan: | 2.99 / 10,000 pop. |
| St. Clair County: | 6.54 / 10,000 pop. |
| Michigan: | 6.80 / 10,000 pop. |
| St. Clair County: | 9.1% |
| Michigan: | 9.7% |
| St. Clair County: | 30.2% |
| Michigan: | 29.7% |
| Here: | 11.2% |
| Michigan: | 13.4% |
Health and Nutrition:
| Port Huron: | 49.5% |
| Michigan: | 50.3% |
| Here: | 46.4% |
| Michigan: | 47.9% |
| Here: | 29.0 |
| Michigan: | 28.7 |
| This city: | 20.7% |
| State: | 20.6% |
| This city: | 11.7% |
| Michigan: | 10.4% |
| Port Huron: | 6.8 |
| Michigan: | 6.8 |
| This city: | 34.6% |
| State: | 34.1% |
| Here: | 56.4% |
| Michigan: | 57.0% |
| This city: | 78.7% |
| Michigan: | 79.6% |
More about Health and Nutrition of Port Huron, MI Residents
| Local government employment and payroll (March 2022) | |||||
| Function | Full-time employees | Monthly full-time payroll | Average yearly full-time wage | Part-time employees | Monthly part-time payroll |
|---|---|---|---|---|---|
| Police Protection - Officers | 59 | $402,229 | $81,809 | 0 | $0 |
| Firefighters | 40 | $246,655 | $73,997 | 0 | $0 |
| Sewerage | 30 | $145,624 | $58,250 | 0 | $0 |
| Parks and Recreation | 23 | $102,414 | $53,433 | 49 | $21,237 |
| Streets and Highways | 23 | $107,902 | $56,297 | 0 | $0 |
| Other Government Administration | 22 | $113,113 | $61,698 | 2 | $760 |
| Financial Administration | 22 | $109,316 | $59,627 | 3 | $5,901 |
| Water Supply | 19 | $93,853 | $59,276 | 0 | $0 |
| Other and Unallocable | 11 | $50,119 | $54,675 | 7 | $6,955 |
| Police - Other | 8 | $37,173 | $55,760 | 23 | $22,096 |
| Housing and Community Development (Local) | 1 | $5,537 | $66,444 | 1 | $2,385 |
| Totals for Government | 258 | $1,413,934 | $65,764 | 85 | $59,334 |
Port Huron government finances - Expenditure in 2021 (per resident):
- Construction - Regular Highways: $1,518,000 ($53.03)
Housing and Community Development: $342,000 ($11.95)
- Current Operations - Police Protection: $10,601,000 ($370.33)
Sewerage: $8,193,000 ($286.21)
Housing and Community Development: $7,403,000 ($258.61)
Local Fire Protection: $5,987,000 ($209.15)
Parks and Recreation: $4,974,000 ($173.76)
Regular Highways: $4,595,000 ($160.52)
General - Other: $4,086,000 ($142.74)
Water Utilities: $3,929,000 ($137.25)
Central Staff Services: $2,657,000 ($92.82)
Solid Waste Management: $2,103,000 ($73.46)
Financial Administration: $1,911,000 ($66.76)
General Public Buildings: $802,000 ($28.02)
Protective Inspection and Regulation - Other: $721,000 ($25.19)
Libraries: $8,000 ($0.28)
Health - Other: $2,000 ($0.07)
- General - Interest on Debt: $2,294,000 ($80.14)
- Intergovernmental to Local - Other - General - Other: $63,000 ($2.20)
Other - Housing and Community Development: $49,000 ($1.71)
- Other Capital Outlay - Parks and Recreation: $807,000 ($28.19)
General - Other: $82,000 ($2.86)
Local Fire Protection: $56,000 ($1.96)
Police Protection: $4,000 ($0.14)
- Total Salaries and Wages: $20,648,000 ($721.30)
- Water Utilities - Interest on Debt: $647,000 ($22.60)
Port Huron government finances - Revenue in 2021 (per resident):
- Charges - Sewerage: $16,878,000 ($589.60)
Other: $2,402,000 ($83.91)
Housing and Community Development: $1,553,000 ($54.25)
Parks and Recreation: $624,000 ($21.80)
Parking Facilities: $38,000 ($1.33)
- Federal Intergovernmental - Housing and Community Development: $9,258,000 ($323.41)
Other: $1,820,000 ($63.58)
- Local Intergovernmental - Other: $234,000 ($8.17)
Highways: $146,000 ($5.10)
- Miscellaneous - General Revenue - Other: $2,873,000 ($100.36)
Donations From Private Sources: $955,000 ($33.36)
Rents: $393,000 ($13.73)
Fines and Forfeits: $106,000 ($3.70)
Interest Earnings: $64,000 ($2.24)
Sale of Property: $1,000 ($0.03)
- Revenue - Water Utilities: $8,033,000 ($280.62)
- State Intergovernmental - General Local Government Support: $5,340,000 ($186.54)
Highways: $4,334,000 ($151.40)
Other: $977,000 ($34.13)
- Tax - Property: $14,466,000 ($505.34)
Individual Income: $7,387,000 ($258.05)
Other License: $436,000 ($15.23)
Occupation and Business License - Other: $359,000 ($12.54)
Port Huron government finances - Debt in 2021 (per resident):
- Long Term Debt - Outstanding Unspecified Public Purpose: $116,137,000 ($4057.05)
Beginning Outstanding - Unspecified Public Purpose: $110,611,000 ($3864.00)
Issue, Unspecified Public Purpose: $15,681,000 ($547.79)
Retired Unspecified Public Purpose: $10,154,000 ($354.71)
Port Huron government finances - Cash and Securities in 2021 (per resident):
- Other Funds - Cash and Securities: $51,717,000 ($1806.64)
- Sinking Funds - Cash and Securities: $3,227,000 ($112.73)
| Businesses in Port Huron, MI | ||||
| Name | Count | Name | Count | |
|---|---|---|---|---|
| AT&T | 1 | Kmart | 1 | |
| Advance Auto Parts | 1 | Knights Inn | 1 | |
| Applebee's | 1 | Kroger | 2 | |
| Arby's | 2 | La-Z-Boy | 1 | |
| AutoZone | 1 | Lane Furniture | 3 | |
| Baskin-Robbins | 1 | Little Caesars Pizza | 1 | |
| Bath & Body Works | 1 | Marriott | 1 | |
| Baymont Inn | 1 | MasterBrand Cabinets | 5 | |
| Best Western | 1 | McDonald's | 2 | |
| Blockbuster | 1 | New Balance | 1 | |
| Buffalo Wild Wings | 1 | Payless | 1 | |
| Burger King | 3 | Penske | 2 | |
| CVS | 2 | Pizza Hut | 1 | |
| Comfort Inn | 1 | Quality | 1 | |
| Cracker Barrel | 1 | RadioShack | 1 | |
| Dairy Queen | 1 | Rite Aid | 2 | |
| Days Inn | 1 | Sam's Club | 1 | |
| Decora Cabinetry | 1 | Sears | 1 | |
| Dunkin Donuts | 1 | Sprint Nextel | 1 | |
| Fashion Bug | 1 | T-Mobile | 1 | |
| FedEx | 5 | T.J.Maxx | 1 | |
| Ford | 1 | Taco Bell | 1 | |
| GNC | 2 | Tim Hortons | 2 | |
| Goodwill | 1 | U-Haul | 1 | |
| H&R Block | 1 | UPS | 9 | |
| Hilton | 1 | Walgreens | 2 | |
| Hollister Co. | 1 | Wendy's | 2 | |
| Honda | 1 | White Castle | 1 | |
| KFC | 1 | YMCA | 1 | |
Strongest AM radio stations in Port Huron:
- WHLS (1450 AM; 1 kW; PORT HURON, MI; Owner: LIGGETT COMMUNICATIONS, L.L.C.)
- WPHM (1380 AM; 5 kW; PORT HURON, MI; Owner: LIGGETT COMMUNICATIONS, L.L.C.)
- WWJ (950 AM; 50 kW; DETROIT, MI; Owner: INFINITY BROADCASTING OPERATIONS, INC.)
- WJR (760 AM; 50 kW; DETROIT, MI; Owner: ABC, INC.)
- WXYT (1270 AM; 50 kW; DETROIT, MI; Owner: INFINITY BROADCASTING CORP. OF DETROIT)
- WDFN (1130 AM; 50 kW; DETROIT, MI; Owner: AMFM RADIO LICENSES, L.L.C.)
- WFDF (910 AM; 50 kW; FLINT, MI; Owner: ABC, INC.)
- WCHB (1200 AM; 50 kW; TAYLOR, MI; Owner: RADIO ONE OF DETROIT, LLC)
- WOAP (1080 AM; 50 kW; OWOSSO, MI)
- WKNR (850 AM; 50 kW; CLEVELAND, OH; Owner: CARON BROADCASTING, INC.)
- WUFL (1030 AM; daytime; 5 kW; STERLING HEIGHTS, MI; Owner: FAMILY LIFE BROADCASTING SYSTEM)
- WTAM (1100 AM; 50 kW; CLEVELAND, OH; Owner: JACOR BROADCASTING CORPORATION)
- WHK (1220 AM; 50 kW; CLEVELAND, OH; Owner: CARON BROADCASTING, INC.)
Strongest FM radio stations in Port Huron:
- WSAQ (107.1 FM; PORT HURON, MI; Owner: LIGGETT COMMUNICATIONS, L.L.C.)
- WSGR-FM (91.3 FM; PORT HURON, MI; Owner: ST. CLAIR COUNTY COMMUNITY COLLEGE)
- WNFA (88.3 FM; PORT HURON, MI; Owner: ROSS BIBLE CHURCH)
- W205BH (88.9 FM; PORT HURON, MI; Owner: PENSACOLA CHRISTIAN COLLEGE INC)
- WGRT (102.3 FM; PORT HURON, MI; Owner: PORT HURON FAMILY RADIO, INC.)
- WNFR (90.7 FM; SANDUSKY, MI; Owner: ROSS BIBLE CHURCH)
- WBTI (96.9 FM; LEXINGTON, MI; Owner: LIGGETT COMMUNICATIONS, L.L.C.)
- WORW (91.9 FM; PORT HURON, MI; Owner: PORT HURON AREA SCHOOL DIST)
- National Bridge Inventory (NBI) Statistics
- 52Number of bridges
- 2,172ft / 662mTotal length
- $1,594,000Total costs
- 889,984Total average daily traffic
- 92,585Total average daily truck traffic
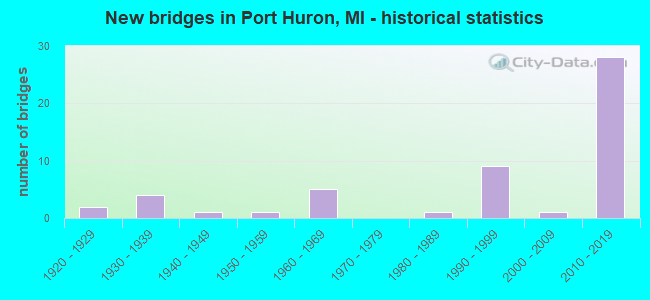
- New bridges - historical statistics
- 21920-1929
- 41930-1939
- 11940-1949
- 11950-1959
- 51960-1969
- 11980-1989
- 91990-1999
- 12000-2009
- 282010-2019
FCC Registered Antenna Towers: 120 (See the full list of FCC Registered Antenna Towers)
FCC Registered Commercial Land Mobile Towers: 5 (See the full list of FCC Registered Commercial Land Mobile Towers in Port Huron, MI)
FCC Registered Private Land Mobile Towers: 9 (See the full list of FCC Registered Private Land Mobile Towers)
FCC Registered Broadcast Land Mobile Towers: 43 (See the full list of FCC Registered Broadcast Land Mobile Towers)
FCC Registered Microwave Towers: 33 (See the full list of FCC Registered Microwave Towers in this town)
FCC Registered Paging Towers: 9 (See the full list of FCC Registered Paging Towers)
FCC Registered Maritime Coast & Aviation Ground Towers: 14 (See the full list of FCC Registered Maritime Coast & Aviation Ground Towers)
FCC Registered Amateur Radio Licenses: 170 (See the full list of FCC Registered Amateur Radio Licenses in Port Huron)
FAA Registered Aircraft: 15 (See the full list of FAA Registered Aircraft in Port Huron)
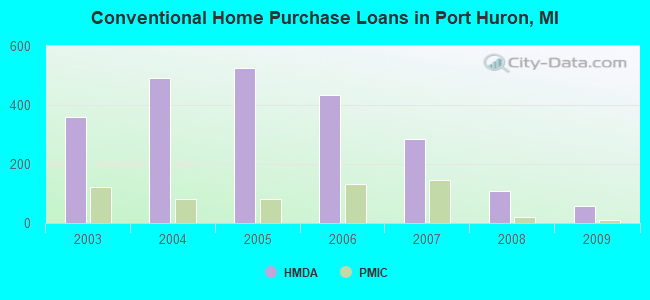
| Home Mortgage Disclosure Act Aggregated Statistics For Year 2009 (Based on 10 full tracts) | ||||||||||||
| A) FHA, FSA/RHS & VA Home Purchase Loans | B) Conventional Home Purchase Loans | C) Refinancings | D) Home Improvement Loans | E) Loans on Dwellings For 5+ Families | F) Non-occupant Loans on < 5 Family Dwellings (A B C & D) | |||||||
|---|---|---|---|---|---|---|---|---|---|---|---|---|
| Number | Average Value | Number | Average Value | Number | Average Value | Number | Average Value | Number | Average Value | Number | Average Value | |
| LOANS ORIGINATED | 67 | $68,032 | 59 | $62,992 | 246 | $101,257 | 35 | $29,512 | 1 | $1,013,000 | 40 | $53,586 |
| APPLICATIONS APPROVED, NOT ACCEPTED | 9 | $46,778 | 9 | $81,789 | 31 | $128,126 | 5 | $27,000 | 0 | $0 | 8 | $47,500 |
| APPLICATIONS DENIED | 23 | $68,957 | 14 | $34,340 | 94 | $106,559 | 35 | $16,752 | 0 | $0 | 21 | $66,868 |
| APPLICATIONS WITHDRAWN | 13 | $71,608 | 9 | $82,156 | 54 | $108,021 | 9 | $39,212 | 0 | $0 | 11 | $120,344 |
| FILES CLOSED FOR INCOMPLETENESS | 6 | $52,333 | 10 | $68,787 | 36 | $97,897 | 2 | $65,000 | 0 | $0 | 8 | $53,609 |
Detailed mortgage data for all 10 tracts in Port Huron, MI
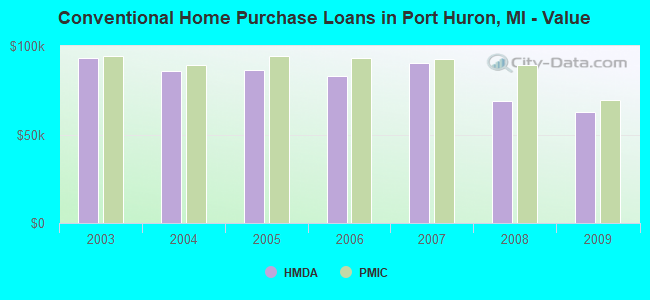
| Private Mortgage Insurance Companies Aggregated Statistics For Year 2009 (Based on 9 full tracts) | ||||
| A) Conventional Home Purchase Loans | B) Refinancings | |||
|---|---|---|---|---|
| Number | Average Value | Number | Average Value | |
| LOANS ORIGINATED | 9 | $69,556 | 2 | $120,500 |
| APPLICATIONS APPROVED, NOT ACCEPTED | 1 | $278,560 | 5 | $198,600 |
| APPLICATIONS DENIED | 4 | $113,750 | 1 | $133,000 |
| APPLICATIONS WITHDRAWN | 0 | $0 | 0 | $0 |
| FILES CLOSED FOR INCOMPLETENESS | 1 | $29,000 | 0 | $0 |
2002 - 2018 National Fire Incident Reporting System (NFIRS) incidents
- Fire incident types reported to NFIRS in Port Huron, MI
- 1,51157.1%Structure Fires
- 62723.7%Outside Fires
- 39314.8%Mobile Property/Vehicle Fires
- 1174.4%Other
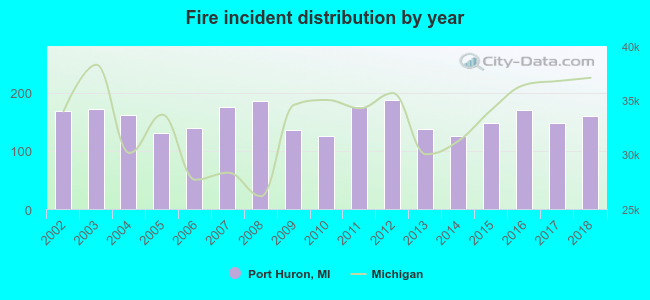 Based on the data from the years 2002 - 2018 the average number of fires per year is 156. The highest number of reported fire incidents - 187 took place in 2012, and the least - 125 in 2010. The data has a declining trend.
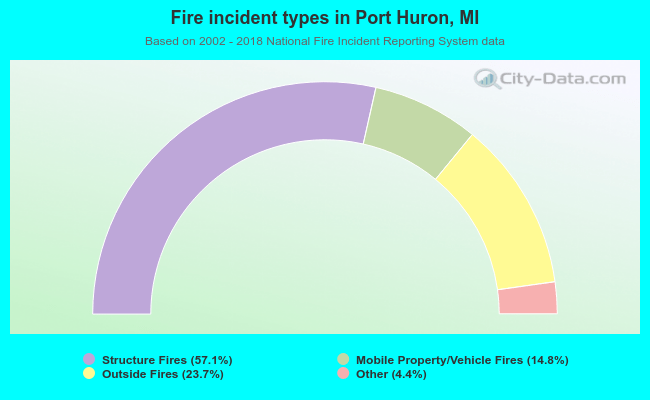 When looking into fire subcategories, the most reports belonged to: Structure Fires (57.1%), and Outside Fires (23.7%).
Fire-safe hotels and motels in Port Huron, Michigan:
- Comfort Inn Port Huron, 1700 Yeager St, Port Huron, Michigan 48060 , Phone: (810) 982-5500, Fax: (810) 982-7199
- Baymont Inn And Suites, 1611 Range Rd, Port Huron, Michigan 48074 , Phone: (810) 364-8000, Fax: (810) 364-8844
- Quality Inn & Suites, 1720 Hancock St, Port Huron, Michigan 48060 , Phone: (810) 987-5999, Fax: (810) 987-5954
- Hampton Inn - Port Huron, 1655 Yeager, Port Huron, Michigan 48060 , Phone: (810) 966-9000, Fax: (810) 966-9010
- Best Western Port Huron Blue Water Bridge, 2282 Water St, Port Huron, Michigan 48060 , Phone: (810) 987-1600, Fax: (810) 987-5479
- Doubletree By Hilton Port Huron, 500 Thomas Edison Pkwy, Port Huron, Michigan 48060 , Phone: (810) 984-8000
- Holiday Inn Express & Suites Port Huron, 2021 Water St, Port huron, Michigan 48060 , Phone: (800) 465-4329
| Most common first names in Port Huron, MI among deceased individuals | ||
| Name | Count | Lived (average) |
|---|---|---|
| John | 465 | 74.3 years |
| Mary | 425 | 78.6 years |
| William | 413 | 73.5 years |
| Robert | 326 | 68.7 years |
| George | 253 | 74.9 years |
| Charles | 246 | 73.0 years |
| James | 241 | 70.3 years |
| Margaret | 209 | 79.1 years |
| Helen | 200 | 79.1 years |
| Joseph | 184 | 73.7 years |
| Most common last names in Port Huron, MI among deceased individuals | ||
| Last name | Count | Lived (average) |
|---|---|---|
| Smith | 220 | 73.5 years |
| Miller | 121 | 75.6 years |
| Brown | 80 | 76.8 years |
| Johnson | 74 | 75.2 years |
| Jones | 72 | 75.4 years |
| Williams | 53 | 75.3 years |
| Hall | 47 | 74.3 years |
| Thompson | 46 | 71.1 years |
| Young | 45 | 71.4 years |
| Davis | 45 | 75.7 years |
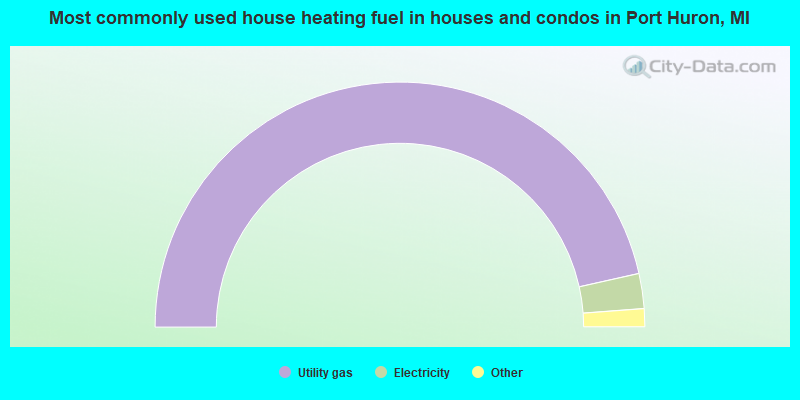
- 93.0%Utility gas
- 4.6%Electricity
- 1.0%Bottled, tank, or LP gas
- 0.7%Wood
- 0.7%Other fuel
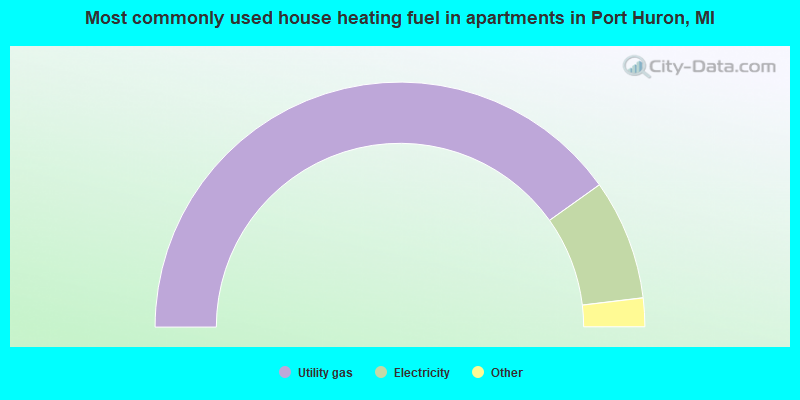
- 80.3%Utility gas
- 15.9%Electricity
- 2.6%Bottled, tank, or LP gas
- 1.1%No fuel used
- 0.1%Other fuel
Port Huron compared to Michigan state average:
- Median house value below state average.
- Unemployed percentage below state average.
- Black race population percentage below state average.
- Median age below state average.
- Foreign-born population percentage significantly below state average.
- Renting percentage above state average.
- Length of stay since moving in above state average.
- Number of college students below state average.
Port Huron on our top lists:
- #46 on the list of "Top 101 cities with the largest percentage of people in military ships (population 1,000+)"
- #10 on the list of "Top 101 counties with the largest increase in the number of deaths per 1000 residents 2000-2006 to 2007-2013 (pop. 50,000+)"
- #13 on the list of "Top 101 counties with the largest number of people moving out compared to moving in (pop. 50,000+)"
- #30 on the list of "Top 101 counties with the highest surface withdrawal of fresh water for public supply"
- #41 on the list of "Top 101 counties with the largest decrease in the number of births per 1000 residents 2000-2006 to 2007-2013 (pop 50,000+)"
- #44 on the list of "Top 101 counties with the highest total withdrawal of fresh water for public supply (pop. 50,000+)"

|
|
Total of 68 patent applications in 2008-2024.