Princeton, MA (Massachusetts) Houses and Residents
| Princeton: | $587,938 |
| Massachusetts: | $534,700 |
Total population: 3,413 (Urban population: 0, Rural population: 3,353 (35 farm, 3,318 nonfarm))
Houses: 1,196 (1,166 occupied: 1,066 owner occupied, 100 renter occupied)
| % of renters here: | 9% |
| State: | 38% |
Housing density: 34 houses/condos per square mile
Median price asked for vacant for-sale houses and condos in 2022 in this county: $182,682.
Median contract rent in 2022: $1,243 (lower quartile is $890, upper quartile is $1,642)
Median gross rent in Princeton, MA in 2022: $1,434
Housing units in Princeton with a mortgage: 719 (42 second mortgage, 129 home equity loan, 0 both second mortgage and home equity loan)
Houses without a mortgage: 170
Compare current foreclosures near Princeton, MA:
| Photo | Address | Area | Beds / Baths | Price | Details |
|---|---|---|---|---|---|

|
#1
Coal Kiln Rd
Princeton, MA 01541
|
1,588 sq. feet
|
2 baths 3 beds |
show details | |

|
#2
Worcester Rd
Princeton, MA 01541
|
2,093 sq. feet
|
2 baths 4 beds |
show details | |

|
#3
Calamint Hill Rd S
Princeton, MA 01541
|
- sq. feet
|
- baths - beds |
show details | |

|
#4
N Brookfield Rd
Oakham, MA 01068
|
1,078 sq. feet
|
1 baths 2 beds |
$439,900
|
show details |

|
#5
Sylvan Ave
Leominster, MA 01453
|
720 sq. feet
|
1 baths 2 beds |
$375,000
|
show details |

|
#6
Parker St
Gardner, MA 01440
|
1,980 sq. feet
|
2 baths 4 beds |
$469,900
|
show details |

|
#7
Great Rd
Shirley, MA 01464
|
1,672 sq. feet
|
1 baths 2 beds |
$464,900
|
show details |

|
#8
Pearl Hill Rd
Fitchburg, MA 01420
|
2,152 sq. feet
|
2 baths 3 beds |
$529,900
|
show details |

|
#9
Hemlock Dr
Lunenburg, MA 01462
|
696 sq. feet
|
1 baths 2 beds |
show details | |

|
#10
Hawkins St
Worcester, MA 01604
|
864 sq. feet
|
1 baths 3 beds |
show details |
| Photo | Address | Area | Beds / Baths | Price | Details |
|---|---|---|---|---|---|

|
#11
Loxwood St
Worcester, MA 01604
|
1,001 sq. feet
|
1 baths 2 beds |
show details | |

|
#12
Grove Ave
Leominster, MA 01453
|
3,097 sq. feet
|
1 baths 4 beds |
show details | |

|
#13
Garnet St
Fitchburg, MA 01420
|
6,112 sq. feet
|
5 baths 8 beds |
show details | |

|
#14
Kenberma Rd
Worcester, MA 01604
|
- sq. feet
|
2 baths 3 beds |
show details | |

|
#15
Treadwell Ter
Spencer, MA 01562
|
960 sq. feet
|
1 baths 3 beds |
show details | |

|
#16
Sugar Rd
Bolton, MA 01740
|
1,988 sq. feet
|
2 baths 3 beds |
show details | |

|
#17
West Rd
Ashby, MA 01431
|
7,000 sq. feet
|
3 baths 10 beds |
show details | |

|
#18
Redfield Rd
Cherry Valley, MA 01611
|
1,412 sq. feet
|
1 baths 3 beds |
show details | |

|
#19
Pocasset Ave
Worcester, MA 01606
|
2,090 sq. feet
|
3 baths 3 beds |
show details | |

|
#20
Massachusetts Ave
Lunenburg, MA 01462
|
864 sq. feet
|
1 baths 2 beds |
show details |
| Photo | Address | Area | Beds / Baths | Price | Details |
|---|---|---|---|---|---|

|
#21
Maple Ave
Shrewsbury, MA 01545
|
2,192 sq. feet
|
3 baths 4 beds |
show details | |

|
#22
Saint James Rd
Shrewsbury, MA 01545
|
1,755 sq. feet
|
1 baths 3 beds |
show details | |

|
#23
Northboro St
Worcester, MA 01604
|
1,284 sq. feet
|
2 baths 3 beds |
show details | |

|
#24
Burncoat St
Worcester, MA 01606
|
1,292 sq. feet
|
2 baths 3 beds |
show details | |

|
#25
Isabella St
Worcester, MA 01603
|
1,400 sq. feet
|
1 baths 3 beds |
show details | |

|
#26
Englewood Ave
Worcester, MA 01603
|
2,730 sq. feet
|
1 baths 6 beds |
show details | |

|
#27
Queen Lake Rd
Athol, MA 01331
|
3,416 sq. feet
|
2 baths 4 beds |
show details | |

|
#28
Copperfield Rd
Worcester, MA 01602
|
1,682 sq. feet
|
1 baths 3 beds |
show details | |

|
#29
Southbridge St Rm 305
Worcester, MA 01608
|
500 sq. feet
|
1 baths 1 beds |
show details | |

|
#30
Sunnyview Hts
Worcester, MA 01602
|
1,104 sq. feet
|
1 baths 3 beds |
show details |
| Photo | Address | Area | Beds / Baths | Price | Details |
|---|---|---|---|---|---|

|
#31
Minthorne St
Worcester, MA 01603
|
2,345 sq. feet
|
1 baths 4 beds |
show details | |

|
#32
Chapel St
Leicester, MA 01524
|
1,152 sq. feet
|
1 baths 3 beds |
show details | |

|
#33
Marietta Ave
Shrewsbury, MA 01545
|
1,572 sq. feet
|
2 baths 4 beds |
show details | |

|
#34
2nd St
Worcester, MA 01602
|
1,152 sq. feet
|
1 baths 2 beds |
show details | |

|
#35
3rd St
Worcester, MA 01602
|
864 sq. feet
|
1 baths 3 beds |
show details | |

|
#36
Avon Dr
Shrewsbury, MA 01545
|
1,442 sq. feet
|
2 baths 3 beds |
show details | |

|
#37
Halcyon Dr
Worcester, MA 01606
|
1,745 sq. feet
|
2 baths 2 beds |
show details | |

|
#38
White St
Lunenburg, MA 01462
|
1,158 sq. feet
|
1 baths 2 beds |
show details | |

|
#39
Westmorland Dr
Worcester, MA 01602
|
1,792 sq. feet
|
1 baths 4 beds |
show details | |

|
#40
Roseville Ln
Worcester, MA 01603
|
1,282 sq. feet
|
2 baths 3 beds |
show details |
| Photo | Address | Area | Beds / Baths | Price | Details |
|---|---|---|---|---|---|

|
#41
Dartmouth St
Worcester, MA 01604
|
3,963 sq. feet
|
3 baths 9 beds |
show details | |

|
#42
Hollis St
Worcester, MA 01610
|
1,346 sq. feet
|
2 baths 3 beds |
show details | |

|
#43
Richards St
Worcester, MA 01603
|
1,144 sq. feet
|
1 baths 3 beds |
show details | |

|
#44
Francis Ave
Shrewsbury, MA 01545
|
1,849 sq. feet
|
1 baths 3 beds |
show details | |

|
#45
Bleeker St
Worcester, MA 01604
|
937 sq. feet
|
1 baths 4 beds |
show details | |

|
#46
Penn Ave
Worcester, MA 01604
|
2,406 sq. feet
|
2 baths 4 beds |
show details | |

|
#47
Hastings Rd
Spencer, MA 01562
|
2,058 sq. feet
|
1 baths 5 beds |
show details | |

|
#48
Cooney Rd
Spencer, MA 01562
|
2,248 sq. feet
|
1 baths 3 beds |
show details | |

|
#49
Ayer Rd
Shirley, MA 01464
|
1,134 sq. feet
|
1 baths 2 beds |
show details | |

|
Check over 1 million property listings on Foreclosure.com!
|
browse all offers | |||
Latest news about housing in Princeton, MA collected exclusively by city-data.com from local newspapers, TV, and radio stations

 | Post homes in MA that people like (55 replies) |
| How Much Massachusetts Households Make Per Year: Census Data (37 replies) |
| household income map of Boston area (75 replies) |
| 2024 Real Estate Observations (909 replies) |
| 2023 Real Estate Observations (5278 replies) |
| Salem Apartments (2 replies) |

Household type by relationship:
Households: 771,507- In family households: 644,137 (138,415 male householders, 64,187 female householders)
151,406 spouses, 234,038 children (220,335 natural, 5,096 adopted, 8,607 stepchildren), 11,080 grandchildren, 6,742 brothers or sisters, 7,870 parents, foster children, 7,297 other relatives, 18,119 non-relatives
- In nonfamily households: 127,370 (47,312 male householders (35,337 living alone)), 53,166 female householders (44,100 living alone)), 26,892 nonrelatives
- In group quarters: 27,045 (11,315 institutionalized population)
135,695 married couples with children.
42,745 single-parent households (8,218 men, 34,527 women).
94.3% of residents of Princeton speak English at home.
1.9% of residents speak Spanish at home (84% speak English very well, 5% speak English well, 5% speak English not well, 7% don't speak English at all).
3.6% of residents speak other Indo-European language at home (87% speak English very well, 13% speak English well).
0.2% of residents speak Asian or Pacific Island language at home (100% speak English well).
0.1% of residents speak other language at home (100% speak English very well).
Foreign born population: 333 (8.6%)
(58.3% of them are naturalized citizens)
| Here: | 7.5 |
| State: | 6.5 |
| Here: | 4.3 |
| State: | 4.0 |

- Bedrooms in owner-occupied houses and condos in Princeton, Massachusetts
- 0no bedroom
- 81 bedroom
- 1332 bedrooms
- 5653 bedrooms
- 2934 bedrooms
- 675+ bedrooms

- Bedrooms in renter-occupied apartments in Princeton, Massachusetts
- 0no bedroom
- 371 bedroom
- 262 bedrooms
- 373 bedrooms
- 04 bedrooms
- 05+ bedrooms

- Cars and other vehicles available in Princeton in owner-occupied houses/condos
- 29no vehicle
- 1731 vehicle
- 5862 vehicles
- 2103 vehicles
- 534 vehicles
- 155+ vehicles

- Cars and other vehicles available in Princeton in renter-occupied apartments
- 7no vehicle
- 331 vehicle
- 462 vehicles
- 103 vehicles
- 04 vehicles
- 45+ vehicles

- Rooms in owner-occupied houses in Princeton, Massachusetts
- 01 room
- 02 rooms
- 53 rooms
- 324 rooms
- 1425 rooms
- 2166 rooms
- 2467 rooms
- 1858 rooms
- 2409+ rooms

- Rooms in renter-occupied apartments in Princeton, Massachusetts
- 01 room
- 82 rooms
- 133 rooms
- 344 rooms
- 75 rooms
- 236 rooms
- 157 rooms
- 08 rooms
- 09+ rooms


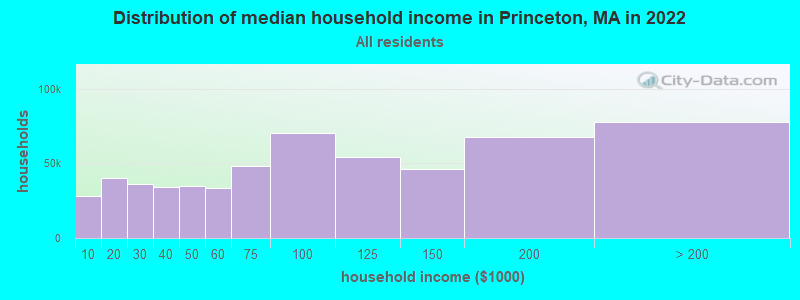
Princeton, MA household income distribution

- 28,072Less than $10,000
- 40,052$10,000 to $19,999
- 36,476$20,000 to $29,999
- 33,951$30,000 to $39,999
- 34,766$40,000 to $49,999
- 33,288$50,000 to $59,999
- 48,306$60,000 to $74,999
- 70,259$75,000 to $99,999
- 54,535$100,000 to $124,999
- 46,600$125,000 to $149,999
- 67,871$150,000 to $199,999
- 77,797$200,000 or more
Percentage of workers working in this county: 75.9%
Number of people working at home: 347 (16.0% of all workers)
Travel time to work (commute)
- Less than 5 minutes: 0
- 5 to 9 minutes: 93
- 10 to 14 minutes: 129
- 15 to 19 minutes: 157
- 20 to 24 minutes: 207
- 25 to 29 minutes: 198
- 30 to 34 minutes: 424
- 35 to 39 minutes: 100
- 40 to 44 minutes: 84
- 45 to 59 minutes: 196
- 60 to 89 minutes: 108
- 90 or more minutes: 41
Means of transportation to work:
- Drove a car alone: 1,581 (88.3%)
- Carpooled: 118 (6.6%)
- Bus or trolley bus: 8 (0.4%)
- Railroad: 5 (0.3%)
- Walked: 15 (0.8%)
- Other means: 10 (0.6%)
- Worked at home: 53 (3.0%)

- Year of entry for the foreign-born population in Princeton, Massachusetts
- 401995 to March 2000
- 421990 to 1994
- 51985 to 1989
- 41980 to 1984
- 161975 to 1979
- 131970 to 1974
- 181965 to 1969
- 26Before 1965

First ancestries reported:
- English: 728 (16.7%)
- Irish: 652 (15.0%)
- French: 360 (8.3%)
- Other: 352 (8.1%)
- Italian: 350 (8.0%)
- German: 330 (7.6%)
- Polish: 309 (7.1%)
- Swedish: 238 (5.5%)
- United States: 205 (4.7%)
- French Canadian: 195 (4.5%)
- Scottish: 180 (4.1%)
- Russian: 72 (1.7%)
- Dutch: 69 (1.6%)
- Scotch-Irish: 64 (1.5%)
- Lithuanian: 63 (1.4%)
- Danish: 31 (0.7%)
- Welsh: 25 (0.6%)
- Portuguese: 23 (0.5%)
- Norwegian: 21 (0.5%)
- Swiss: 20 (0.5%)
- Czech: 19 (0.4%)
- Hungarian: 16 (0.4%)
- Greek: 15 (0.3%)
- West Indian: 11 (0.3%)
- Arab: 3 (0.07%)
- Ukrainian: 3 (0.07%)
Most common places of birth for foreign-born residents (%):
| Princeton: | 23.2% (38) |
| Massachusetts: | 5.2% (40,247) |
| Princeton: | 15.2% (25) |
| Massachusetts: | 3.3% (25,403) |
| Princeton: | 12.2% (20) |
| Massachusetts: | 1.9% (14,883) |
| Princeton: | 7.3% (12) |
| Massachusetts: | 0.3% (2,642) |
| Princeton: | 7.3% (12) |
| Massachusetts: | 1.7% (13,456) |
| Princeton: | 5.5% (9) |
| Massachusetts: | 0.6% (4,416) |
| Princeton: | 4.9% (8) |
| Massachusetts: | 0.4% (3,319) |
| Princeton: | 4.3% (7) |
| Massachusetts: | 1.7% (12,808) |
| Princeton: | 3.0% (5) |
| Massachusetts: | 0.3% (2,135) |
| Princeton: | 3.0% (5) |
| Massachusetts: | 0.2% (1,418) |
| Princeton: | 3.0% (5) |
| Massachusetts: | 1.6% (12,350) |
| Princeton: | 3.0% (5) |
| Massachusetts: | 5.1% (39,255) |
| Princeton: | 2.4% (4) |
| Massachusetts: | 0.2% (1,729) |
| Princeton: | 1.8% (3) |
| Massachusetts: | 0.4% (3,051) |
| Princeton: | 1.8% (3) |
| Massachusetts: | 3.6% (28,086) |
| Princeton: | 1.8% (3) |
| Massachusetts: | 1.7% (12,868) |
Place of birth for U.S.-born residents:
- This state: 2,414
- Other state: 749
- Northeast: 523
- Midwest: 84
- South: 89
- West: 53
68% of Princeton residents lived in the same house 5 years ago.
Out of people who lived in different houses, 63% lived in this county.
Out of people who lived in different counties, 50% lived in Massachusetts.
Education attainment for males 25 years and older:
- No schooling: 1
- Nursery to 4th grade: 0
- 5th and 6th grade: 0
- 7th and 8th grade: 17
- 9th grade: 8
- 10th grade: 3
- 11th grade: 0
- 12th grade, no diploma: 13
- High school graduate (or equivalency): 159
- Less than 1 year of college: 46
- Some college more than 1 year, no degree: 113
- Associate degree: 133
- Bachelor's degree: 313
- Master's degree: 191
- Professional school degree: 63
- Doctorate degree: 33

Education attainment for females 25 years and older:
- No schooling: 0
- Nursery to 4th grade: 0
- 5th and 6th grade: 0
- 7th and 8th grade: 0
- 9th grade: 0
- 10th grade: 4
- 11th grade: 0
- 12th grade, no diploma: 6
- High school graduate (or equivalency): 237
- Less than 1 year of college: 37
- Some college more than 1 year, no degree: 122
- Associate degree: 104
- Bachelor's degree: 373
- Master's degree: 189
- Professional school degree: 46
- Doctorate degree: 7


Housing units in structures:
- One, detached: 1,127
- One, attached: 9
- Two: 26
- 3 or 4: 14
- 5 to 9: 17
- Mobile homes: 3
Median worth of mobile homes: $253,297

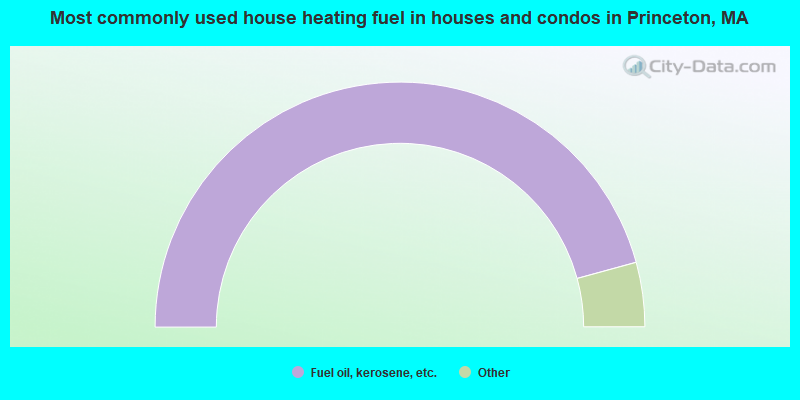
- 91.5%Fuel oil, kerosene, etc.
- 3.8%Wood
- 2.9%Electricity
- 1.2%Bottled, tank, or LP gas
- 0.4%Other fuel
- 0.3%Utility gas
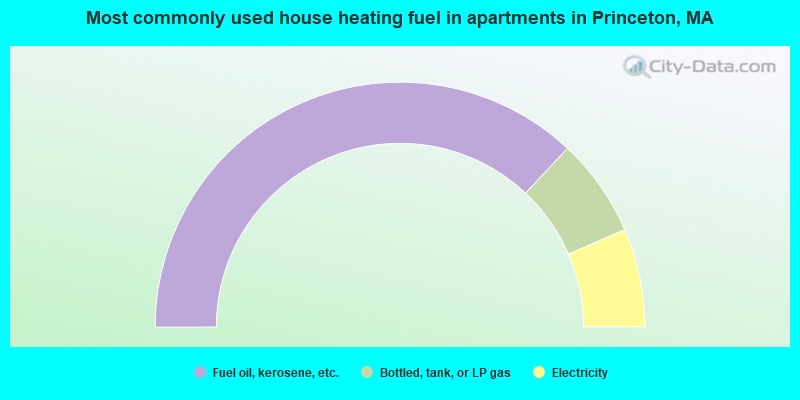
- 74.0%Fuel oil, kerosene, etc.
- 13.0%Bottled, tank, or LP gas
- 13.0%Electricity
Private vs. public school enrollment:
| Here: | 7.1% |
| Massachusetts: | 10.8% |
| Here: | 15.0% |
| Massachusetts: | 12.2% |
| Here: | 28.2% |
| Massachusetts: | 48.2% |


