Pullman, WA (Washington) Houses and Residents
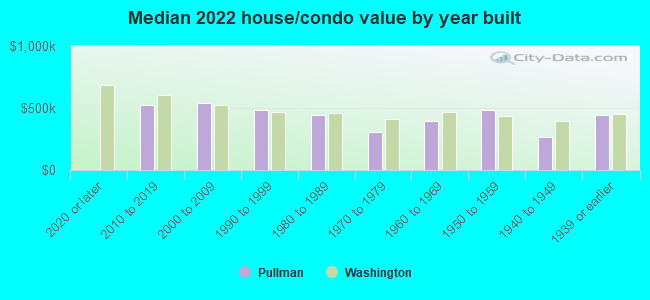
| Pullman: | $455,937 |
| Washington: | $569,500 |
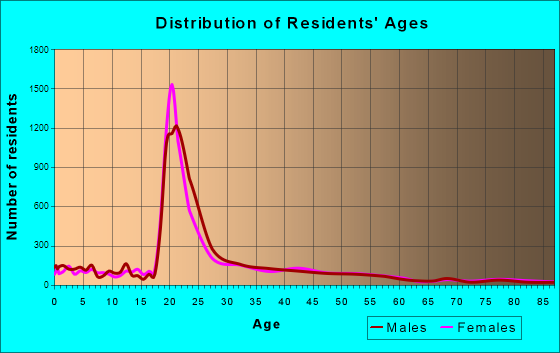
Total population: 31,682 (Urban population: 24,651 (all inside urban clusters), Rural population: 89 (all nonfarm))
Houses: 14,277 (12,333 occupied: 3,608 owner occupied, 8,767 renter occupied)
| % of renters here: | 71% |
| State: | 36% |
Housing density: 1,586 houses/condos per square mile
Median price asked for vacant for-sale houses and condos in 2022: $449,597.
Median contract rent in 2022: $934 (lower quartile is $765, upper quartile is $1,146)
Median rent asked for vacant for-rent units in 2022: $1,339
Median gross rent in Pullman, WA in 2022: $994
Housing units in Pullman with a mortgage: 2,341 (240 second mortgage, 0 home equity loan, 154 both second mortgage and home equity loan)
Houses without a mortgage: 126
Median household income for houses/condos with a mortgage: $128,052
Median household income for apartments without a mortgage: $106,097
Median monthly housing costs: $1,010
Compare current foreclosures near Pullman, WA:
| Photo | Address | Area | Beds / Baths | Price | Details |
|---|---|---|---|---|---|

|
#1
NE Terre View Dr Apt B03
Pullman, WA 99163
|
- sq. feet
|
- baths - beds |
show details | |

|
#2
NW Deane St
Pullman, WA 99163
|
- sq. feet
|
- baths - beds |
show details | |

|
#3
NE Terre View Dr Apt 206
Pullman, WA 99163
|
- sq. feet
|
- baths - beds |
show details | |

|
#4
SE Carolstar Dr
Pullman, WA 99163
|
- sq. feet
|
- baths - beds |
show details | |

|
#5
W Pullman Rd # 307
Moscow, ID 83843
|
- sq. feet
|
- baths - beds |
show details | |

|
#6
N Main St Apt 2
Moscow, ID 83843
|
- sq. feet
|
- baths - beds |
show details | |

|
#7
E 3rd St
Moscow, ID 83843
|
- sq. feet
|
- baths - beds |
show details | |

|
#8
N Polk Ext Apt 4
Moscow, ID 83843
|
- sq. feet
|
- baths - beds |
show details | |

|
#9
1/2 N Hayes St
Moscow, ID 83843
|
- sq. feet
|
- baths - beds |
show details | |

|
#10
Palouse Cove Rd Unit 3
Palouse, WA 99161
|
- sq. feet
|
- baths - beds |
show details |
| Photo | Address | Area | Beds / Baths | Price | Details |
|---|---|---|---|---|---|

|
#11
S Polk St
Moscow, ID 83843
|
- sq. feet
|
- baths - beds |
show details | |

|
#12
S Blaine St
Moscow, ID 83843
|
- sq. feet
|
- baths - beds |
show details | |

|
#13
N Grant St
Moscow, ID 83843
|
- sq. feet
|
- baths - beds |
show details | |

|
#14
E Mohr St
Palouse, WA 99161
|
- sq. feet
|
- baths - beds |
show details | |

|
Check over 1 million property listings on Foreclosure.com!
|
browse all offers | |||

Latest news about housing in Pullman, WA collected exclusively by city-data.com from local newspapers, TV, and radio stations

 | Apartments/townhomes in Rosalia, WA or Oakesdale, WA (1 reply) |
| Which of these Ellensburg, Pullman or Cheney (17 replies) |
| Where should I move? Looking for community… (59 replies) |
| If cost were not a factor, where in Washington would you live? (140 replies) |
| suggest a small town (31 replies) |
| Pullman area relo help needed: real estate and job hunt (0 replies) |
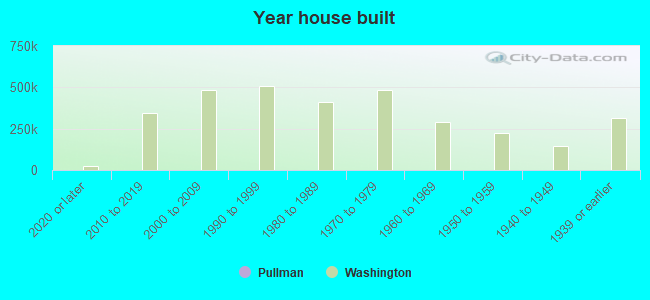
Median year apartment built: 1990
Household type by relationship:
Households: 32,376- Male householders: 6,693 (2,699 living alone), Female householders: 5,429 (1,640 living alone)
3,785 spouses (3,721 opposite-sex spouses), 1,137 unmarried partners, (1,094 opposite-sex unmarried partners), 4,594 children (4,188 natural, 294 adopted, 111 stepchildren), 17 grandchildren, 202 brothers or sisters, 182 parents, 31 foster children, 102 other relatives, 4,194 non-relatives
- In group quarters: 6,006
Size of family households: 2,241 2-persons, 1,090 3-persons, 751 4-persons, 470 5-persons, 92 6-persons, 86 7-or-more-persons.
Size of nonfamily households: 4,580 1-person, 2,621 2-persons, 372 3-persons, 167 4-persons, 74 5-persons.
2,905 married couples with children.
809 single-parent households (238 men, 571 women).
81.7% of residents of Pullman speak English at home.
4.1% of residents speak Spanish at home (84% speak English very well, 10% speak English well, 3% speak English not well, 3% don't speak English at all).
4.9% of residents speak other Indo-European language at home (76% speak English very well, 12% speak English well, 12% speak English not well).
7.1% of residents speak Asian or Pacific Island language at home (53% speak English very well, 35% speak English well, 9% speak English not well, 3% don't speak English at all).
1.4% of residents speak other language at home (81% speak English very well, 13% speak English well, 6% speak English not well).
Foreign born population: 4,297 (13.3%)
(28.9% of them are naturalized citizens)
| Here: | 7.1 |
| State: | 6.5 |
| Here: | 3.5 |
| State: | 3.9 |
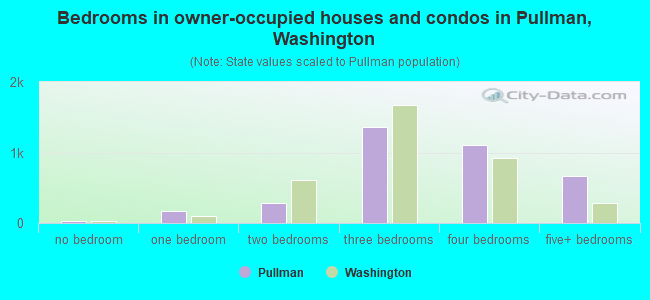
- Bedrooms in owner-occupied houses and condos in Pullman, Washington
- 24no bedroom
- 1751 bedroom
- 2852 bedrooms
- 1,3623 bedrooms
- 1,1034 bedrooms
- 6615+ bedrooms
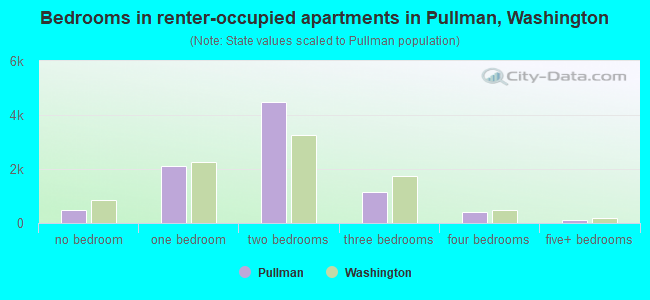
- Bedrooms in renter-occupied apartments in Pullman, Washington
- 475no bedroom
- 2,1071 bedroom
- 4,4772 bedrooms
- 1,1653 bedrooms
- 4234 bedrooms
- 1215+ bedrooms
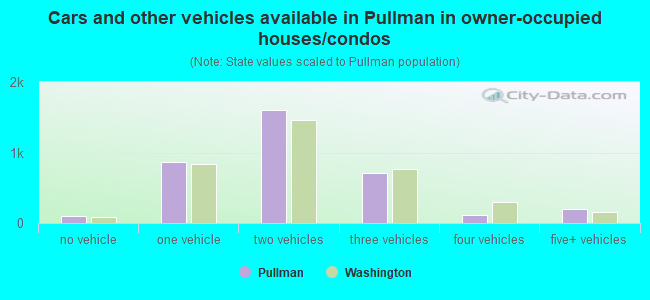
- Cars and other vehicles available in Pullman in owner-occupied houses/condos
- 105no vehicle
- 8691 vehicle
- 1,6052 vehicles
- 7163 vehicles
- 1114 vehicles
- 2025+ vehicles
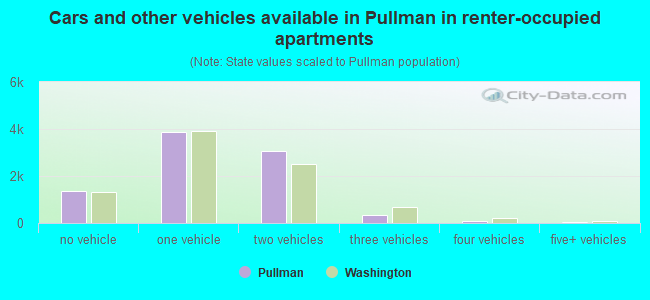
- Cars and other vehicles available in Pullman in renter-occupied apartments
- 1,346no vehicle
- 3,8891 vehicle
- 3,0632 vehicles
- 3343 vehicles
- 1024 vehicles
- 335+ vehicles
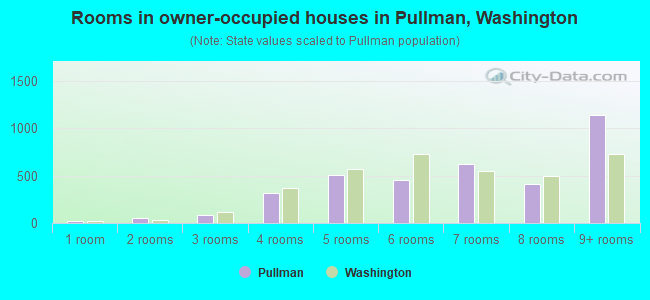
- Rooms in owner-occupied houses in Pullman, Washington
- 241 room
- 572 rooms
- 813 rooms
- 3204 rooms
- 5025 rooms
- 4546 rooms
- 6247 rooms
- 4098 rooms
- 1,1379+ rooms
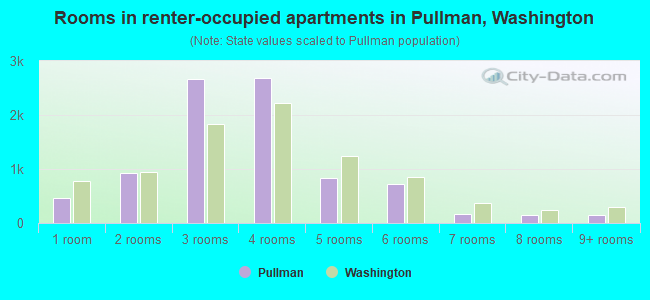
- Rooms in renter-occupied apartments in Pullman, Washington
- 4621 room
- 9292 rooms
- 2,6663 rooms
- 2,6804 rooms
- 8285 rooms
- 7296 rooms
- 1697 rooms
- 1498 rooms
- 1569+ rooms
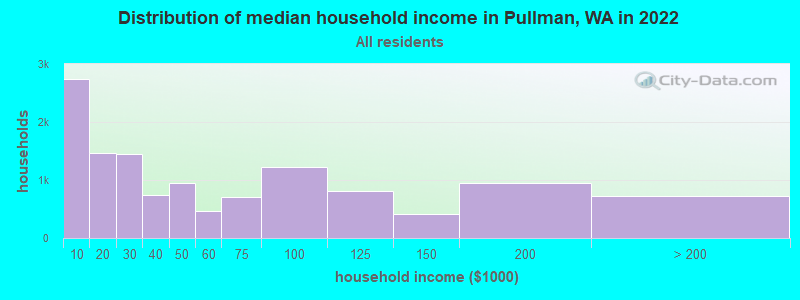
Pullman, WA household income distribution

- 2,738Less than $10,000
- 1,472$10,000 to $19,999
- 1,450$20,000 to $29,999
- 745$30,000 to $39,999
- 950$40,000 to $49,999
- 470$50,000 to $59,999
- 711$60,000 to $74,999
- 1,223$75,000 to $99,999
- 809$100,000 to $124,999
- 413$125,000 to $149,999
- 941$150,000 to $199,999
- 717$200,000 or more
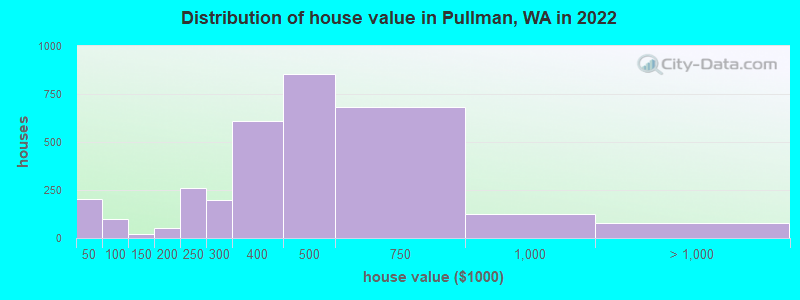
Home value of owner - occupied houses in 2022 in Pullman, WA
-
- 62Less than $10,000
- 50$10,000 to $14,999
- 9$15,000 to $19,999
- 22$20,000 to $24,999
- 10$25,000 to $29,999
- 9$30,000 to $34,999
- 9$35,000 to $39,999
- 25$40,000 to $49,999
- 49$80,000 to $89,999
- 23$90,000 to $99,999
- 13$100,000 to $124,999
- 9$125,000 to $149,999
- 35$150,000 to $174,999
- 14$175,000 to $199,999
- 260$200,000 to $249,999
- 197$250,000 to $299,999
- 607$300,000 to $399,999
- 856$400,000 to $499,999
- 679$500,000 to $749,999
- 125$750,000 to $999,999
- 7$1,000,000 to $1,499,999
- 71$2,000,000 or more
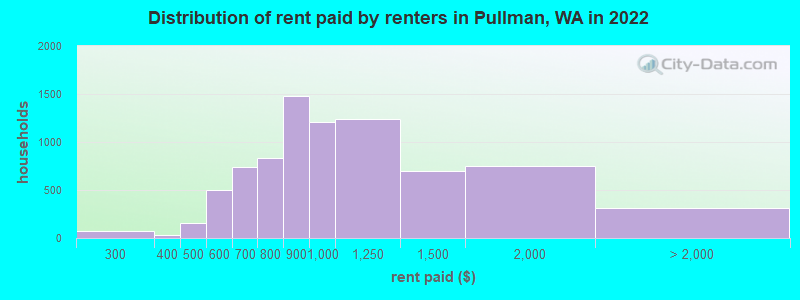
Rent paid by renters in 2022 in Pullman, WA
-
- 15$200 to $249
- 55$250 to $299
- 26$350 to $399
- 13$400 to $449
- 138$450 to $499
- 383$500 to $549
- 119$550 to $599
- 429$600 to $649
- 310$650 to $699
- 539$700 to $749
- 288$750 to $799
- 1,475$800 to $899
- 1,206$900 to $999
- 1,242$1,000 to $1,249
- 699$1,250 to $1,499
- 749$1,500 to $1,999
- 87$2,000 to $2,499
- 50$2,500 to $2,999
- 15$3,000 to $3,499
- 158No cash rent
Percentage of workers working in this county: 92.1%
Number of people working at home: 2,033 (12.6% of all workers)
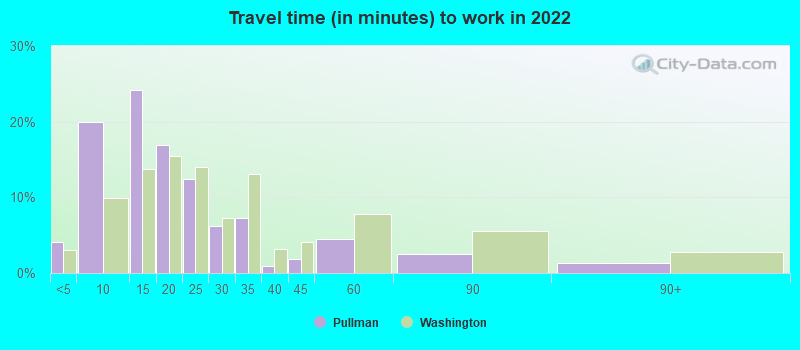
Travel time to work (commute)
- Less than 5 minutes: 779
- 5 to 9 minutes: 3,471
- 10 to 14 minutes: 4,294
- 15 to 19 minutes: 2,697
- 20 to 24 minutes: 1,270
- 25 to 29 minutes: 696
- 30 to 34 minutes: 441
- 35 to 39 minutes: 14
- 40 to 44 minutes: 297
- 45 to 59 minutes: 221
- 60 to 89 minutes: 38
- 90 or more minutes: 32
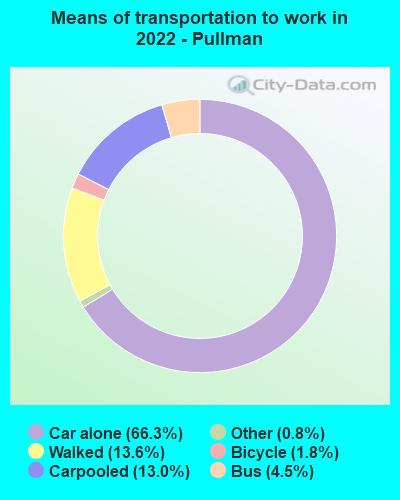
Means of transportation to work:
- Drove a car alone: 11,601 (58.2%)
- Carpooled: 2,353 (11.8%)
- Bus: 528 (2.7%)
- Taxi: 135 (0.7%)
- Bicycle: 287 (1.4%)
- Walked: 2,421 (12.2%)
- Worked at home: 2,033 (10.2%)
- Unemployment by race in 2022
- Unemployment rate for White non-Hispanic residents
- 4.8%Males
- 7.0%Females
- Unemployment rate for Black residents
- 37.2%Males
- Unemployment rate for American Indian and Alaska Native residents
- 49.6%Females
- Unemployment rate for Asian residents
- 5.1%Males
- 10.9%Females
- Unemployment rate for other race residents
- 3.1%Males
- 5.0%Females
- Unemployment rate for two or more race residents
- 0.7%Males
- 4.0%Females
- Unemployment rate for Hispanic or Latino residents
- 9.5%Males
- 6.0%Females
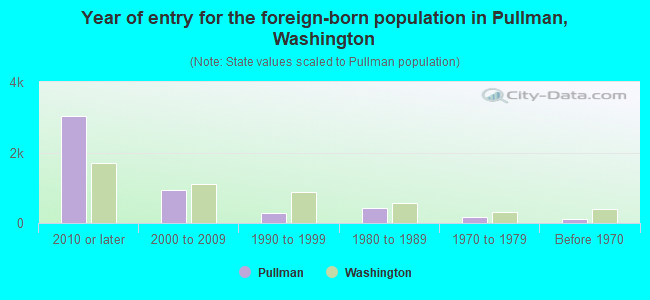
- Year of entry for the foreign-born population in Pullman, Washington
- 3,0262010 or later
- 9472000 to 2009
- 2901990 to 1999
- 4181980 to 1989
- 1591970 to 1979
- 115Before 1970
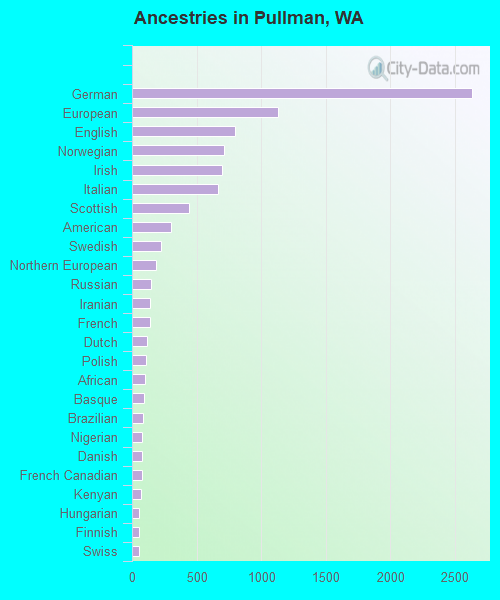
First ancestries reported:
- German: 2,635 (16.1%)
- European: 1,129 (6.9%)
- English: 801 (4.9%)
- Norwegian: 713 (4.3%)
- Irish: 699 (4.3%)
- Italian: 666 (4.1%)
- Scottish: 442 (2.7%)
- American: 304 (1.9%)
- Swedish: 221 (1.3%)
- Northern European: 187 (1.1%)
- Russian: 145 (0.9%)
- Iranian: 138 (0.8%)
- French: 137 (0.8%)
- Dutch: 116 (0.7%)
- Polish: 106 (0.6%)
- African: 103 (0.6%)
- Basque: 91 (0.6%)
- Brazilian: 84 (0.5%)
- Nigerian: 81 (0.5%)
- Danish: 78 (0.5%)
- French Canadian: 77 (0.5%)
- Kenyan: 69 (0.4%)
- Hungarian: 58 (0.4%)
- Finnish: 56 (0.3%)
- Swiss: 55 (0.3%)
- Ukrainian: 55 (0.3%)
- British: 43 (0.3%)
- Canadian: 41 (0.2%)
- Palestinian: 36 (0.2%)
- Scotch-Irish: 35 (0.2%)
- Portuguese: 29 (0.2%)
- Yugoslavian: 27 (0.2%)
- Turkish: 24 (0.1%)
- Scandinavian: 23 (0.1%)
- Egyptian: 21 (0.1%)
- Eastern European: 20 (0.1%)
- Welsh: 19 (0.1%)
- Somali: 18 (0.1%)
- Greek: 15 (0.09%)
- Guyanese: 11 (0.07%)
- Ethiopian: 11 (0.07%)
- Haitian: 10 (0.06%)
- Serbian: 9 (0.05%)
- Slovene: 9 (0.05%)
- Czechoslovakian: 8 (0.05%)
- Czech: 7 (0.04%)
- Lithuanian: 7 (0.04%)
- West Indian: 7 (0.04%)
- Pennsylvania German: 6 (0.04%)
Most common places of birth for foreign-born residents (%):
| Pullman: | 25.0% (1,073) |
| Washington: | 7.4% (84,470) |
| Pullman: | 13.1% (561) |
| Washington: | 8.9% (101,353) |
| Pullman: | 5.8% (248) |
| Washington: | 5.4% (62,003) |
| Pullman: | 4.3% (185) |
| Washington: | 21.1% (241,655) |
| Pullman: | 3.4% (146) |
| Washington: | 0.9% (9,937) |
| Pullman: | 3.3% (143) |
| Washington: | 1.6% (17,761) |
| Pullman: | 3.2% (138) |
| Washington: | 4.1% (47,238) |
| Pullman: | 3.0% (129) |
| Washington: | 4.3% (48,886) |
| Pullman: | 3.0% (127) |
| Washington: | 0.8% (9,359) |
| Pullman: | 2.9% (125) |
| Washington: | 1.1% (12,735) |
| Pullman: | 2.6% (111) |
| Washington: | 1.5% (16,607) |
| Pullman: | 2.6% (110) |
| Washington: | 0.2% (2,090) |
| Pullman: | 2.5% (107) |
| Washington: | 6.3% (71,661) |
| Pullman: | 2.4% (101) |
| Washington: | 1.0% (10,943) |
| Pullman: | 2.3% (100) |
| Washington: | 1.9% (21,540) |
| Pullman: | 2.3% (98) |
| Washington: | 0.3% (3,638) |
| Pullman: | 2.2% (95) |
| Washington: | 0.9% (10,499) |
| Pullman: | 1.9% (81) |
| Washington: | 0.2% (1,970) |
| Pullman: | 1.9% (80) |
| Washington: | 0.2% (1,754) |
| Pullman: | 1.8% (79) |
| Washington: | 0.6% (6,500) |
| Pullman: | 1.7% (75) |
| Washington: | 0.1% (1,536) |
| Pullman: | 1.7% (73) |
| Washington: | 0.3% (3,995) |
Place of birth for U.S.-born residents:
- This state: 14,331
- Other state: 12,995
- Northeast: 888
- Midwest: 1,913
- South: 2,266
- West: 7,916
63.4% of Pullman residents lived in the same house 1 years ago.
Out of people who lived in different houses, 27.3% lived in this county.
Out of people who lived in different counties, 63.0% lived in Washington.
| Pullman: | 63.4% |
| State average: | 85.2% |
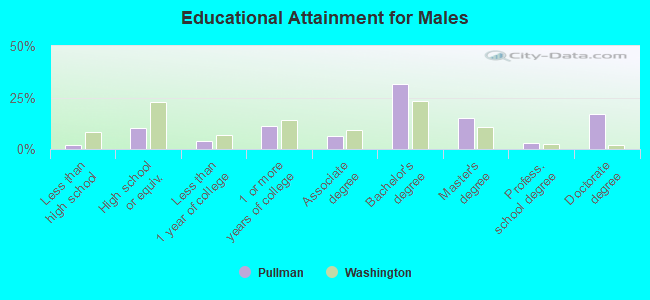
Education attainment for males 25 years and older:
- No schooling: 13
- Nursery to 4th grade: 0
- 5th and 6th grade: 27
- 7th and 8th grade: 0
- 9th grade: 0
- 10th grade: 0
- 11th grade: 2
- 12th grade, no diploma: 85
- High school graduate (or equivalency): 732
- Less than 1 year of college: 293
- Some college more than 1 year, no degree: 806
- Associate degree: 470
- Bachelor's degree: 2,269
- Master's degree: 1,087
- Professional school degree: 221
- Doctorate degree: 1,219
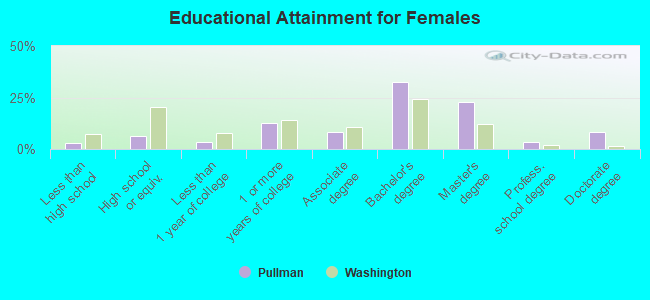
Education attainment for females 25 years and older:
- No schooling: 67
- Nursery to 4th grade: 0
- 5th and 6th grade: 0
- 7th and 8th grade: 19
- 9th grade: 27
- 10th grade: 14
- 11th grade: 1
- 12th grade, no diploma: 57
- High school graduate (or equivalency): 425
- Less than 1 year of college: 229
- Some college more than 1 year, no degree: 857
- Associate degree: 552
- Bachelor's degree: 2,193
- Master's degree: 1,542
- Professional school degree: 223
- Doctorate degree: 545
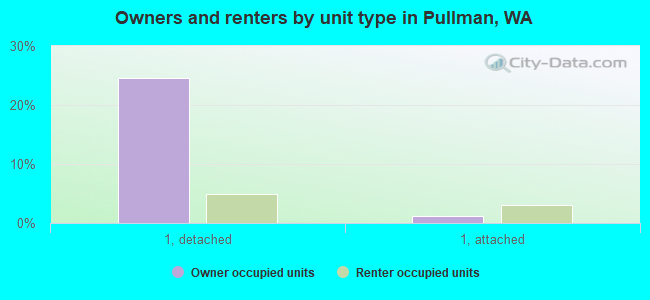
Housing units in structures:
- One, detached: 4,004
- One, attached: 633
- Two: 835
- 3 or 4: 971
- 5 to 9: 2,422
- 10 to 19: 3,231
- 20 to 49: 1,006
- 50 or more: 812
- Mobile homes: 359
Housing units lacking complete kitchen facilities in 2022: 0.8%
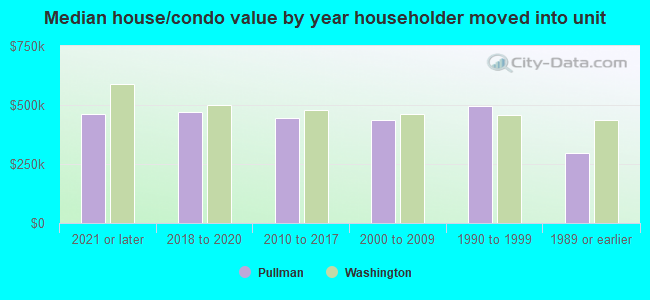
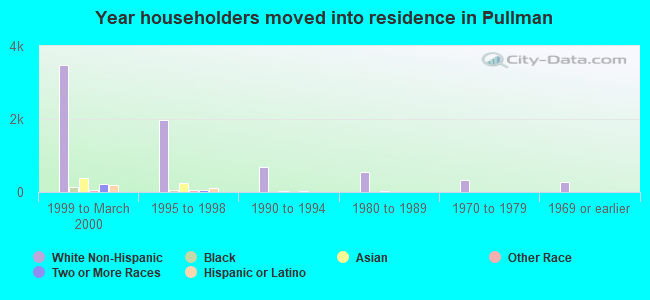
House/condo owner moved in on average 8 years ago
Renter moved in on average 1 years ago
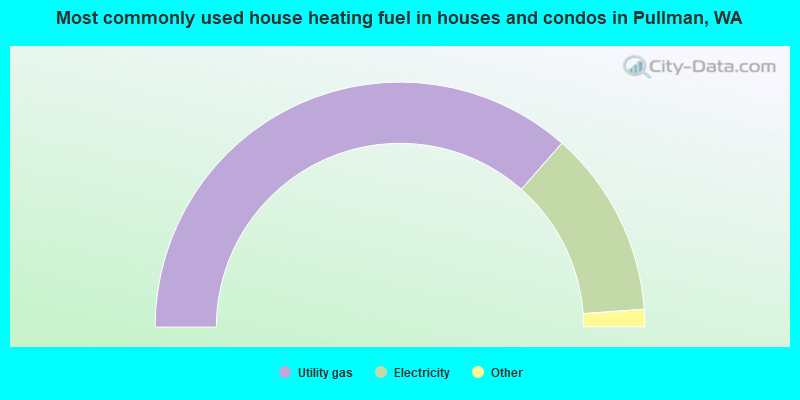
- 73.0%Utility gas
- 24.7%Electricity
- 1.9%Bottled, tank, or LP gas
- 0.3%Wood
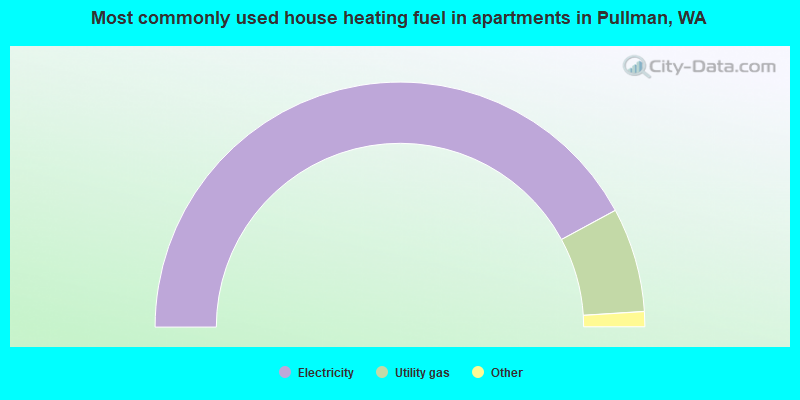
- 84.2%Electricity
- 13.8%Utility gas
- 0.9%Bottled, tank, or LP gas
- 0.4%Fuel oil, kerosene, etc.
- 0.3%Other fuel
- 0.2%No fuel used
- 0.2%Wood
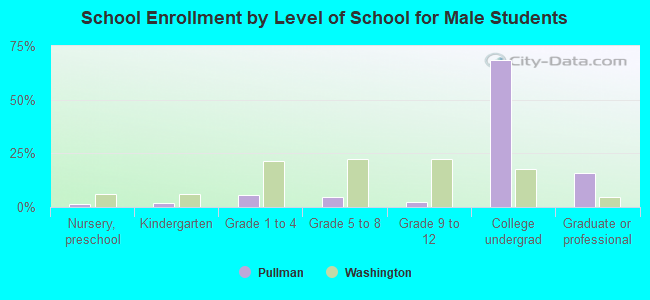
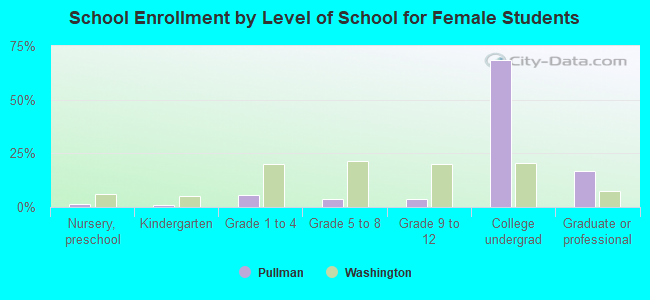
Private vs. public school enrollment:
| Here: | 19.1% |
| Washington: | 12.4% |
| Here: | 12.7% |
| Washington: | 9.2% |
| Here: | 1.1% |
| Washington: | 16.5% |