Housing density: 529 houses/condos per square mile
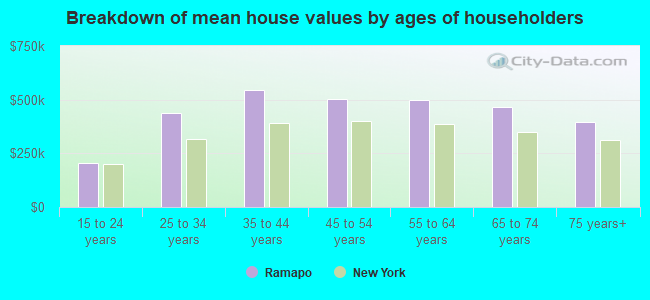
Median price asked for vacant for-sale houses and condos in 2022 in this county: $364,915.
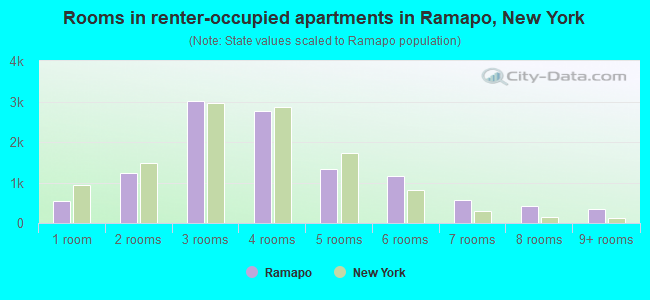
Median contract rent in 2022: $1,460 (lower quartile is $937, upper quartile is $1,826)
Median rent asked for vacant for-rent units in 2022: $1,544
Median gross rent in Ramapo, NY in 2022: $1,606
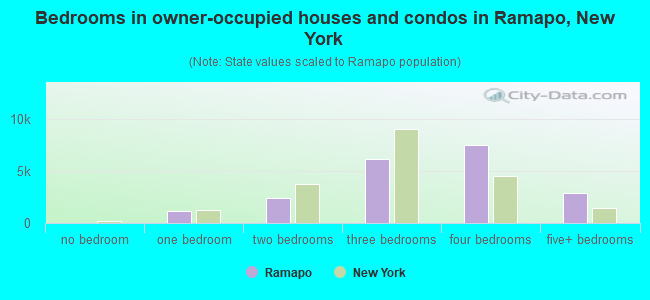
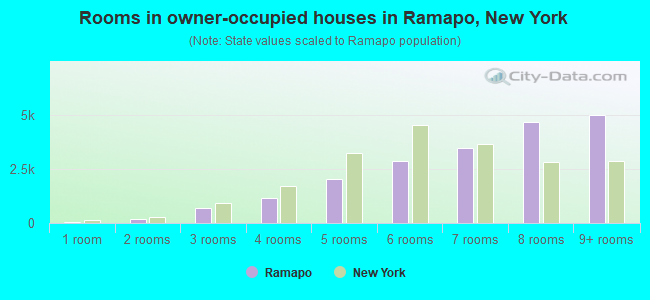
Housing units in Ramapo with a mortgage: 12,701 (1,110 second mortgage, 1,604 home equity loan, 35 both second mortgage and home equity loan) Houses without a mortgage: 4,126
In family households: 273,452 (52,549 male householders, 21,607 female householders)
59,199 spouses, 110,082 children (106,179 natural, 1,852 adopted, 2,051 stepchildren), 4,832 grandchildren, 4,030 brothers or sisters, 3,887 parents, foster children, 6,514 other relatives, 7,870 non-relatives
In nonfamily households: 31,052 (10,342 male householders (8,132 living alone)), 14,744 female householders (12,788 living alone)), 5,966 nonrelatives
In group quarters: 7,183 (2,368 institutionalized population)
64,005 married couples with children.
9,958 single-parent households (2,044 men, 7,914 women).
59.1% of residents of Ramapo speak English at home.
7.8% of residents speak Spanish at home (46% speak English very well, 18% speak English well, 25% speak English not well, 12% don't speak English at all).
25.9% of residents speak other Indo-European language at home (54% speak English very well, 27% speak English well, 16% speak English not well, 4% don't speak English at all).
3.4% of residents speak Asian or Pacific Island language at home (61% speak English very well, 26% speak English well, 10% speak English not well, 3% don't speak English at all).
3.8% of residents speak other language at home (70% speak English very well, 19% speak English well, 9% speak English not well, 2% don't speak English at all).
Foreign born population: 30,834 (23.9%)
(62.9% of them are naturalized citizens)
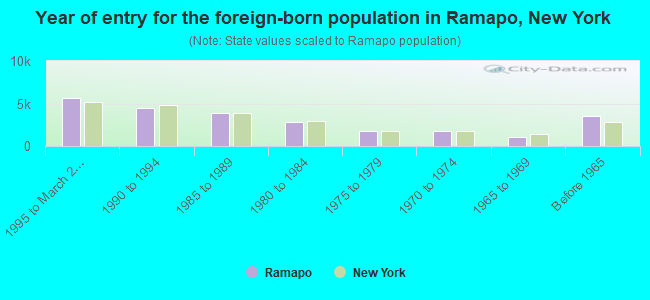
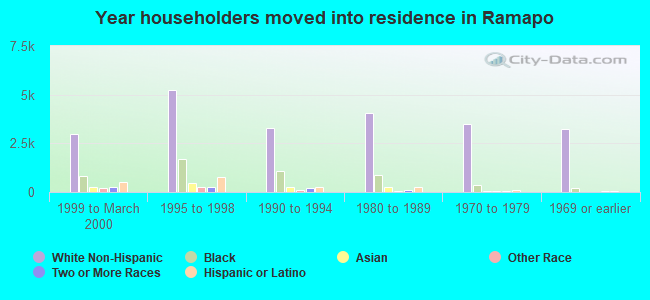
Year of entry for the foreign-born population in Ramapo, New York
5,6201995 to March 2000
4,4281990 to 1994
3,8871985 to 1989
2,8451980 to 1984
1,7211975 to 1979
1,7211970 to 1974
1,0621965 to 1969
3,564Before 1965
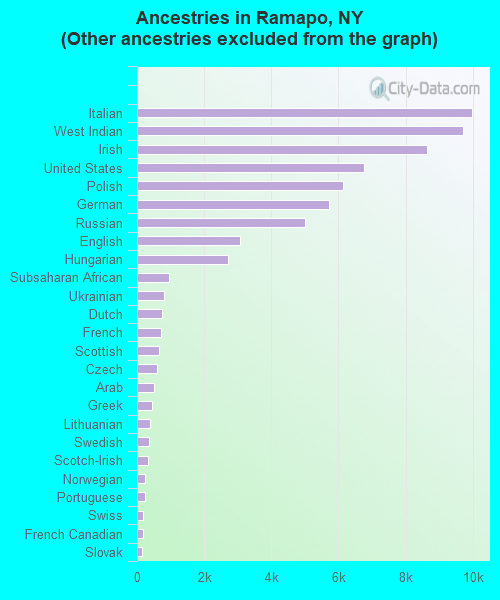
First ancestries reported:
Other: 42,501 (39.4%)
Italian: 9,987 (9.3%)
West Indian: 9,716 (9.0%)
Irish: 8,638 (8.0%)
United States: 6,752 (6.3%)
Polish: 6,124 (5.7%)
German: 5,711 (5.3%)
Russian: 4,997 (4.6%)
English: 3,082 (2.9%)
Hungarian: 2,708 (2.5%)
Subsaharan African: 940 (0.9%)
Ukrainian: 807 (0.7%)
Dutch: 748 (0.7%)
French: 728 (0.7%)
Scottish: 656 (0.6%)
Czech: 603 (0.6%)
Arab: 505 (0.5%)
Greek: 434 (0.4%)
Lithuanian: 375 (0.3%)
Swedish: 348 (0.3%)
Scotch-Irish: 336 (0.3%)
Norwegian: 249 (0.2%)
Portuguese: 231 (0.2%)
Swiss: 182 (0.2%)
French Canadian: 179 (0.2%)
Slovak: 153 (0.1%)
Welsh: 105 (0.10%)
Danish: 63 (0.06%)
Most common places of birth for foreign-born residents (%):
Haiti
Ramapo:
23.5% (5,850)
New York:
3.2% (125,475)
Guatemala
Ramapo:
6.3% (1,561)
New York:
0.9% (33,208)
Philippines
Ramapo:
5.2% (1,291)
New York:
1.9% (72,408)
India
Ramapo:
5.0% (1,251)
New York:
3.0% (117,238)
Jamaica
Ramapo:
4.5% (1,108)
New York:
5.9% (226,470)
Israel
Ramapo:
4.4% (1,091)
New York:
0.8% (29,390)
Poland
Ramapo:
4.0% (985)
New York:
2.4% (93,187)
Ecuador
Ramapo:
3.6% (904)
New York:
3.6% (139,226)
Mexico
Ramapo:
3.2% (797)
New York:
4.2% (161,189)
Germany
Ramapo:
2.8% (686)
New York:
1.8% (69,327)
United Kingdom
Ramapo:
2.4% (587)
New York:
1.6% (62,237)
Russia
Ramapo:
1.9% (473)
New York:
2.4% (94,595)
Ukraine
Ramapo:
1.8% (453)
New York:
2.1% (82,238)
Italy
Ramapo:
1.8% (435)
New York:
3.8% (147,729)
Korea
Ramapo:
1.7% (418)
New York:
2.5% (97,933)
Canada
Ramapo:
1.6% (390)
New York:
1.4% (54,876)
Hungary
Ramapo:
1.5% (377)
New York:
0.4% (17,401)
Place of birth for U.S.-born residents:
This state: 69,385
Other state: 12,798
Northeast: 7,447
Midwest: 1,310
South: 3,168
West: 873
66% of Ramapo residents lived in the same house 5 years ago. Out of people who lived in different houses, 62% lived in this county. Out of people who lived in different counties, 65% lived in New York.
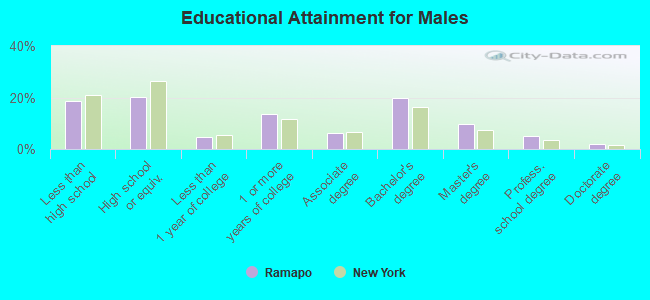
Education attainment for males 25 years and older:
No schooling: 804
Nursery to 4th grade: 237
5th and 6th grade: 524
7th and 8th grade: 751
9th grade: 380
10th grade: 460
11th grade: 544
12th grade, no diploma: 1,833
High school graduate (or equivalency): 5,977
Less than 1 year of college: 1,367
Some college more than 1 year, no degree: 4,041
Associate degree: 1,883
Bachelor's degree: 5,913
Master's degree: 2,842
Professional school degree: 1,487
Doctorate degree: 575
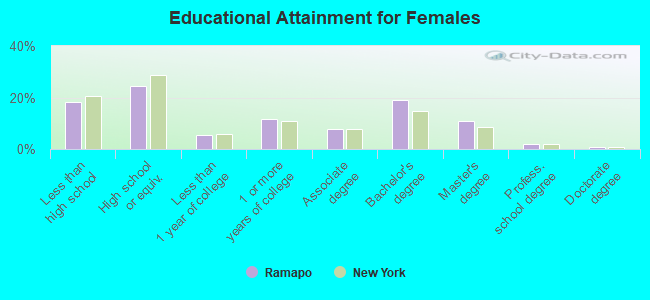
Education attainment for females 25 years and older:
No schooling: 716
Nursery to 4th grade: 212
5th and 6th grade: 537
7th and 8th grade: 915
9th grade: 495
10th grade: 703
11th grade: 727
12th grade, no diploma: 1,744
High school graduate (or equivalency): 8,060
Less than 1 year of college: 1,813
Some college more than 1 year, no degree: 3,805
Associate degree: 2,548
Bachelor's degree: 6,321
Master's degree: 3,584
Professional school degree: 664
Doctorate degree: 297
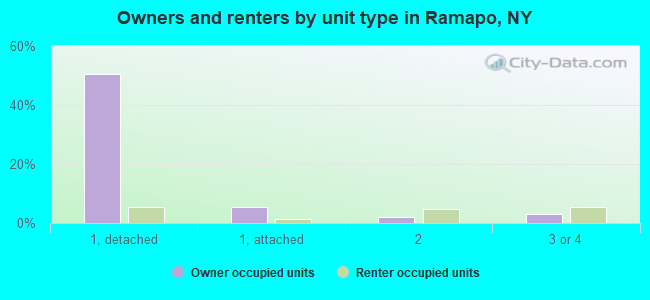
Housing units in structures:
One, detached: 18,041
One, attached: 2,237
Two: 2,198
3 or 4: 2,845
5 to 9: 2,003
10 to 19: 1,281
20 to 49: 1,265
50 or more: 2,523
Mobile homes: 29
Median worth of mobile homes: $119,637
Housing units lacking complete plumbing facilities: 0.6%
Housing units lacking complete kitchen facilities: 0.7%