Redmond, WA (Washington) Houses and Residents
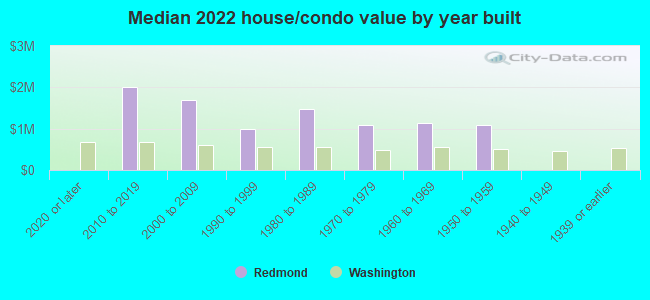
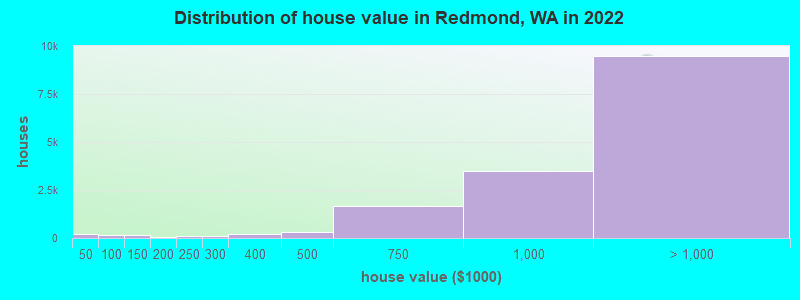
Estimated median house or condo value in 2022: $1,356,700 (it was $255,200 in 2000 )
Redmond:
$1,356,700Washington:
$569,500
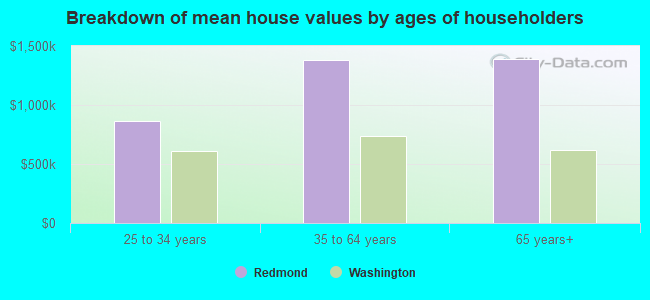
Lower value quartile - upper value quartile: $773,900 - $1,781,000Mean price in 2022: Detached houses: $1,370,338 Here:
$1,370,338State:
$734,307
Townhouses or other attached units: $851,397 Here:
$851,397State:
$657,697
In 3-to-4-unit structures: $521,595 Here:
$521,595State:
$510,239
In 5-or-more-unit structures: $453,129 Here:
$453,129State:
$503,183
Mobile homes: $175,142 Here:
$175,142State:
$218,362
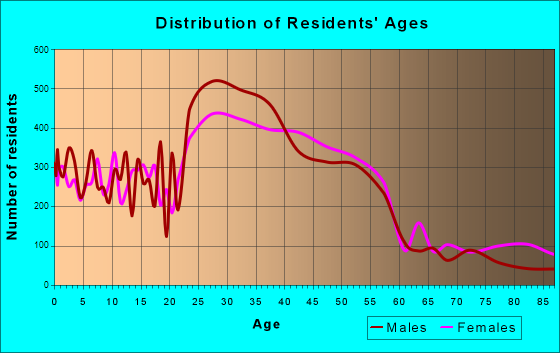
Total population: 59,285 (Urban population: 45,335, Rural population: 54 (all nonfarm) )
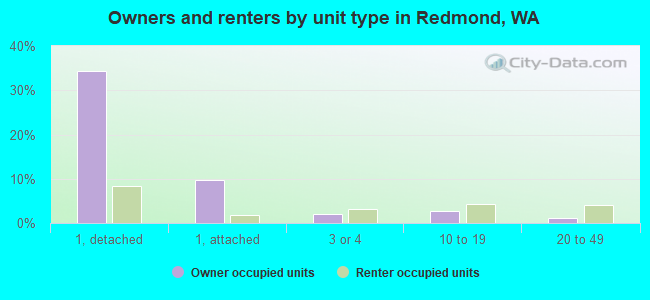
Houses: 34,350 (32,950 occupied: 14,157 owner occupied, 18,793 renter occupied )
% of renters here:
57%State:
36%
Housing density: 2,162 houses/condos per square mile
Median price asked for vacant for-sale houses and condos in 2022: $670,333.
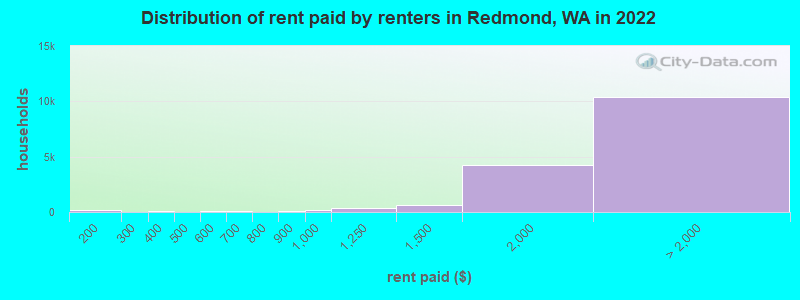
Median contract rent in 2022: over $2,000 (lower quartile is $1,756, upper quartile is over $2,000)
Median rent asked for vacant for-rent units in 2022: $2,472
Median gross rent in Redmond, WA in 2022: over $2,000
Housing units in Redmond with a mortgage: 9,487 (1,327 second mortgage, 0 home equity loan, 972 both second mortgage and home equity loan )Houses without a mortgage: 176
Median household income for houses/condos with a mortgage: $245,185
Median household income for apartments without a mortgage: $182,658
Median monthly housing costs: $2,306
Data:
Median house or condo value ($)
Median house or condo value ($ change since 2000)
Median house or condo value ($) - White
Median house or condo value ($) - Black or African American
Median house or condo value ($) - Asian
Median house or condo value ($) - Hispanic or Latino
Median house or condo value ($) - American Indian and Alaska Native
Median house or condo value ($) - Multirace
Median house or condo value ($) - Other Race
Median price asked for mobile homes ($)
Household density (households per square mile)
Mean house or condo value by units in structure - 1, detached ($)
Mean house or condo value by units in structure - 1, attached ($)
Mean house or condo value by units in structure - 2 ($)
Mean house or condo value by units in structure by units in structure - 3 or 4 ($)
Mean house or condo value by units in structure - 5 or more ($)
Mean house or condo value by units in structure - Boat, RV, van, etc. ($)
Mean house or condo value by units in structure - Mobile home ($)
Median contract rent ($)
Median contract rent - Lower quartile ($)
Median contract rent - Upper quartile ($)
Median gross rent ($)
Urban houses (%)
Rural houses (%)
Houses occupied (%)
Houses occupied (% change since 2000)
Houses owner occupied (%)
Houses owner occupied (% change since 2000)
Houses renter occupied (%)
Houses renter occupied (% change since 2000)
Vacant housing units - For rent (%)
Vacant housing units - For rent (% change since 2000)
Vacant housing units - For sale only (%)
Vacant housing units - For sale only (% change since 2000)
Vacant housing units - Rented or sold, not occupied (%)
Vacant housing units - Rented or sold, not occupied (% change since 2000)
Vacant housing units - For seasonal, recreational, or occasional use (%)
Vacant housing units - For seasonal, recreational, or occasional use (% change since 2000)
Vacant housing units - For migrant workers (%)
Vacant housing units - For migrant workers (% change since 2000)
Vacant housing units - Other vacant (%)
Vacant housing units - Other vacant (% change since 2000)
Median monthly housing costs ($)
Median household income for houses/condos with a mortgage ($)
Median household income for houses/condos without a mortgage ($)
Median household income ($)
Median household income ($) - White
Median household income ($) - Black or African American
Median household income ($) - Asian
Median household income ($) - Hispanic or Latino
Median household income ($) - American Indian and Alaska Native
Median household income ($) - Multirace
Median household income ($) - Other Race
Mortgage status - with mortgage (%)
Mortgage status - with second mortgage (%)
Mortgage status - with home equity loan (%)
Mortgage status - with both second mortgage and home equity loan (%)
Mortgage status - without a mortgage (%)
Median year house/condo built
Median year apartment built
Household type by relationship - Male householder living alone (%)
Household type by relationship - Male householder not living alone (%)
Household type by relationship - Female householder living alone (%)
Household type by relationship - Female householder not living alone (%)
Household type by relationship - Opposite-Sex spouse (%)
Household type by relationship - Same-Sex spouse (%)
Household type by relationship - Opposite-Sex unmarried partner (%)
Household type by relationship - Same-Sex unmarried partner (%)
Household type by relationship - In group quarters (%)
Size of family households - 2-person household (%)
Size of family households - 3-person household (%)
Size of family households - 4-person household (%)
Size of family households - 5-person household (%)
Size of family households - 6-person household (%)
Size of family households - 7-or-more-person household (%)
Size of nonfamily households - 1-person household (%)
Size of nonfamily households - 2-person household (%)
Size of nonfamily households - 3-person household (%)
Size of nonfamily households - 4-person household (%)
Size of nonfamily households - 5-person household (%)
Size of nonfamily households - 6-person household (%)
Size of nonfamily households - 7-or-moreperson household (%)
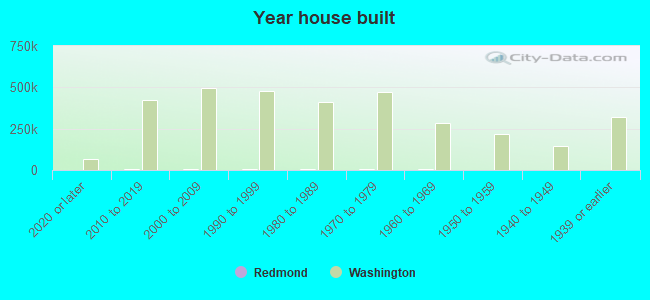
Year house built - Built 2010 or later (%)
Year house built - Built 2000 to 2009 (%)
Year house built - Built 1990 to 1999 (%)
Year house built - Built 1980 to 1989 (%)
Year house built - Built 1970 to 1979 (%)
Year house built - Built 1960 to 1969 (%)
Year house built - Built 1950 to 1959 (%)
Year house built - Built 1940 to 1949 (%)
Year house built - Built 1939 or earlier (%)
Median number of rooms in houses and condos
Median number of rooms in apartments
Median number of bedrooms in owner occupied houses
Mean number of bedrooms in owner occupied houses
Median number of bedrooms in renter occupied houses
Mean number of bedrooms in renter occupied houses
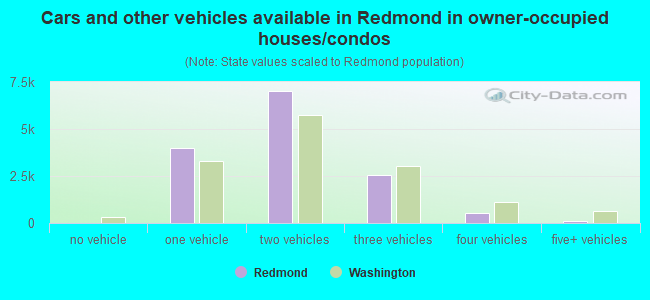
Median number of vehichles in owner occupied houses
Mean number of vehichles in owner occupied houses
Median number of vehichles in renter occupied houses
Mean number of vehichles in renter occupied houses
Rooms in owner-occupied houses - 1 room (%)
Rooms in owner-occupied houses - 2 rooms (%)
Rooms in owner-occupied houses - 3 rooms (%)
Rooms in owner-occupied houses - 4 rooms (%)
Rooms in owner-occupied houses - 5 rooms (%)
Rooms in owner-occupied houses - 6 rooms (%)
Rooms in owner-occupied houses - 7 rooms (%)
Rooms in owner-occupied houses - 8 rooms (%)
Rooms in owner-occupied houses - 9+ rooms (%)
Rooms in renter-occupied houses - 1 room (%)
Rooms in renter-occupied houses - 2 rooms (%)
Rooms in renter-occupied houses - 3 rooms (%)
Rooms in renter-occupied houses - 4 rooms (%)
Rooms in renter-occupied houses - 5 rooms (%)
Rooms in renter-occupied houses - 6 rooms (%)
Rooms in renter-occupied houses - 7 rooms (%)
Rooms in renter-occupied houses - 8 rooms (%)
Rooms in renter-occupied houses - 9+ rooms (%)
Bedrooms in owner-occupied houses - no bedrooms (%)
Bedrooms in owner-occupied houses - 1 bedroom (%)
Bedrooms in owner-occupied houses - 2 bedrooms (%)
Bedrooms in owner-occupied houses - 3 bedrooms (%)
Bedrooms in owner-occupied houses - 4 bedrooms (%)
Bedrooms in owner-occupied houses - 5+ bedrooms (%)
Bedrooms in renter-occupied houses - no bedrooms (%)
Bedrooms in renter-occupied houses - 1 bedroom (%)
Bedrooms in renter-occupied houses - 2 bedrooms (%)
Bedrooms in renter-occupied houses - 3 bedrooms (%)
Bedrooms in renter-occupied houses - 4 bedrooms (%)
Bedrooms in renter-occupied houses - 5+ bedrooms (%)
Vehicles available in owner-occupied houses - no vehicle available (%)
Vehicles available in owner-occupied houses - 1 vehicle available(%)
Vehicles available in owner-occupied houses - 2 Vehicles available (%)
Vehicles available in owner-occupied houses - 3 Vehicles available (%)
Vehicles available in owner-occupied houses - 4 Vehicles available (%)
Vehicles available in owner-occupied houses - 5+ Vehicles available (%)
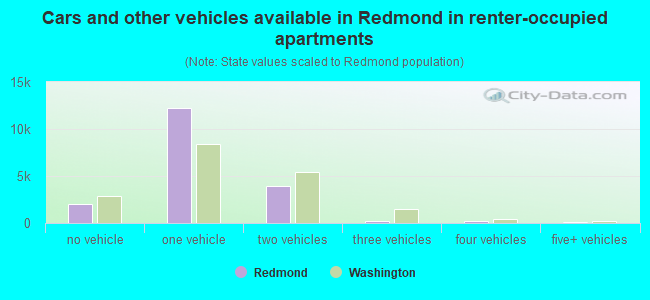
Vehicles available in renter-occupied houses - no vehicle available (%)
Vehicles available in renter-occupied houses - 1 vehicle available (%)
Vehicles available in renter-occupied houses - 2 Vehicles available (%)
Vehicles available in renter-occupied houses - 3 Vehicles available (%)
Vehicles available in renter-occupied houses - 4 Vehicles available (%)
Vehicles available in renter-occupied houses - 5+ Vehicles available (%)
Housing units in structures - 1, detached (%)
Housing units in structures - 1, attached (%)
Housing units in structures - 2 (%)
Housing units in structures - 3 or 4 (%)
Housing units in structures - 5 to 9 (%)
Housing units in structures - 10 to 19 (%)
Housing units in structures - 20 to 49 (%)
Housing units in structures - 50 or more (%)
Housing units in structures - Mobile home (%)
Housing units in structures - Boat, RV, van, etc. (%)
Housing units in structures - Owners - 1, detached (%)
Housing units in structures - Owners - 1, attached (%)
Housing units in structures - Owners - 2 (%)
Housing units in structures - Owners - 3 or 4 (%)
Housing units in structures - Owners - 5 to 9 (%)
Housing units in structures - Owners - 10 to 19 (%)
Housing units in structures - Owners - 20 to 49 (%)
Housing units in structures - Owners - 50 or more (%)
Housing units in structures - Owners - Mobile home (%)
Housing units in structures - Owners - Boat, RV, van, etc. (%)
Housing units in structures - Renters - 1, detached (%)
Housing units in structures - Renters - 1, attached (%)
Housing units in structures - Renters - 2 (%)
Housing units in structures - Renters - 3 or 4 (%)
Housing units in structures - Renters - 5 to 9 (%)
Housing units in structures - Renters - 10 to 19 (%)
Housing units in structures - Renters - 20 to 49 (%)
Housing units in structures - Renters - 50 or more (%)
Housing units in structures - Renters - Mobile home (%)
Housing units in structures - Renters - Boat, RV, van, etc. (%)
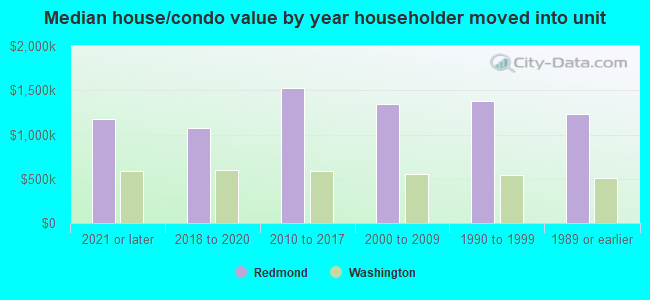
House/condo owner moved in on average (years ago)
Renter moved in on average (years ago)
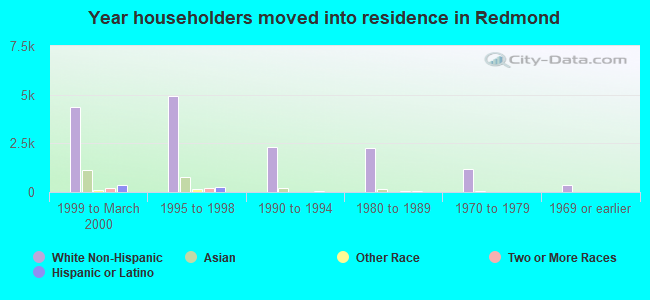
Year householder moved into unit - Moved in 1999 to March 2000 (%)
Year householder moved into unit - Moved in 1999 to March 2000 (%) - White
Year householder moved into unit - Moved in 1999 to March 2000 (%) - Black or African American
Year householder moved into unit - Moved in 1999 to March 2000 (%) - Asian
Year householder moved into unit - Moved in 1999 to March 2000 (%) - Hispanic or Latino
Year householder moved into unit - Moved in 1999 to March 2000 (%) - American Indian and Alaska Native
Year householder moved into unit - Moved in 1999 to March 2000 (%) - Multirace
Year householder moved into unit - Moved in 1999 to March 2000 (%) - Other Race
Year householder moved into unit - Moved in 1995 to 1998 (%)
Year householder moved into unit - Moved in 1995 to 1998 (%) - White
Year householder moved into unit - Moved in 1995 to 1998 (%) - Black or African American
Year householder moved into unit - Moved in 1995 to 1998 (%) - Asian
Year householder moved into unit - Moved in 1995 to 1998 (%) - Hispanic or Latino
Year householder moved into unit - Moved in 1995 to 1998 (%) - American Indian and Alaska Native
Year householder moved into unit - Moved in 1995 to 1998 (%) - Multirace
Year householder moved into unit - Moved in 1995 to 1998 (%) - Other Race
Year householder moved into unit - Moved in 1990 to 1994 (%)
Year householder moved into unit - Moved in 1990 to 1994 (%) - White
Year householder moved into unit - Moved in 1990 to 1994 (%) - Black or African American
Year householder moved into unit - Moved in 1990 to 1994 (%) - Asian
Year householder moved into unit - Moved in 1990 to 1994 (%) - Hispanic or Latino
Year householder moved into unit - Moved in 1990 to 1994 (%) - American Indian and Alaska Native
Year householder moved into unit - Moved in 1990 to 1994 (%) - Multirace
Year householder moved into unit - Moved in 1990 to 1994 (%) - Other Race
Year householder moved into unit - Moved in 1980 to 1989 (%)
Year householder moved into unit - Moved in 1980 to 1989 (%) - White
Year householder moved into unit - Moved in 1980 to 1989 (%) - Black or African American
Year householder moved into unit - Moved in 1980 to 1989 (%) - Asian
Year householder moved into unit - Moved in 1980 to 1989 (%) - Hispanic or Latino
Year householder moved into unit - Moved in 1980 to 1989 (%) - American Indian and Alaska Native
Year householder moved into unit - Moved in 1980 to 1989 (%) - Multirace
Year householder moved into unit - Moved in 1980 to 1989 (%) - Other Race
Year householder moved into unit - Moved in 1970 to 1979 (%)
Year householder moved into unit - Moved in 1970 to 1979 (%) - White
Year householder moved into unit - Moved in 1970 to 1979 (%) - Black or African American
Year householder moved into unit - Moved in 1970 to 1979 (%) - Asian
Year householder moved into unit - Moved in 1970 to 1979 (%) - Hispanic or Latino
Year householder moved into unit - Moved in 1970 to 1979 (%) - American Indian and Alaska Native
Year householder moved into unit - Moved in 1970 to 1979 (%) - Multirace
Year householder moved into unit - Moved in 1970 to 1979 (%) - Other Race
Year householder moved into unit - Moved in 1969 or earlier (%)
Year householder moved into unit - Moved in 1969 or earlier (%) - White
Year householder moved into unit - Moved in 1969 or earlier (%) - Black or African American
Year householder moved into unit - Moved in 1969 or earlier (%) - Asian
Year householder moved into unit - Moved in 1969 or earlier (%) - Hispanic or Latino
Year householder moved into unit - Moved in 1969 or earlier (%) - American Indian and Alaska Native
Year householder moved into unit - Moved in 1969 or earlier (%) - Multirace
Year householder moved into unit - Moved in 1969 or earlier (%) - Other Race
Housing units lacking complete plumbing facilities (%)
Housing units lacking complete kitchen facilities (%)
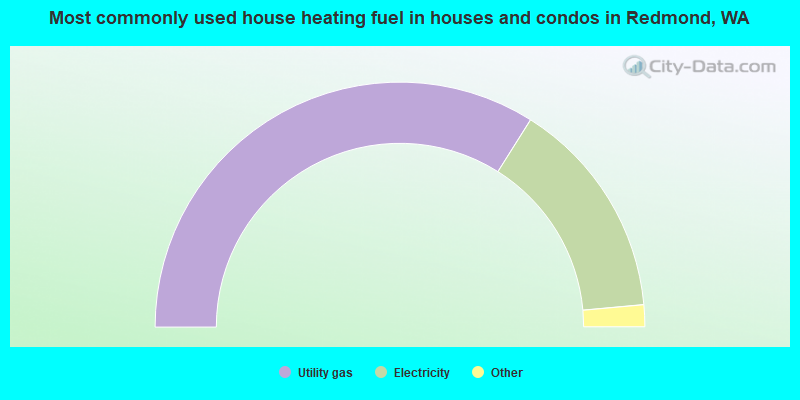
House heating fuel used in houses and condos - Utility gas (%)
House heating fuel used in houses and condos - Bottled, tank, or LP gas (%)
House heating fuel used in houses and condos - Electricity (%)
House heating fuel used in houses and condos - Fuel oil, kerosene, etc. (%)
House heating fuel used in houses and condos - Coal or coke (%)
House heating fuel used in houses and condos - Wood (%)
House heating fuel used in houses and condos - Solar energy (%)
House heating fuel used in houses and condos - Other fuel (%)
House heating fuel used in houses and condos - No fuel used (%)
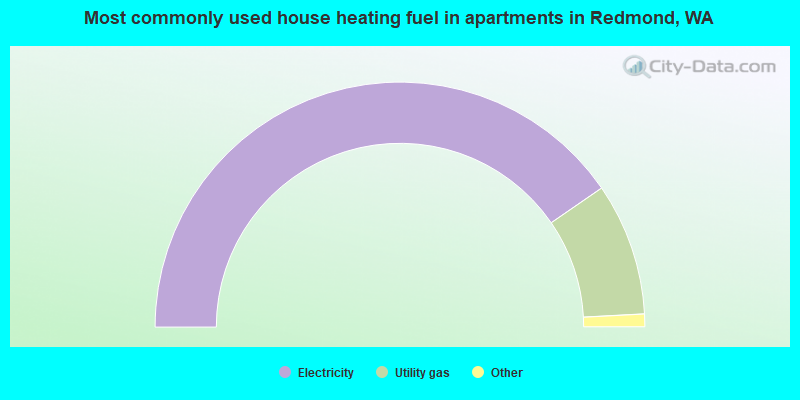
House heating fuel used in apartments - Utility gas (%)
House heating fuel used in apartments - Bottled, tank, or LP gas (%)
House heating fuel used in apartments - Electricity (%)
House heating fuel used in apartments - Fuel oil, kerosene, etc. (%)
House heating fuel used in apartments - Coal or coke (%)
House heating fuel used in apartments - Wood (%)
House heating fuel used in apartments - Solar energy (%)
House heating fuel used in apartments - Other fuel (%)
House heating fuel used in apartments - No fuel used (%)
Latest news about housing in Redmond, WA collected exclusively by city-data.com from local newspapers, TV, and radio stations
Median year house/condo built: 1983Median year apartment built: 2002Household type by relationship:
Households: 76,739
Male householders: 19,283 (5,110 living alone ), Female householders: 13,667 (5,113 living alone )14,760 spouses (14,593 opposite-sex spouses ), 3,269 unmarried partners , (3,180 opposite-sex unmarried partners ), 19,165 children (19,086 natural , 0 adopted , 79 stepchildren ), 326 grandchildren , 383 brothers or sisters , 1,384 parents , 0 foster children , 172 other relatives , 3,872 non-relatives In group quarters: 458
Size of family households: 6,245 2-persons , 5,866 3-persons , 4,650 4-persons , 640 5-persons , 263 6-persons , 173 7-or-more-persons .
Size of nonfamily households: 10,223 1-person , 4,081 2-persons , 599 3-persons , 210 4-persons .
13,620 married couples with children. single-parent households (353 men , 2,003 women ).
51.2% of residents of Redmond speak English at home. of residents speak Spanish at home (74% speak English very well , 14% speak English well , 10% speak English not well , 2% don't speak English at all ).of residents speak other Indo-European language at home (82% speak English very well , 12% speak English well , 5% speak English not well ).of residents speak Asian or Pacific Island language at home (69% speak English very well , 23% speak English well , 6% speak English not well , 2% don't speak English at all ).of residents speak other language at home (82% speak English very well , 15% speak English well , 2% speak English not well , 1% don't speak English at all ).
Foreign born population: 34,566 (45.0%)of them are naturalized citizens )
Median number of rooms in houses and condos:
Median number of rooms in apartments
Owner-occupied Renter-occupied
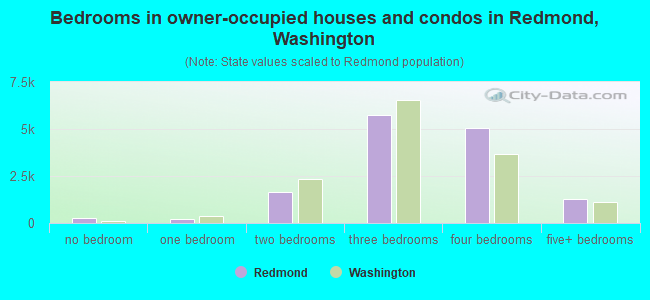
Bedrooms in owner-occupied houses and condos in Redmond, Washington
269 no bedroom 188 1 bedroom 1,660 2 bedrooms 5,722 3 bedrooms 5,066 4 bedrooms 1,252 5+ bedrooms
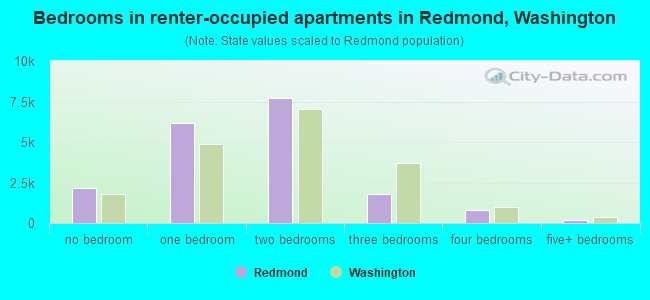
Bedrooms in renter-occupied apartments in Redmond, Washington
2,171 no bedroom 6,167 1 bedroom 7,693 2 bedrooms 1,798 3 bedrooms 782 4 bedrooms 182 5+ bedrooms
Owner-occupied Renter-occupied
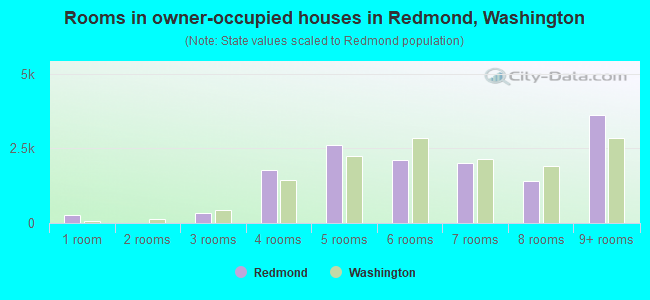
Rooms in owner-occupied houses in Redmond, Washington
269 1 room 0 2 rooms 332 3 rooms 1,765 4 rooms 2,616 5 rooms 2,105 6 rooms 2,028 7 rooms 1,418 8 rooms 3,624 9+ rooms
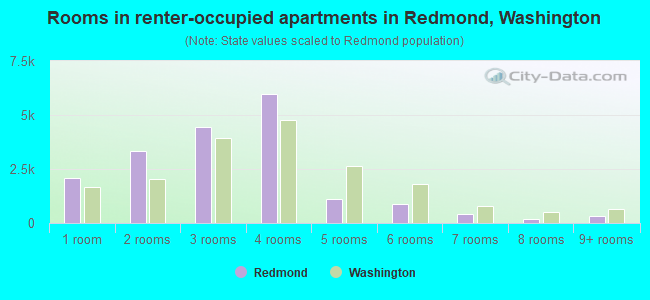
Rooms in renter-occupied apartments in Redmond, Washington
2,092 1 room 3,346 2 rooms 4,424 3 rooms 5,975 4 rooms 1,126 5 rooms 899 6 rooms 437 7 rooms 188 8 rooms 306 9+ rooms
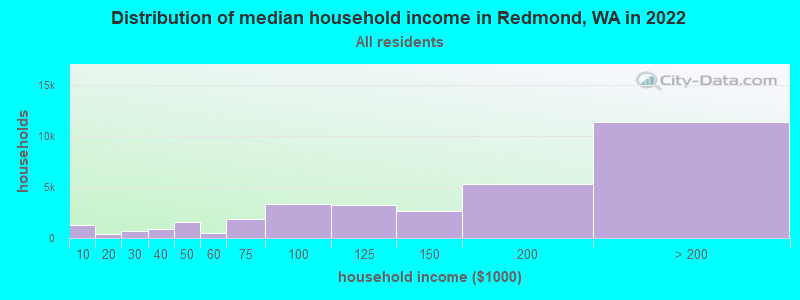
Redmond, WA household income distribution 1,279 Less than $10,000402 $10,000 to $19,999639 $20,000 to $29,999912 $30,000 to $39,9991,528 $40,000 to $49,999487 $50,000 to $59,9991,826 $60,000 to $74,9993,331 $75,000 to $99,9993,276 $100,000 to $124,9992,672 $125,000 to $149,9995,239 $150,000 to $199,99911,359 $200,000 or more
Home value of owner - occupied houses in 2022 in Redmond, WA 165 Less than $10,00022 $40,000 to $49,99914 $50,000 to $59,99931 $60,000 to $69,99943 $70,000 to $79,99966 $90,000 to $99,999173 $100,000 to $124,9999 $150,000 to $174,99924 $175,000 to $199,99985 $200,000 to $249,99987 $250,000 to $299,999185 $300,000 to $399,999337 $400,000 to $499,9991,646 $500,000 to $749,9993,498 $750,000 to $999,9995,295 $1,000,000 to $1,499,9992,601 $1,500,000 to $1,999,9991,597 $2,000,000 or moreRent paid by renters in 2022 in Redmond, WA 52 Less than $10063 $100 to $149109 $150 to $19940 $200 to $24933 $300 to $34938 $350 to $39940 $500 to $54918 $550 to $59957 $600 to $64914 $700 to $74923 $750 to $79988 $800 to $899170 $900 to $999388 $1,000 to $1,249657 $1,250 to $1,4994,221 $1,500 to $1,9995,160 $2,000 to $2,4992,142 $2,500 to $2,9991,701 $3,000 to $3,4991,057 $3,500 or more342 No cash rent
Percentage of workers working in this county: 96.5%Number of people working at home: 17,048 (43.0% of all workers )
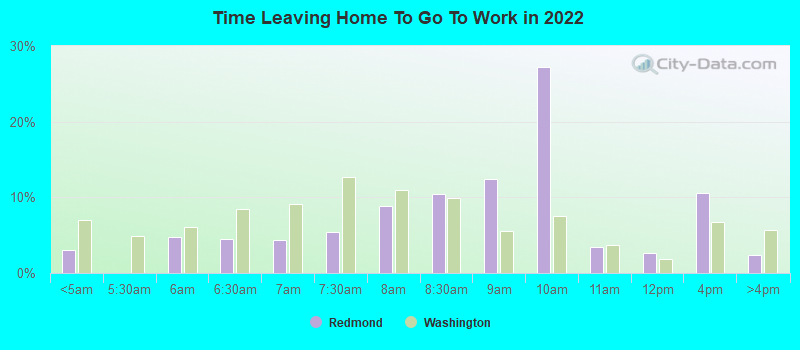
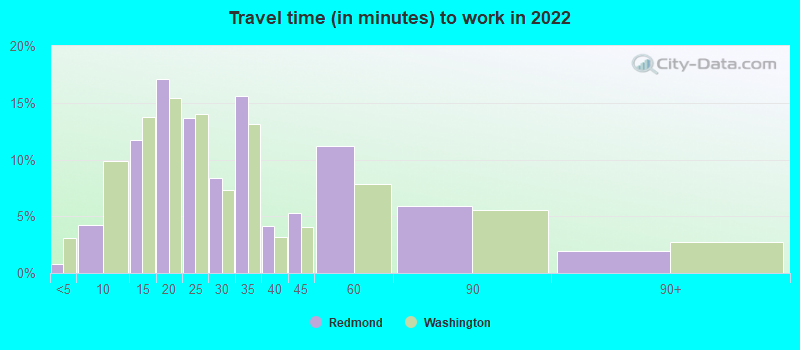
Travel time to work (commute)
Less than 5 minutes: 4075 to 9 minutes: 2,13110 to 14 minutes: 6,01815 to 19 minutes: 7,89420 to 24 minutes: 3,00225 to 29 minutes: 2,17330 to 34 minutes: 1,42335 to 39 minutes: 88340 to 44 minutes: 75445 to 59 minutes: 1,10260 to 89 minutes: 79990 or more minutes: 0
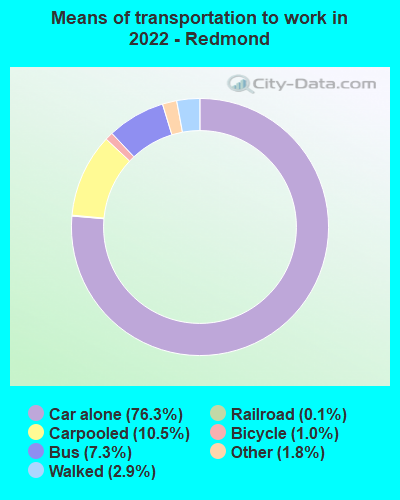
Means of transportation to work:
Drove a car alone: 53,070 (62.5%)Carpooled: 6,988 (8.2%)Bus : 3,140 (3.7%)Subway or elevated rail : 21 (0.0%)Long-distance train or commuter rail : 22 (0.0%)Light rail, streetcar or trolley : 95 (0.1%)Ferryboat: 49 (0.1%)Taxi: 1,125 (1.3%)Bicycle: 631 (0.7%)Walked: 1,800 (2.1%)Worked at home: 17,048 (20.1%)
Unemployment by race in 2022
Unemployment rate for White non-Hispanic residents 6.5% Males7.2% FemalesUnemployment rate for Black residents 2.4% Males12.8% FemalesUnemployment rate for Asian residents 2.3% Males4.9% FemalesUnemployment rate for two or more race residents 6.6% Males5.9% FemalesUnemployment rate for Hispanic or Latino residents 0.7% Males4.6% Females
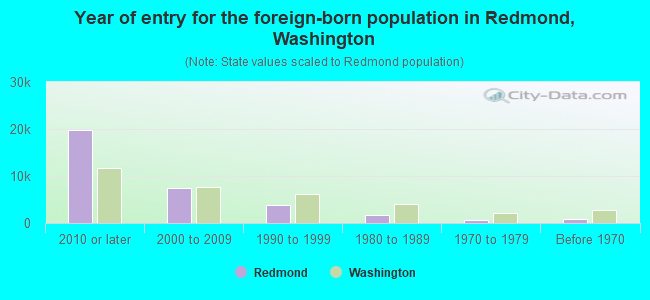
Year of entry for the foreign-born population in Redmond, Washington
19,725 2010 or later 7,400 2000 to 2009 3,806 1990 to 1999 1,700 1980 to 1989 743 1970 to 1979 935 Before 1970
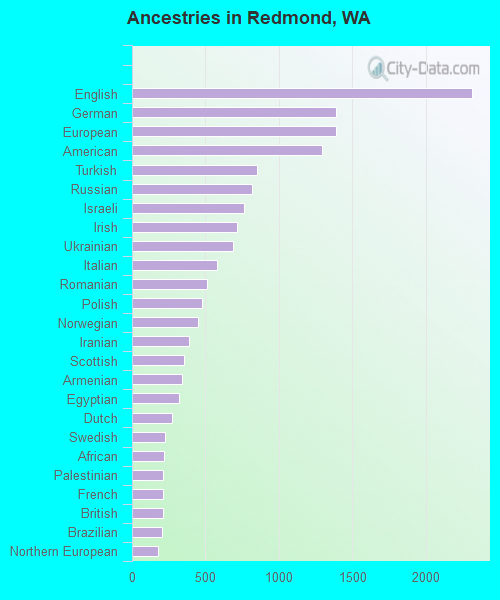
First ancestries reported:
English: 2,314 (4.9%)
German: 1,391 (2.9%)
European: 1,388 (2.9%)
American: 1,292 (2.7%)
Turkish: 851 (1.8%)
Russian: 816 (1.7%)
Israeli: 762 (1.6%)
Irish: 715 (1.5%)
Ukrainian: 690 (1.4%)
Italian: 580 (1.2%)
Romanian: 511 (1.1%)
Polish: 474 (1.0%)
Norwegian: 446 (0.9%)
Iranian: 390 (0.8%)
Scottish: 351 (0.7%)
Armenian: 343 (0.7%)
Egyptian: 317 (0.7%)
Dutch: 269 (0.6%)
Swedish: 224 (0.5%)
African: 215 (0.5%)
Palestinian: 210 (0.4%)
French: 209 (0.4%)
British: 208 (0.4%)
Brazilian: 202 (0.4%)
Northern European: 178 (0.4%)
Iraqi: 172 (0.4%)
Eastern European: 157 (0.3%)
Belgian: 151 (0.3%)
Czech: 136 (0.3%)
Ethiopian: 133 (0.3%)
Scotch-Irish: 130 (0.3%)
Syrian: 123 (0.3%)
Canadian: 91 (0.2%)
Scandinavian: 84 (0.2%)
Slovak: 68 (0.1%)
Bulgarian: 67 (0.1%)
Welsh: 63 (0.1%)
Kenyan: 61 (0.1%)
Sudanese: 61 (0.1%)
Lebanese: 44 (0.09%)
French Canadian: 39 (0.08%)
Austrian: 32 (0.07%)
Nigerian: 31 (0.07%)
Greek: 29 (0.06%)
Swiss: 28 (0.06%)
Slavic: 23 (0.05%)
Slovene: 23 (0.05%)
Hungarian: 19 (0.04%)
Moroccan: 18 (0.04%)
Estonian: 17 (0.04%)
Portuguese: 17 (0.04%)
Australian: 17 (0.04%)
Latvian: 15 (0.03%)
South African: 15 (0.03%)
Finnish: 13 (0.03%)
New Zealander: 12 (0.03%)
Czechoslovakian: 5 (0.01%)
Lithuanian: 5 (0.01%)
Most common places of birth for foreign-born residents (%): India Redmond:
39.9% (13,226)Washington:
8.9% (101,353)
China, excluding Hong Kong and Taiwan Redmond:
16.4% (5,447)Washington:
7.4% (84,470)
Canada Redmond:
3.3% (1,106)Washington:
4.1% (47,238)
Mexico Redmond:
3.2% (1,061)Washington:
21.1% (241,655)
Taiwan Redmond:
3.0% (1,007)Washington:
1.5% (16,607)
Russia Redmond:
2.7% (895)Washington:
1.9% (21,540)
Korea Redmond:
2.3% (764)Washington:
4.3% (48,886)
Ukraine Redmond:
1.8% (583)Washington:
3.1% (35,872)
Israel Redmond:
1.7% (547)Washington:
0.2% (2,506)
Japan Redmond:
1.5% (498)Washington:
1.5% (17,453)
Place of birth for U.S.-born residents:
This state: 19,318Other state: 21,510Northeast: 2,642Midwest: 5,571South: 3,467West: 9,830 78.7% of Redmond residents lived in the same house 1 years ago.
Out of people who lived in different houses, 37.5% lived in this county.
Out of people who lived in different counties, 10.3% lived in Washington.
Redmond:
78.7%State average:
85.2%
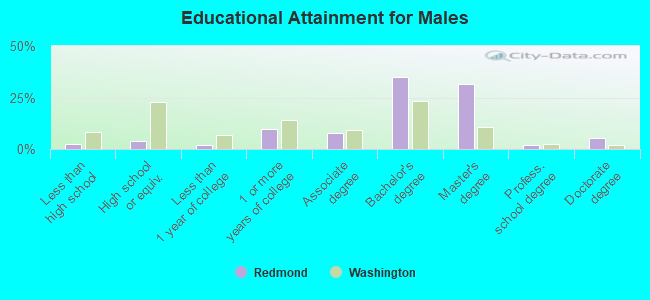
Education attainment for males 25 years and older:
No schooling: 149Nursery to 4th grade: 05th and 6th grade: 07th and 8th grade: 149th grade: 010th grade: 9511th grade: 012th grade, no diploma: 415High school graduate (or equivalency): 1,184Less than 1 year of college: 604Some college more than 1 year, no degree: 2,802Associate degree: 2,199Bachelor's degree: 10,056Master's degree: 9,065Professional school degree: 555Doctorate degree: 1,601
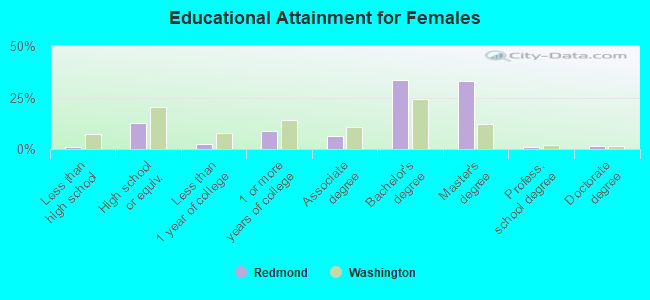
Education attainment for females 25 years and older:
No schooling: 0Nursery to 4th grade: 2385th and 6th grade: 07th and 8th grade: 729th grade: 010th grade: 011th grade: 012th grade, no diploma: 0High school graduate (or equivalency): 3,381Less than 1 year of college: 665Some college more than 1 year, no degree: 2,374Associate degree: 1,628Bachelor's degree: 8,797Master's degree: 8,676Professional school degree: 266Doctorate degree: 337
Housing units in structures:
One, detached: 12,554One, attached: 2,251Two: 7543 or 4: 2,6775 to 9: 2,97110 to 19: 1,51020 to 49: 2,67950 or more: 8,298Mobile homes: 656Median worth of mobile homes: $95,200
Housing units lacking complete plumbing facilities in 2022: 0.3%Housing units lacking complete kitchen facilities in 2022: 1.2%House/condo owner moved in on average 9 years ago
Renter moved in on average 0 years ago
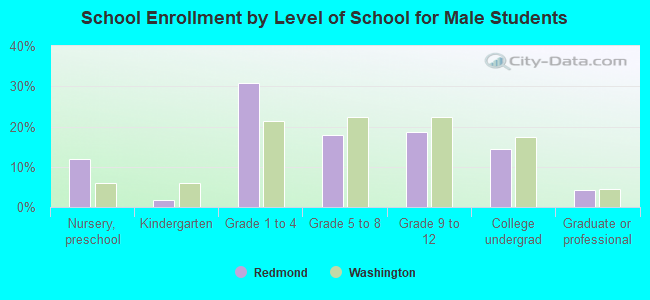
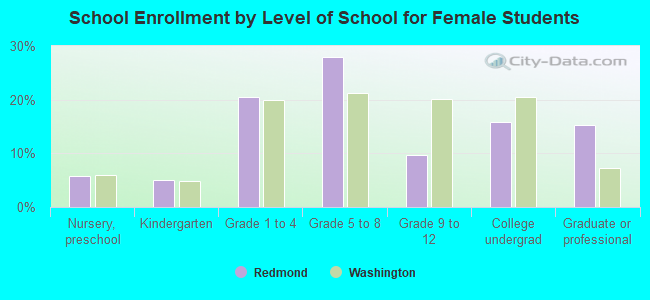
Private vs. public school enrollment:
Students in private schools in grades 1 to 8 (elementary and middle school): 647 Here:
7.5%Washington:
12.4%
Students in private schools in grades 9 to 12 (high school): 90 Students in private undergraduate colleges: 425 Here:
15.7%Washington:
16.5%