Renton, WA (Washington) Houses and Residents
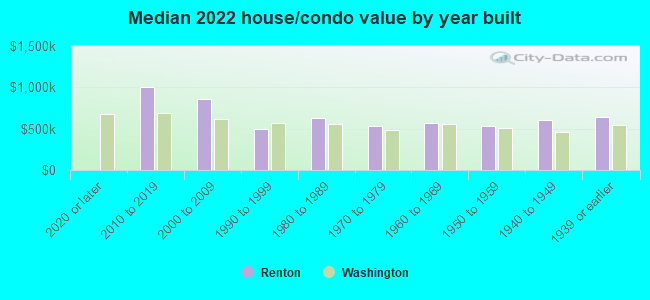
| Renton: | $646,000 |
| Washington: | $569,500 |
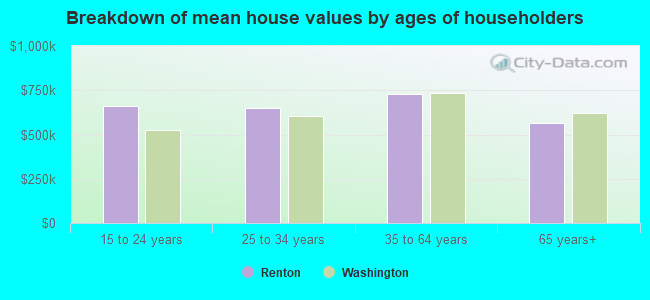
Mean price in 2022:
Detached houses: $753,729
Here: $753,729 State: $734,307 Townhouses or other attached units: $611,269
Here: $611,269 State: $657,697 In 2-unit structures: $536,211
Here: $536,211 State: $534,634 In 3-to-4-unit structures: $339,996
Here: $339,996 State: $510,239 In 5-or-more-unit structures: $305,238
Here: $305,238 State: $503,183 Mobile homes: $235,501
Here: $235,501 State: $218,362
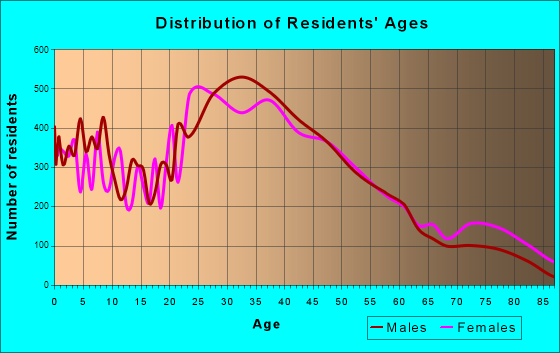
Total population: 98,404 (Urban population: 49,868, Rural population: 26 (all nonfarm))
Houses: 43,673 (42,485 occupied: 24,463 owner occupied, 18,022 renter occupied)
| % of renters here: | 42% |
| State: | 36% |
Housing density: 2,565 houses/condos per square mile
Median price asked for vacant for-sale houses and condos in 2022: $564,306.
Median contract rent in 2022: $1,766 (lower quartile is $1,350, upper quartile is over $2,000)
Median rent asked for vacant for-rent units in 2022: $1,598
Median gross rent in Renton, WA in 2022: $1,880
Housing units in Renton with a mortgage: 16,614 (1,287 second mortgage, 55 home equity loan, 1,024 both second mortgage and home equity loan)
Houses without a mortgage: 488
Median household income for houses/condos with a mortgage: $129,649
Median household income for apartments without a mortgage: $81,278
Median monthly housing costs: $1,829
Compare current foreclosures in Renton, WA:
| Photo | Address | Area | Beds / Baths | Price | Details |
|---|---|---|---|---|---|

|
#1
SE 170th St
Renton, WA 98058
|
960 sq. feet
|
1 baths 3 beds |
show details | |

|
#2
NE 5th St
Renton, WA 98056
|
1,930 sq. feet
|
2 baths 3 beds |
show details | |

|
#3
126th Pl SE
Renton, WA 98056
|
2,450 sq. feet
|
2 baths 4 beds |
show details | |

|
#4
S 36th Pl
Renton, WA 98055
|
- sq. feet
|
2 baths 4 beds |
show details | |

|
#5
S 18th St
Renton, WA 98055
|
2,680 sq. feet
|
1 baths 4 beds |
show details | |

|
#6
205th Ave SE
Renton, WA 98059
|
2,130 sq. feet
|
2 baths 3 beds |
show details | |

|
#7
113th Ave SE
Renton, WA 98055
|
1,960 sq. feet
|
2 baths 3 beds |
show details | |

|
#8
Lyons Ave NE
Renton, WA 98059
|
2,510 sq. feet
|
2 baths 3 beds |
show details | |

|
#9
SE Petrovitsky Rd
Renton, WA 98058
|
1,360 sq. feet
|
1 baths 3 beds |
show details | |

|
#10
Pelly Ave N
Renton, WA 98057
|
2,390 sq. feet
|
3 baths 4 beds |
show details |
| Photo | Address | Area | Beds / Baths | Price | Details |
|---|---|---|---|---|---|

|
#11
SE 198th St
Renton, WA 98058
|
1,900 sq. feet
|
1 baths 3 beds |
show details | |

|
#12
Redmond Ave NE
Renton, WA 98056
|
1,540 sq. feet
|
1 baths 3 beds |
show details | |

|
#13
SE 89th Pl
Renton, WA 98056
|
1,890 sq. feet
|
2 baths 4 beds |
show details | |

|
#14
SE Petrovitsky Rd
Renton, WA 98058
|
1,530 sq. feet
|
1 baths 3 beds |
show details | |

|
#15
125th Ave SE
Renton, WA 98058
|
1,250 sq. feet
|
1 baths 3 beds |
show details | |

|
#16
NE 13th Pl
Renton, WA 98056
|
3,340 sq. feet
|
2 baths 4 beds |
show details | |

|
#17
Union Ave NE
Renton, WA 98059
|
940 sq. feet
|
1 baths 3 beds |
show details | |

|
#18
SE Petrovitsky Rd
Renton, WA 98058
|
1,300 sq. feet
|
2 baths 4 beds |
show details | |

|
#19
SE 160th St
Renton, WA 98058
|
2,530 sq. feet
|
2 baths 4 beds |
show details | |

|
#20
S 30th Pl
Renton, WA 98055
|
1,800 sq. feet
|
3 baths 3 beds |
show details |
| Photo | Address | Area | Beds / Baths | Price | Details |
|---|---|---|---|---|---|

|
#21
Harrington Ave NE Apt 203
Renton, WA 98056
|
877 sq. feet
|
1 baths 1 beds |
show details | |

|
#22
NE 24th St
Renton, WA 98059
|
1,210 sq. feet
|
1 baths 3 beds |
show details | |

|
#23
184th Ave SE
Renton, WA 98058
|
1,660 sq. feet
|
2 baths 3 beds |
show details | |

|
#24
180th Ave SE
Renton, WA 98059
|
2,230 sq. feet
|
3 baths 5 beds |
show details | |

|
#25
Shelton Ave NE
Renton, WA 98056
|
2,040 sq. feet
|
2 baths 5 beds |
show details | |

|
#26
163rd Ave SE
Renton, WA 98059
|
2,120 sq. feet
|
1 baths 3 beds |
show details | |

|
#27
204th Ave SE
Renton, WA 98059
|
1,230 sq. feet
|
1 baths 3 beds |
show details | |

|
#28
Newport Ave SE
Renton, WA 98058
|
950 sq. feet
|
1 baths 2 beds |
show details | |

|
#29
Grant Ave S
Renton, WA 98057
|
880 sq. feet
|
1 baths 2 beds |
show details | |

|
#30
SE 3rd St
Renton, WA 98056
|
4,110 sq. feet
|
4 baths 5 beds |
show details |
| Photo | Address | Area | Beds / Baths | Price | Details |
|---|---|---|---|---|---|

|
#31
Jefferson Ave NE
Renton, WA 98056
|
1,750 sq. feet
|
1 baths 3 beds |
show details | |

|
#32
177th Pl SE
Renton, WA 98059
|
2,040 sq. feet
|
1 baths 4 beds |
show details | |

|
#33
115th Ct SE
Renton, WA 98056
|
2,970 sq. feet
|
2 baths 4 beds |
show details | |

|
#34
SE 168th St
Renton, WA 98058
|
1,490 sq. feet
|
1 baths 4 beds |
show details | |

|
#35
125th Ave SE
Renton, WA 98058
|
1,250 sq. feet
|
1 baths 3 beds |
show details | |

|
#36
Wells Ave N
Renton, WA 98057
|
1,050 sq. feet
|
1 baths 3 beds |
show details | |

|
#37
Lynnwood Ave SE
Renton, WA 98056
|
4,990 sq. feet
|
6 baths 6 beds |
show details | |

|
#38
135th Pl SE
Renton, WA 98058
|
1,630 sq. feet
|
2 baths 3 beds |
show details | |

|
#39
SE 183rd St
Renton, WA 98055
|
2,210 sq. feet
|
2 baths 3 beds |
show details | |

|
#40
N 28th Pl
Renton, WA 98056
|
1,850 sq. feet
|
2 baths 4 beds |
show details |
| Photo | Address | Area | Beds / Baths | Price | Details |
|---|---|---|---|---|---|

|
#41
SE 189th Pl
Renton, WA 98058
|
2,170 sq. feet
|
2 baths 4 beds |
show details | |

|
#42
204th Ave SE
Renton, WA 98059
|
1,770 sq. feet
|
2 baths 3 beds |
show details | |

|
#43
196th Ave SE
Renton, WA 98058
|
1,340 sq. feet
|
1 baths 3 beds |
show details | |

|
#44
NE 19th St
Renton, WA 98056
|
2,740 sq. feet
|
2 baths 4 beds |
show details | |

|
#45
SE 160th St
Renton, WA 98058
|
1,670 sq. feet
|
1 baths 4 beds |
show details | |

|
#46
SE 173rd St
Renton, WA 98055
|
1,140 sq. feet
|
1 baths 3 beds |
show details | |

|
#47
170th Ave SE
Renton, WA 98059
|
1,980 sq. feet
|
1 baths 4 beds |
show details | |

|
#48
120th Ave SE
Renton, WA 98058
|
960 sq. feet
|
1 baths 2 beds |
show details | |

|
#49
143rd Ave SE
Renton, WA 98058
|
3,590 sq. feet
|
2 baths 3 beds |
show details | |

|
Check over 1 million property listings on Foreclosure.com!
|
browse all offers | |||

Latest news about housing in Renton, WA collected exclusively by city-data.com from local newspapers, TV, and radio stations

 | Best Renton apartments and commute question? (3 replies) |
| Townhouse in Newcastle Vs SFH in East Renton Highlands (80 replies) |
| Apartments In or Near Renton? (1 reply) |
| Renton - max number of unrelated occupants in a home? (3 replies) |
| Looking for a place in Renton (3 replies) |
| Renting an apartment in the Renton, Kent or Auburn area?? (2 replies) |
Median year apartment built: 1992
Household type by relationship:
Households: 104,060- Male householders: 24,214 (7,646 living alone), Female householders: 18,271 (6,845 living alone)
17,942 spouses (17,813 opposite-sex spouses), 3,218 unmarried partners, (2,831 opposite-sex unmarried partners), 25,405 children (24,554 natural, 542 adopted, 309 stepchildren), 1,104 grandchildren, 2,215 brothers or sisters, 3,495 parents, 72 foster children, 2,515 other relatives, 4,578 non-relatives
- In group quarters: 1,031
Size of family households: 9,394 2-persons, 5,474 3-persons, 4,967 4-persons, 2,263 5-persons, 856 6-persons, 795 7-or-more-persons.
Size of nonfamily households: 14,491 1-person, 3,282 2-persons, 710 3-persons, 253 4-persons.
12,448 married couples with children.
2,764 single-parent households (414 men, 2,350 women).
58.6% of residents of Renton speak English at home.
6.9% of residents speak Spanish at home (59% speak English very well, 17% speak English well, 14% speak English not well, 9% don't speak English at all).
6.6% of residents speak other Indo-European language at home (56% speak English very well, 22% speak English well, 19% speak English not well, 4% don't speak English at all).
23.4% of residents speak Asian or Pacific Island language at home (47% speak English very well, 29% speak English well, 17% speak English not well, 7% don't speak English at all).
4.6% of residents speak other language at home (68% speak English very well, 25% speak English well, 7% speak English not well).
Foreign born population: 33,733 (32.4%)
(61.2% of them are naturalized citizens)
| Here: | 6.1 |
| State: | 6.5 |
| Here: | 3.9 |
| State: | 3.9 |
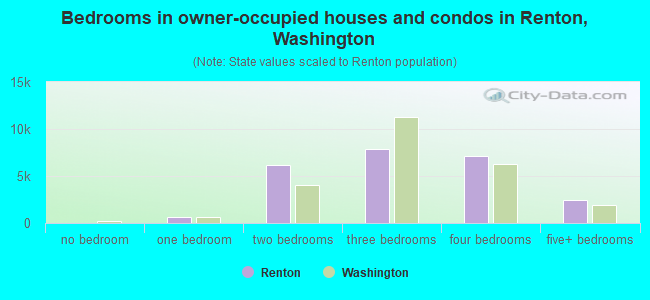
- Bedrooms in owner-occupied houses and condos in Renton, Washington
- 0no bedroom
- 6591 bedroom
- 6,2142 bedrooms
- 7,9173 bedrooms
- 7,1734 bedrooms
- 2,5005+ bedrooms
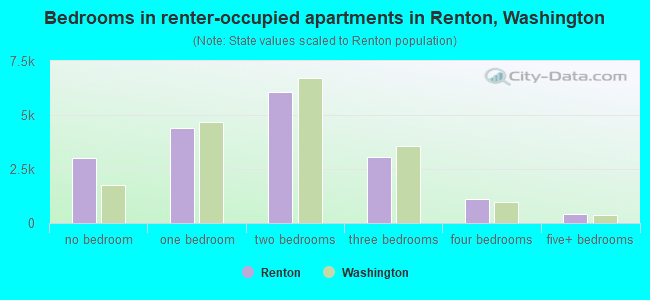
- Bedrooms in renter-occupied apartments in Renton, Washington
- 2,997no bedroom
- 4,4021 bedroom
- 6,0512 bedrooms
- 3,0683 bedrooms
- 1,0894 bedrooms
- 4155+ bedrooms
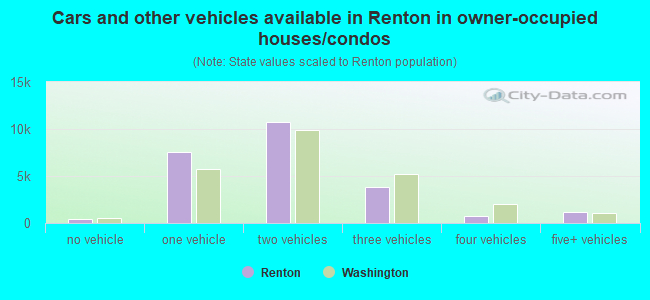
- Cars and other vehicles available in Renton in owner-occupied houses/condos
- 396no vehicle
- 7,5251 vehicle
- 10,7882 vehicles
- 3,8493 vehicles
- 7764 vehicles
- 1,1295+ vehicles
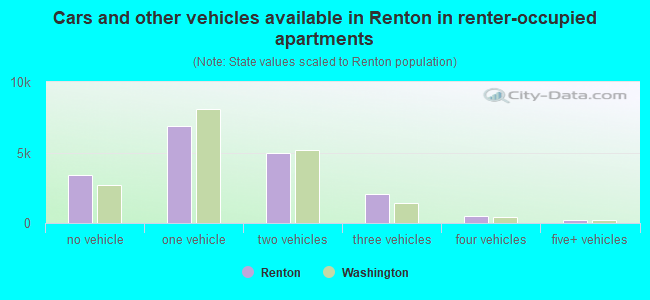
- Cars and other vehicles available in Renton in renter-occupied apartments
- 3,408no vehicle
- 6,9001 vehicle
- 4,9752 vehicles
- 2,0243 vehicles
- 4904 vehicles
- 2255+ vehicles
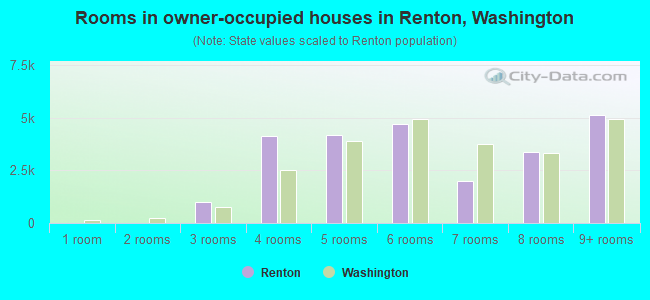
- Rooms in owner-occupied houses in Renton, Washington
- 01 room
- 02 rooms
- 9963 rooms
- 4,1094 rooms
- 4,1865 rooms
- 4,6826 rooms
- 1,9887 rooms
- 3,3808 rooms
- 5,1229+ rooms
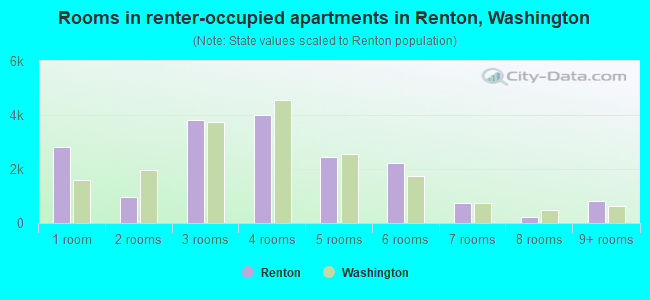
- Rooms in renter-occupied apartments in Renton, Washington
- 2,8181 room
- 9812 rooms
- 3,7973 rooms
- 3,9844 rooms
- 2,4475 rooms
- 2,2216 rooms
- 7317 rooms
- 2408 rooms
- 8039+ rooms
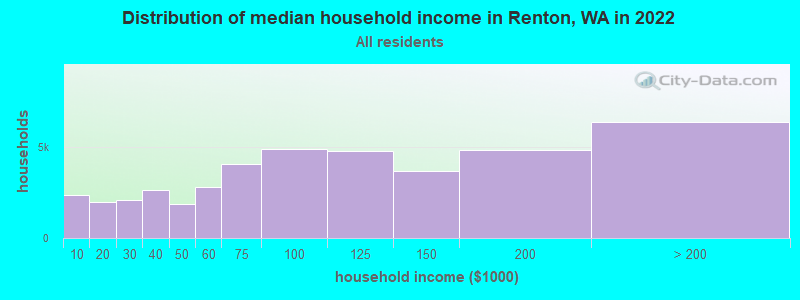
Renton, WA household income distribution

- 2,353Less than $10,000
- 2,011$10,000 to $19,999
- 2,096$20,000 to $29,999
- 2,619$30,000 to $39,999
- 1,895$40,000 to $49,999
- 2,815$50,000 to $59,999
- 4,083$60,000 to $74,999
- 4,887$75,000 to $99,999
- 4,799$100,000 to $124,999
- 3,704$125,000 to $149,999
- 4,831$150,000 to $199,999
- 6,392$200,000 or more
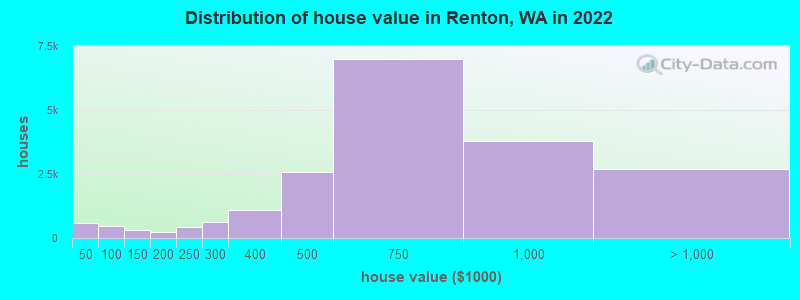
Home value of owner - occupied houses in 2022 in Renton, WA
-
- 341Less than $10,000
- 64$10,000 to $14,999
- 20$15,000 to $19,999
- 22$20,000 to $24,999
- 15$30,000 to $34,999
- 48$35,000 to $39,999
- 76$40,000 to $49,999
- 112$50,000 to $59,999
- 141$60,000 to $69,999
- 71$70,000 to $79,999
- 45$80,000 to $89,999
- 29$90,000 to $99,999
- 286$100,000 to $124,999
- 8$125,000 to $149,999
- 157$150,000 to $174,999
- 90$175,000 to $199,999
- 438$200,000 to $249,999
- 620$250,000 to $299,999
- 1,093$300,000 to $399,999
- 2,559$400,000 to $499,999
- 6,984$500,000 to $749,999
- 3,777$750,000 to $999,999
- 1,881$1,000,000 to $1,499,999
- 353$1,500,000 to $1,999,999
- 441$2,000,000 or more
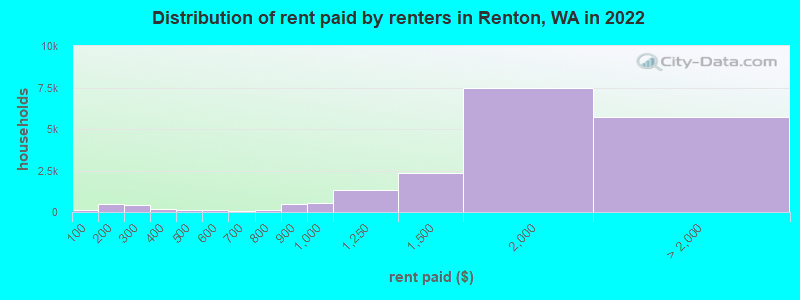
Rent paid by renters in 2022 in Renton, WA
-
- 103Less than $100
- 85$100 to $149
- 388$150 to $199
- 303$200 to $249
- 90$250 to $299
- 72$300 to $349
- 123$350 to $399
- 72$400 to $449
- 32$450 to $499
- 87$500 to $549
- 29$550 to $599
- 13$600 to $649
- 33$650 to $699
- 120$750 to $799
- 511$800 to $899
- 522$900 to $999
- 1,331$1,000 to $1,249
- 2,336$1,250 to $1,499
- 7,486$1,500 to $1,999
- 3,215$2,000 to $2,499
- 1,467$2,500 to $2,999
- 446$3,000 to $3,499
- 327$3,500 or more
- 278No cash rent
Percentage of workers working in this county: 93.2%
Number of people working at home: 13,009 (22.5% of all workers)
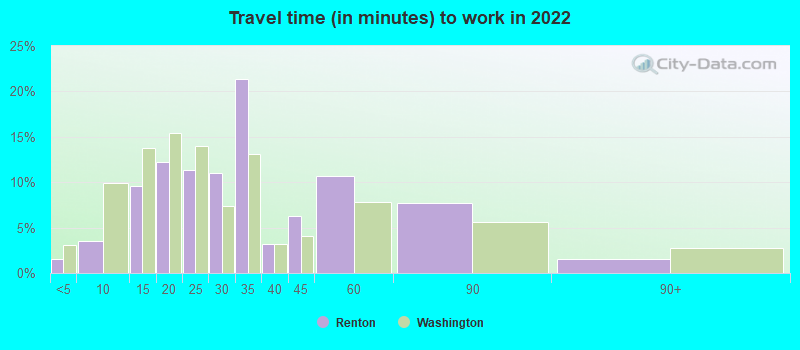
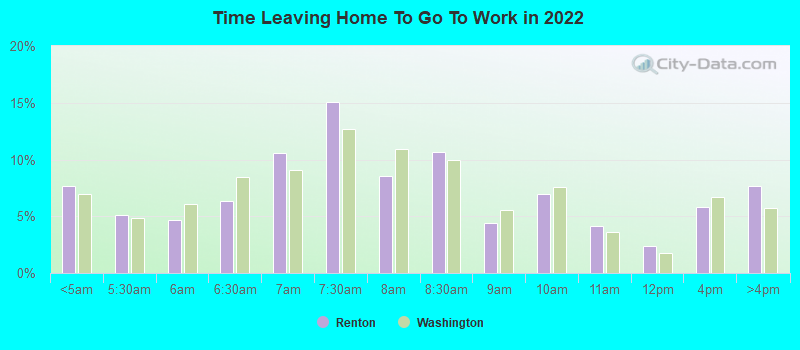
Travel time to work (commute)
- Less than 5 minutes: 1,014
- 5 to 9 minutes: 1,671
- 10 to 14 minutes: 3,650
- 15 to 19 minutes: 5,301
- 20 to 24 minutes: 7,285
- 25 to 29 minutes: 3,066
- 30 to 34 minutes: 8,485
- 35 to 39 minutes: 2,098
- 40 to 44 minutes: 2,723
- 45 to 59 minutes: 4,839
- 60 to 89 minutes: 2,454
- 90 or more minutes: 1,100
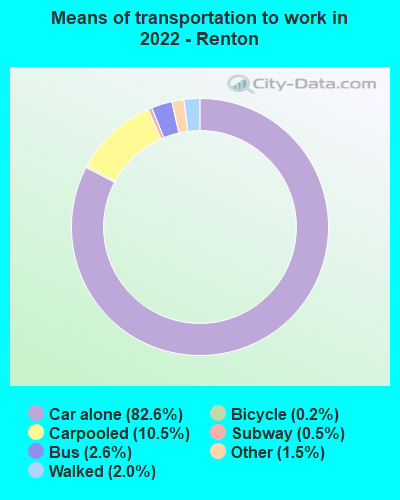
Means of transportation to work:
- Drove a car alone: 43,868 (67.7%)
- Carpooled: 5,347 (8.2%)
- Bus: 838 (1.3%)
- Long-distance train or commuter rail: 132 (0.2%)
- Light rail, streetcar or trolley: 10 (0.0%)
- Ferryboat: 28 (0.0%)
- Taxi: 728 (1.1%)
- Bicycle: 108 (0.2%)
- Walked: 956 (1.5%)
- Worked at home: 13,009 (20.1%)
- Unemployment by race in 2022
- Unemployment rate for White non-Hispanic residents
- 3.5%Males
- 2.5%Females
- Unemployment rate for Black residents
- 8.4%Males
- 4.2%Females
- Unemployment rate for American Indian and Alaska Native residents
- 2.9%Males
- 11.6%Females
- Unemployment rate for Asian residents
- 1.3%Males
- 7.0%Females
- Unemployment rate for other race residents
- 1.2%Males
- 9.3%Females
- Unemployment rate for two or more race residents
- 3.7%Males
- 4.2%Females
- Unemployment rate for Hispanic or Latino residents
- 1.4%Males
- 6.7%Females
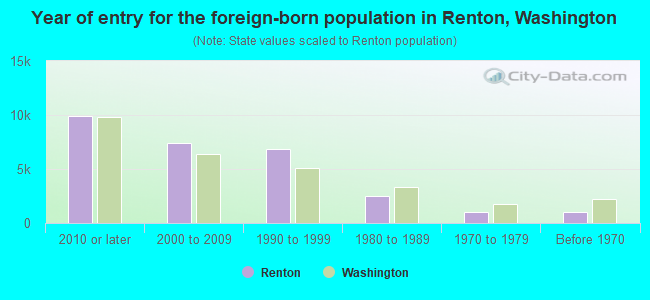
- Year of entry for the foreign-born population in Renton, Washington
- 9,8862010 or later
- 7,3742000 to 2009
- 6,8671990 to 1999
- 2,4671980 to 1989
- 1,0221970 to 1979
- 1,058Before 1970
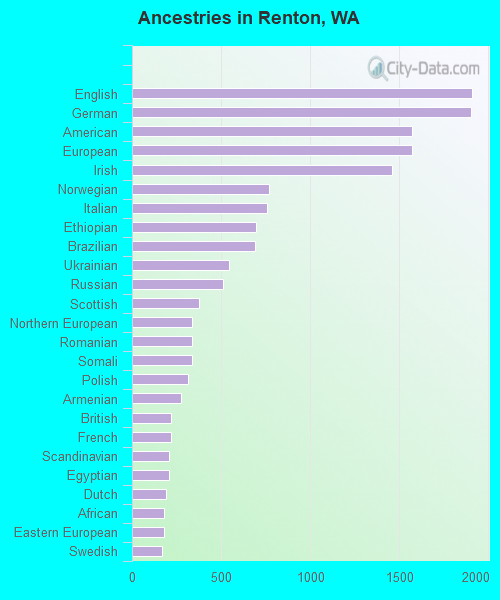
First ancestries reported:
- English: 1,908 (3.2%)
- German: 1,900 (3.2%)
- American: 1,570 (2.7%)
- European: 1,569 (2.7%)
- Irish: 1,458 (2.5%)
- Norwegian: 770 (1.3%)
- Italian: 755 (1.3%)
- Ethiopian: 694 (1.2%)
- Brazilian: 692 (1.2%)
- Ukrainian: 543 (0.9%)
- Russian: 510 (0.9%)
- Scottish: 374 (0.6%)
- Northern European: 338 (0.6%)
- Romanian: 337 (0.6%)
- Somali: 335 (0.6%)
- Polish: 316 (0.5%)
- Armenian: 276 (0.5%)
- British: 220 (0.4%)
- French: 219 (0.4%)
- Scandinavian: 209 (0.4%)
- Egyptian: 207 (0.4%)
- Dutch: 190 (0.3%)
- African: 182 (0.3%)
- Eastern European: 181 (0.3%)
- Swedish: 171 (0.3%)
- Turkish: 162 (0.3%)
- Portuguese: 131 (0.2%)
- Scotch-Irish: 121 (0.2%)
- Czech: 120 (0.2%)
- Palestinian: 109 (0.2%)
- Iranian: 102 (0.2%)
- Moroccan: 100 (0.2%)
- Canadian: 98 (0.2%)
- Ghanaian: 97 (0.2%)
- Iraqi: 83 (0.1%)
- Nigerian: 83 (0.1%)
- Danish: 70 (0.1%)
- Swiss: 66 (0.1%)
- South African: 60 (0.1%)
- Slovak: 58 (0.10%)
- Latvian: 55 (0.09%)
- Jamaican: 55 (0.09%)
- Kenyan: 53 (0.09%)
- French Canadian: 53 (0.09%)
- Greek: 37 (0.06%)
- Hungarian: 35 (0.06%)
- Lithuanian: 33 (0.06%)
- Croatian: 31 (0.05%)
- Haitian: 28 (0.05%)
- Welsh: 27 (0.05%)
- Yugoslavian: 27 (0.05%)
- Macedonian: 23 (0.04%)
- Finnish: 22 (0.04%)
- Austrian: 21 (0.04%)
- Slovene: 20 (0.03%)
- Israeli: 18 (0.03%)
- German Russian: 17 (0.03%)
- Lebanese: 16 (0.03%)
- West Indian: 15 (0.03%)
- Syrian: 14 (0.02%)
- Bulgarian: 12 (0.02%)
- Czechoslovakian: 10 (0.02%)
- New Zealander: 4 (0.01%)
Most common places of birth for foreign-born residents (%):
| Renton: | 18.1% (5,679) |
| Washington: | 5.4% (62,003) |
| Renton: | 12.2% (3,835) |
| Washington: | 21.1% (241,655) |
| Renton: | 9.4% (2,956) |
| Washington: | 6.3% (71,661) |
| Renton: | 9.1% (2,848) |
| Washington: | 7.4% (84,470) |
| Renton: | 6.7% (2,086) |
| Washington: | 8.9% (101,353) |
| Renton: | 3.7% (1,160) |
| Washington: | 4.3% (48,886) |
| Renton: | 2.7% (854) |
| Washington: | 0.8% (9,359) |
| Renton: | 2.2% (685) |
| Washington: | 0.9% (9,937) |
| Renton: | 2.2% (675) |
| Washington: | 1.9% (21,540) |
| Renton: | 2.1% (655) |
| Washington: | 1.0% (10,993) |
| Renton: | 1.8% (563) |
| Washington: | 1.6% (17,938) |
| Renton: | 1.7% (531) |
| Washington: | 0.8% (8,785) |
| Renton: | 1.7% (522) |
| Washington: | 1.5% (16,607) |
| Renton: | 1.7% (521) |
| Washington: | 3.1% (35,872) |
Place of birth for U.S.-born residents:
- This state: 40,851
- Other state: 28,245
- Northeast: 2,623
- Midwest: 7,343
- South: 6,224
- West: 12,055
83.5% of Renton residents lived in the same house 1 years ago.
Out of people who lived in different houses, 40.1% lived in this county.
Out of people who lived in different counties, 38.2% lived in Washington.
| Renton: | 83.5% |
| State average: | 85.2% |
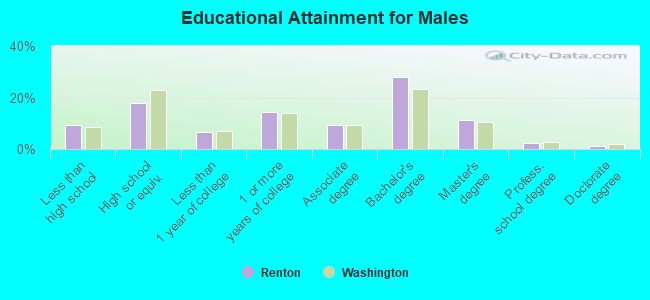
Education attainment for males 25 years and older:
- No schooling: 1,402
- Nursery to 4th grade: 0
- 5th and 6th grade: 305
- 7th and 8th grade: 538
- 9th grade: 217
- 10th grade: 307
- 11th grade: 310
- 12th grade, no diploma: 757
- High school graduate (or equivalency): 7,290
- Less than 1 year of college: 2,602
- Some college more than 1 year, no degree: 5,880
- Associate degree: 3,722
- Bachelor's degree: 11,371
- Master's degree: 4,525
- Professional school degree: 873
- Doctorate degree: 499
Education attainment for females 25 years and older:
- No schooling: 1,512
- Nursery to 4th grade: 527
- 5th and 6th grade: 158
- 7th and 8th grade: 307
- 9th grade: 663
- 10th grade: 189
- 11th grade: 342
- 12th grade, no diploma: 1,072
- High school graduate (or equivalency): 8,117
- Less than 1 year of college: 1,065
- Some college more than 1 year, no degree: 3,948
- Associate degree: 3,584
- Bachelor's degree: 10,138
- Master's degree: 3,775
- Professional school degree: 859
- Doctorate degree: 421

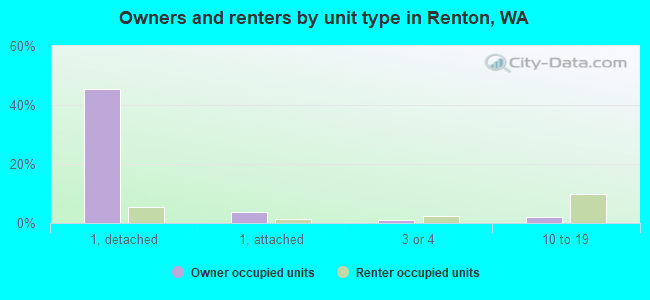
Housing units in structures:
- One, detached: 21,126
- One, attached: 3,907
- Two: 713
- 3 or 4: 2,273
- 5 to 9: 3,615
- 10 to 19: 2,988
- 20 to 49: 2,527
- 50 or more: 5,545
- Mobile homes: 979
Median worth of mobile homes: $92,580
Housing units lacking complete kitchen facilities in 2022: 1.8%
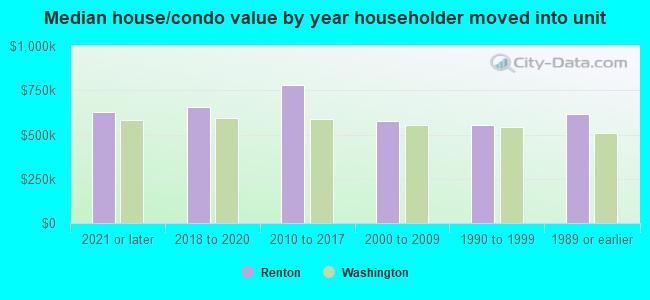
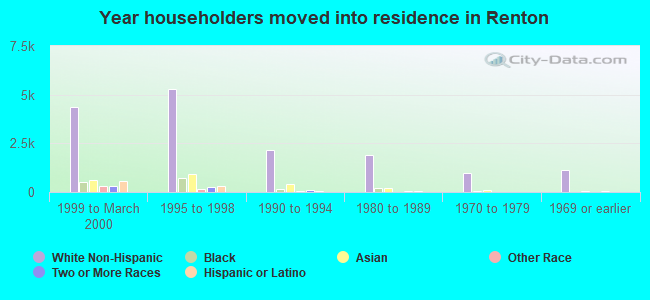
House/condo owner moved in on average 10 years ago
Renter moved in on average 2 years ago
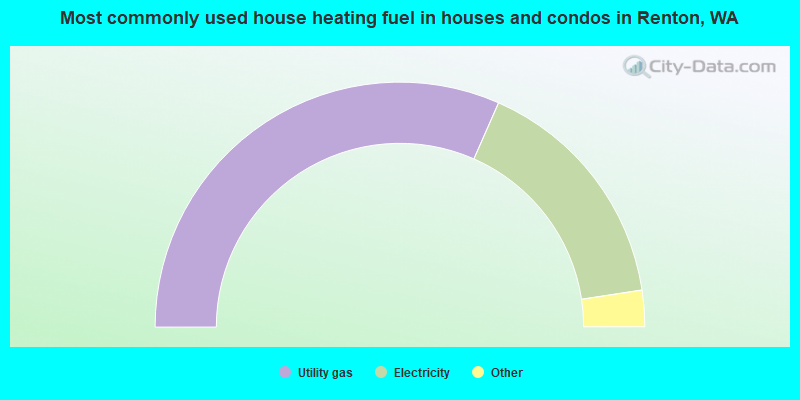
- 63.2%Utility gas
- 32.0%Electricity
- 2.5%Bottled, tank, or LP gas
- 1.6%Fuel oil, kerosene, etc.
- 0.2%Wood
- 0.2%Other fuel
- 0.2%No fuel used
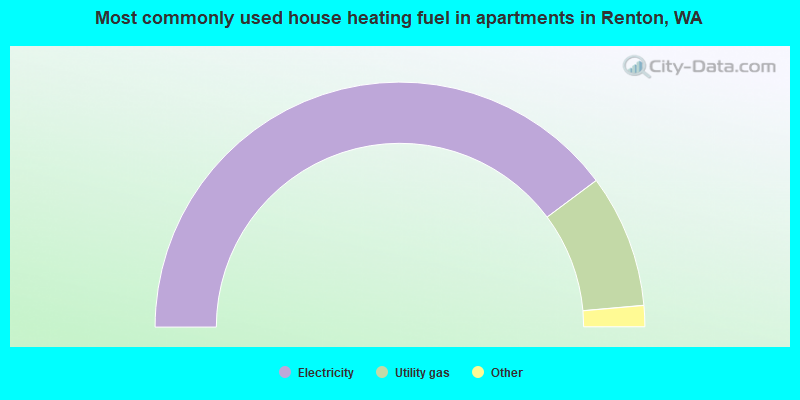
- 79.6%Electricity
- 17.6%Utility gas
- 0.9%No fuel used
- 0.8%Bottled, tank, or LP gas
- 0.6%Fuel oil, kerosene, etc.
- 0.3%Other fuel
- 0.2%Wood
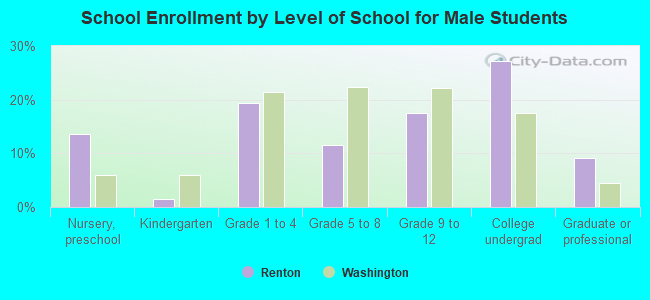
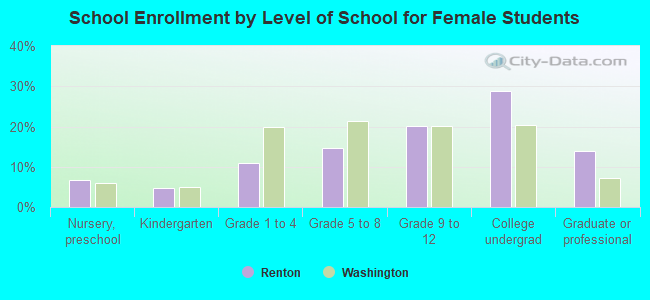
Private vs. public school enrollment:
| Here: | 8.3% |
| Washington: | 12.4% |
| Here: | 9.0% |
| Washington: | 9.2% |
| Here: | 20.6% |
| Washington: | 16.5% |